


Chief Global Strategist
The earnings season has started with a blast. As of Friday morning, 49 of the S&P500 companies had reported second-quarter earnings, with 85% beating expectations and the index on track for a blockbuster 23% year-over-year gain for the quarter. According to FactSet, analysts now expect S&P500 operating earnings to reach $340.74 for 2026 as a whole, up 24% from 2025, following strong back-to-back gains of 10% and 13% in 2024 and 2025 respectively.
This profit surge is normally analyzed in terms of companies and sectors and recent gains look particularly concentrated, with 10 companies, mostly in tech, accounting for 75% of the expected growth in second-quarter earnings. When questions are asked about the sustainability of the profit surge, the investigation usually centers first, on whether genuine revenues from AI technology can ramp up fast enough to justify current capital spending and second, on how broadly the ripple effects of AI investment spending and wealth creation could ripple out across the economy.
However, profit growth has been outpacing overall economic growth for decades and a top-down macro perspective can also be useful in identifying the broader forces that have fueled this surge. In broad terms, profit growth has been powered by the ability of U.S. firms to control compensation costs while taking advantage of a more favorable interest rate and tax environment. This begs the question of whether these beneficial forces can continue and whether other broad forces might slow or even reverse the profit surge.
The Surge in Profits
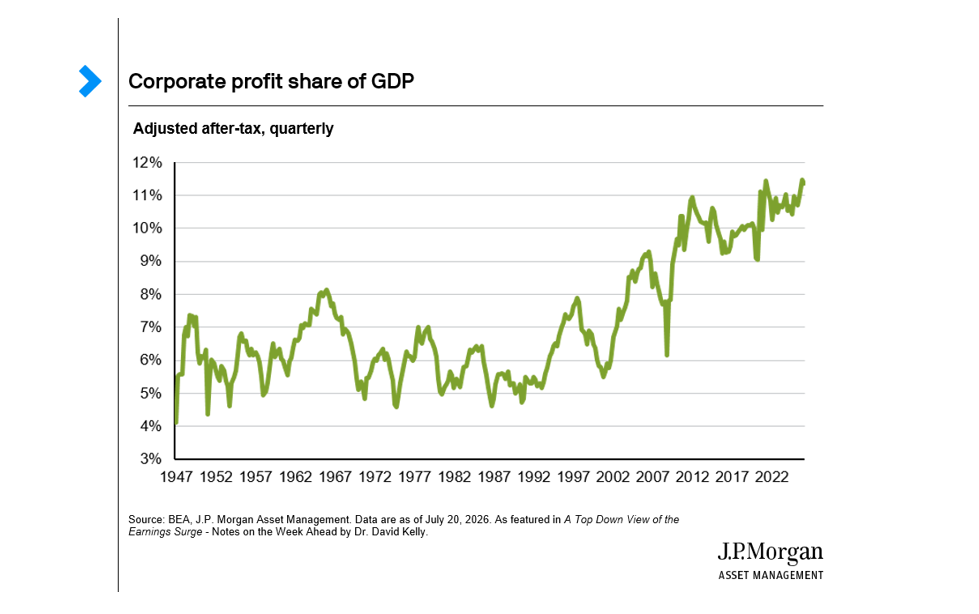
A top-down view of profits starts with the adjusted after-tax profits for all U.S. corporations as compiled by the Bureau of Economic Analysis.
From 1947 to the mid-1990s, this measure of profits hovered in a narrow range around 6% of GDP. Since then, despite sharp swings through recessions and recoveries, the ratio has trended higher, hitting a peak of 11.5% of GDP in the fourth quarter of 2025 before easing back slightly to 11.4% of GDP in the first quarter of this year. As a result, over the past 30 years, while nominal GDP has grown at an annual pace of 4.8%, adjusted after-tax profits have grown at a 6.3% rate.
This profit surge has provided a strong foundation for a rising stock market and those of us who have lived and worked through these boom years for stocks can easily think of the trend in terms of favored industries – tech, energy, housing, financials and tech again.
However, the profit surge can also be examined through a different lens. The after-tax profit share of national income – its slice of the pie, so to speak - has grown because other slices have been squeezed. These include worker compensation, both in the form of wages and of benefits, net interest costs and corporate taxes. Deprecation expense, conversely, has gradually risen. Looking forward, while economic growth will be determined by trends in the workforce, productivity and inflation, the growth in profits will also depend on whether the corporate share of the economic pie continues to rise. This, in turn, depends on the other slices.
The Falling Power of Labor
In the first quarter of 2026, the adjusted after-tax profits of all U.S. corporations amounted to $3.624 trillion at an annual rate, or 11.4% of GDP. This was up 5.9 percentage points from an average of 5.5% of GDP in the decade that ended in the fourth quarter of 1994. But if the profit share was up, what was down?
The most obvious answer is worker compensation which fell from 55.7% of GDP to 50.5% over the same period. The compensation share of GDP rose through the 1950s and 1960s, declined a little for the rest of the 20th century and has fallen sharply over the past 25 years. Moreover, the trend is even more dramatic when compensation is broken down into wages and benefits.
Wages peaked at 51.9% of GDP in the first quarter 1970 and have fallen very sharply ever since, reaching 41.6% in the first quarter of 2026. Over the 1970s and 1980s, this trend was somewhat offset in corporate income statements by fast-rising benefits1. This, in turn, reflected union success in pushing for enhanced benefits in general, as well as soaring medical insurance costs and the increased cost of funding defined benefit pension plans.
However, in recent years, companies have had some success in restraining the growth in benefits. In the 20 years from 1986 to 2006, insurance benefits (mainly health insurance) rose from 5.5% of total compensation for private sector workers to 7.4%. Over the last 20 years, despite an aging workforce and a growing number of available but expensive treatments and drugs, this has risen more slowly to 7.8%. Over the last 40 years, the cost of retirement contributions has also fallen from 3.8% of compensation to 3.4%, as businesses have transitioned from defined benefit plans to less-expensive defined contributions plans. Workers comp contributions have also fallen steadily from 2.3% of total compensation in the first-quarter of 1993 to just 0.9% in the first quarter of this year, reflecting fewer workplace injuries and state-level reforms.
The fall in labor compensation as a share of GDP may reflect a long and steady decline in union power with the unionized share of private sector workers having fallen below 6%. Or it could be that management has just become much more skilled at deflecting wage and benefit demands over the years.
Whatever the reason, there is little sign that this trend is reversing. Even with a very tight labor market, the real wages of production workers fell, on a year-over-year basis, for a third consecutive month in June. Moreover, strike activity remains muted with only 16 major strikes in the first half of 2026, far below the average of almost 300 strikes per year seen in the 1970s. Given this, and with the threat of replacement by AI now taking over from the threat of replacement by foreign workers, the most likely scenario is for a continued slow decline in the compensation share of national income, thereby boosting corporate profits.
The Diminishing Corporate Tax Burden
A second important tailwind for after-tax profits has been falling effective tax rates. At first glance, this isn’t obvious – the corporate tax share of GDP actually rose from 2.1% in the decade that ended in the fourth quarter of 1994 to 2.5% in the first quarter of 2026. However, corporate taxes have not risen nearly as fast as the profits being taxed. The average effective tax rate on corporate profits fell from 28.1% in the decade that ended in the fourth quarter of 1994 to 18.1% in the first quarter of 2026. To put this in perspective, as noted earlier, adjusted after-tax profits have risen by 6.3% per year over the past 30 years. However, if effective corporate tax rates had not fallen, this number would only have been 5.9%.
- This falling corporate tax burden has been the result of major legislation including:
- The 1981 Tax Act which introduced accelerated depreciation and expanded investment tax credits.
- The 1986 Tax Act which cut the statutory corporate tax rate from 46% to 34%.
- The 2017 Tax Act which cut the statutory rate further to 21% and,
- The 2025 Act which restored immediate expensing of R&D and equipment purchases.
Effective rates fell by less than statutory rates over this period, partly because of base-broadening efforts and also due to the introduction of an alternative minimum corporate tax in 1986 (which was repealed in 2017 but then revived in 2022).
In general, Washington has been very kind to shareholders in recent decades both in relation to declining corporate taxes and lower taxes on dividends and capital gains. But will this continue?
There are some headwinds in the short run.
First, corporations appear to be absorbing much of the cost of new tariffs introduced since 2025. Between December 2024 and June 2026, import prices for goods excluding food and energy, which are calculated before tariffs, rose by 4.8%, while consumer prices for goods excluding food and energy, which include the cost of tariffs rose just 1.5%. Over the same period, the average effective tariff rate on imported goods climbed from 2.6% to 7.6%.
If foreign producers had been absorbing the full cost of the tariffs, then import prices would have fallen over this period. If companies were passing most of the cost of the tariffs to consumers, consumer prices for core goods would have risen faster than import prices. The fact that neither of these things happened suggest that, while US companies are pretty good at restraining compensation, they are not nearly as successful at passing on higher costs to consumers. While we don’t expect tariff rates to rise significantly in the near term, this is something to consider if, for some reason, Washington doubles down on using tariffs as a source of revenue in the future.
Second, it should be noted that much of the corporate tax benefit from OBBBA was in the form of the reintroduction of 100% expensing of R&D and equipment purchases. However, estimates of the cost of these provisions show the biggest tax break for companies occurring in fiscal 2025 and 2026, with diminishing impacts thereafter2. After all, a firm that expenses capital spending in year one can’t very well then depreciate the same investment for tax purposes in future years.
Finally, there may be a risk that the federal government will, sooner or later, look to corporations to plug part of a growing budget gap, with the federal deficit on track to top $2 trillion this year and federal debt expected to rise from 100% of GDP currently to well over 120% by the middle of the next decade.
All of this being said, in the current American political climate, it is more likely that the business community will be successful in lobbying for continued low corporate tax rates even as the fiscal situation deteriorates. Money has never been more powerful in U.S. politics than it is today and, armed with the tools of social media and artificial intelligence, is more capable of defending corporate interests than ever before.
A Turn in Interest Costs
All of this being said, there are also some real challenges to the corporate profit surge. One of them is interest expense.
The data on corporate interest expense in the national income and product accounts is muddied by the treatment of owner-occupied housing. However, a clearer perspective is provided by the interest expense of S&P500 companies as a share of sales. This ratio rose from 3.0% in the first quarter of 1996 to 5.7% in the third quarter of 2007 at the peak of the housing bubble. It then fell steadily to just 1.4% by the end of 2021 but has since risen to 2.4%.
From here it is likely to rise further, reflecting new corporate debt issuance to pay for the AI buildout. In addition, the Moody’s Baa corporate bond yield as of last Thursday stood at 6.16% - 159 basis points above the 10-year Treasury yield of 4.57%. We expect Treasury bond yields to move up, on average, in the years ahead due to increased government debt issuance, while the spread between corporate yields and Treasury yields is now tighter than it has been 85% of the time over the past 50 years and could, therefore, be expected to widen going forward. Finally, with corporate bond yields significantly higher than in the decade after 2012, the gradual replacement of old debt with new debt should raise interest expense.
Appreciating the Depreciation Problem
And then there is depreciation.
There is, of course, the current very specific question about how rapidly hyperscalers should depreciate their investments in semiconductors, given the rapid product cycle of cutting-edge GPUs. Accounting at both the corporate level and in the national income and product accounts may be using a too-slow depreciation schedule and, consequently, may be overstating current corporate profits with a real risk of a greater overstatement in the years ahead. However, even ignoring this issue, measured depreciation of business fixed assets has been trending up for decades and is likely to accelerate over the next few years due to increased capital spending. As just one measure of this, business fixed investment rose to 14.1% of GDP in the first quarter of this year – its biggest share of GDP in 25 years – and we expect it to continue to grow faster than the overall economy until the next recession. While this is generally a very positive trend, it could, of course be very negative for corporate profits if, for some reason, AI revenue growth were to slow even as depreciation expense rises
Investment Implications
There are at least two other major issues that will impact profit growth going forward. First, the foreign profits of U.S.-based companies should continue to rise and may well receive a boost from a falling dollar over the next few years. Second, overlaying all of this are the productivity gains expected from AI. In a world in which companies continue to be able to hold wages in check, corporations may garner an out-sized share of these efficiency gains.
Pulling these strands together, until the next recession, it looks likely that profits will continue to rise a little faster than the overall economy. That being said, even in a continued economic expansion with little political change, rising interest rates and depreciation expense should slow the pace of profit growth. Moreover, it is always possible that there will be radical political change with some future administration seeking to boost wages and limit the rise in federal debt by imposing higher corporate taxes. This risk, like many others, suggests that, even with a still benign base-case outlook for corporate profits, investors should consider rebalancing portfolios that have drifted into being both overly concentrated and overly aggressive.