


Chief Global Strategist
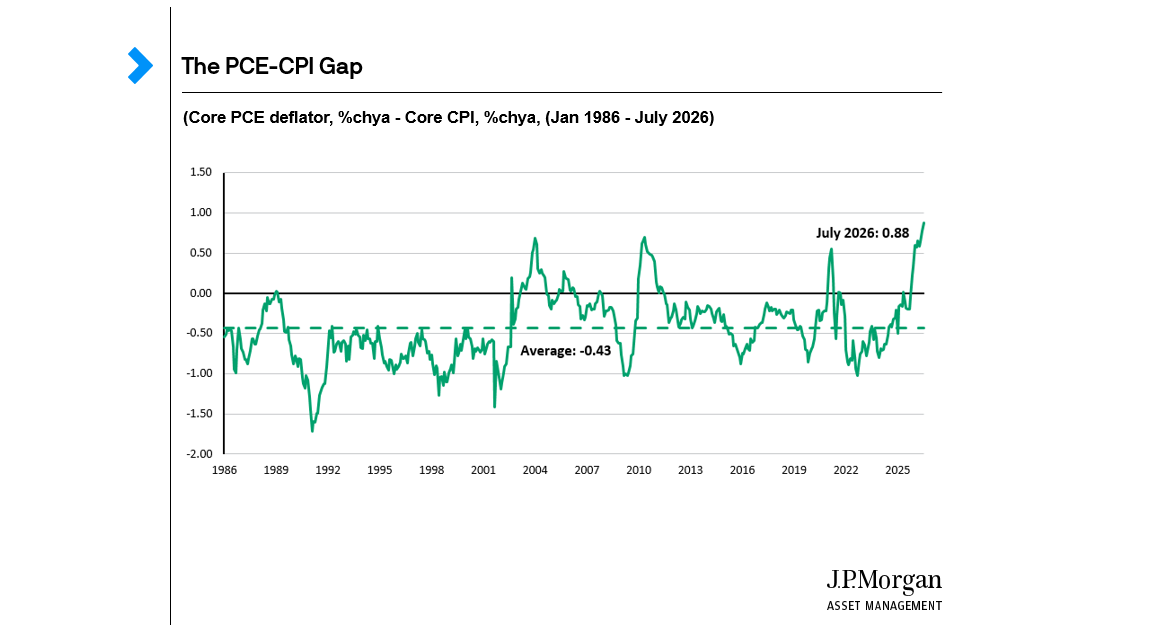
On balance, I don’t believe that the Federal Reserve should have raised interest rates last week. However, I must confess that there was one reference in Chairman Warsh’s press conference that left me distinctly uneasy. He noted that year-over-year inflation rates, as measured by the core personal consumption expenditure (PCE) deflator and the core consumer price index (CPI) were running at about 3.2% and 2.4% respectively.
There is nothing alarming about core CPI inflation of 2.4%. Energy shocks, such as the one we are seeing right now, tend to be short-lived and core inflation, that is inflation excluding food and energy, tends to be a better predictor of where inflation is going than headline inflation. Over the past 40 years, core PCE inflation has run an average of 0.43% cooler than core CPI inflation. Since the Fed’s long-term target is 2.0% headline PCE inflation, a core CPI inflation rate of 2.4% would seem to be right on track.
However, as Warsh’s numbers underscore, PCE inflation is now running hotter than CPI inflation. In fact, in July, the year-over-year increase in the core PCE deflator was 0.88% higher than core CPI inflation, the biggest positive gap in more than 40 years.
This statistical anomaly has arisen relatively recently. Just 18 months earlier, in January 2025, year-over-year core PCE inflation was 2.8% compared to 3.3% for the CPI measure. This anomaly is unlikely to last as the core PCE-CPI gap is highly mean-reverting. However, will it revert because CPI inflation rises or PCE inflation falls?
This is a critical question for financial markets. In his July congressional testimony, Chairman Warsh made it clear that the Fed has no tolerance for persistently elevated inflation – an attitude confirmed by last week’s rate hike. However, if the PCE-CPI gap closes by CPI inflation rising, the Fed may well follow through with the three additional rate hikes that futures markets have priced in for the next year. If, on the other hand, PCE inflation drifts down to close the gap, the Fed may be satisfied to raise rates just once more at the end of this year as they themselves project in their dot plot.
But which will it be? The best way to explore the issue starts by asking how this positive gap opened up in the first place.
A Framework for Investigation
In 2007, the Bureau of Economic Analysis (BEA) outlined a methodology for analyzing the difference between CPI and PCE measures of inflation. Today, on a monthly basis, they update the numbers in this methodology1. The latest data are from July 2026.
In broad terms, they bucket the differences between the two inflation measures into four groups of effects: a formula effect, a weight effect, a scope effect and “other”. A good way to look at the PCE-CPI gap is to see how these effects have evolved since the start of 2025.
The formula effect comes from the fact that the CPI uses a fixed-weight basket of goods and services in calculating inflation while the PCE deflator uses a chain-weight basket that evolves over time with actual spending patterns. Since people tend to substitute away from goods and services that have large price increases and toward those that have small increases, fixed-weight indices tend to overweight high inflation areas compared to chain-weight indices.
However, this formula effect has diminished over time as the Bureau of Labor Statistics (BLS) moved from updating its CPI basket only once a decade prior to 2002, to once every two years from 2002 to 2022 and to once a year since the start of 2023. This is a key reason why year-over-year core PCE inflation ran an average of 0.7% cooler than core CPI inflation between August 1986 and December 2001, but just 0.3% cooler between January 2002 and December 2022 and just 0.2% cooler between January 2023 and July 2026. However, the formula effect didn’t change over the past 18 months so this didn’t cause the recent spike in the PCE-CPI gap.
The weight effect refers to the fact that CPI and PCE can apply different weights to similar goods and services.
One big issue is shelter. Rent and owners’ equivalent rent account for 42% of core CPI but just 17% of core PCE. In both cases, this measure of housing costs is smoothed and lags actual transactions in the rental market. Indeed, in January 2025, while new leases were showing year-over-year inflation of between -0.4% and +2.8% according to industry sources, the government’s measures of rent and owners’ equivalent rent were up 4.2% and 4.6% respectively in both the PCE and CPI indices. Because of the much greater weight given to shelter in the CPI index, this boosted CPI inflation relative to PCE inflation. Since then, the government’s measures have come down to roughly 3.0%. This change alone has cut core CPI inflation by roughly 0.35% relative to core PCE.
Computer software and accessories is another area where weights make a difference. The category currently accounts for just 0.031% of the CPI basket but 1.1% of the PCE basket. This was of no importance at all in January 2025 when year-over-year inflation in this area was 0.4% in both the CPI and PCE indices. However, by July 2026, the year-over-year inflation rate had jumped to 21% in both indices, adding another 0.2% to the PCE-CPI gap.
The scope effect refers to the fact there are some categories within personal consumption expenditures that don’t show up at all in the CPI basket and vice versa. For example, the CPI only measures out-of-pocket health care expenses of consumers while the PCE health area includes payments by employers and others to provide health services and prescriptions to consumers. That being said, while both CPI and PCE measures have seen declines in health care inflation since the start of 2025, the greater weight of health care in the PCE measure is offset by a more significant decline in health cares costs in the CPI so, on net, health care has had no impact on the PCE-CPI gap.
One small area that has had a significant impact is financial services. Financial services have a very small 0.2% weight in the CPI as the BLS regards them as essentially part of saving rather than consumer spending. However, financial services, fees and commissions have a 2.83% weight in the PCE deflator and are currently calculated in a way that reflects a booming stock market. This category saw year-over-year inflation of over 14% in the July PCE accounts, adding over 0.4% to core PCE inflation although having a negligible impact on CPI inflation and thus providing a considerable boost to the PCE-CPI gap. In its annual re-benchmarking at the end of this month, the BEA is introducing a new methodology for financial services that will likely reduce this effect in the PCE deflator going forward.
Finally there is auto insurance which carries a 2.6% weight in CPI but just 0.5% in PCE. In January 2025, according to the very clunky way CPI accounts for auto insurance, rates were up 11.8% compared to 6.8% for PCE. By July of this year, the CPI measure was down 4.5% year-over-year compared to a 0.4% year-over-year increase in the PCE numbers. A little arithmetic shows that this sharp swing in auto insurance rates, combined with their different measurement and weight in the two indices, added 0.5% to the core PCE-CPI gap over the past 18 months.
Investment Implications
Adding it all up, what can we say about the rise in the core PCE-CPI gap between January 2025 and July 2026, where is it likely to go from here and what it means for monetary policy?
First, in January 2025, year-over-year core CPI inflation was at 3.3% year-over-year, 0.5% higher than core PCE inflation. This was something of a modern-day anomaly, due largely to the higher weight of auto insurance and owners’ equivalent rent in CPI and extraordinarily high inflation in those categories at the start of last year. Going forward, in the long run, core CPI inflation is much more likely to be just 0.1% or 0.2% higher than core PCE inflation.
Second, the flip to a sharply positive PCE-CPI gap in the following 18 months was due to:
- A reduction in CPI shelter inflation that likely has a small further distance to run.
- A huge increase in computer software and accessories inflation that also boosted PCE inflation more than CPI inflation but which will likely fade in the year ahead.
- A surge in financial services inflation that boosted PCE inflation relative to CPI inflation but which will likely be downgraded in a benchmark change in methodology, and,
- A collapse in CPI auto insurance inflation that will likely partly reverse.
In our overall inflation forecasts we assume there is some normalization in the flow of energy from the Middle East by the end of the year and no further fiscal stimulus. This, along with lower tariff rates than a year ago, sluggish rent growth due to weak demographics and soft wage growth, and despite a continued AI capital spending boom, should allow all broad inflation measures to drift down slowly. Moreover, because most of the forces that opened up a positive PCE-CPI gap are likely to reverse, we expect PCE inflation to fall more than CPI inflation.
This should come as some comfort to the Federal Reserve allowing them to stop an abbreviated tighten cycle with just one more rate hike in December, leaving the federal funds rate in a range of 4.00% to 4.25% throughout 2027. This would be less tightening than markets have priced in and should generally support risk assets, while not diminishing the importance of rebalancing to avoid concentrated portfolios that are exposed to many risks beyond inflation and interest rates.