


Chief Global Strategist
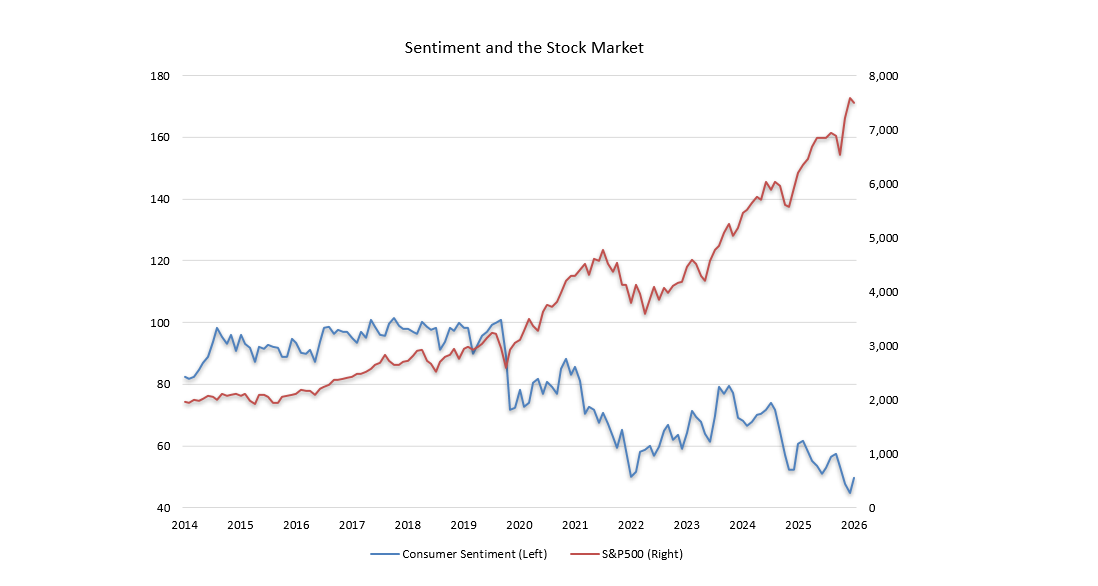
Despite very average economic performance, consumer sentiment remains at extraordinarily low levels. While there are many interesting aspects to this phenomenon, one is of particular relevance to investors. As we show on page 32 of the Guide to the Markets, peaks and troughs in consumer sentiment have, for many years, been powerful contra-indicators of stock market performance over the subsequent 12 months. However, does this relationship still hold, if the reason for weak sentiment is beyond the realm of a rational assessment of broad economic conditions?
As we enter the second half of 2026, it’s a good time to take a quick look at how the economy is performing, how that performance is impacting consumer sentiment and whether that can tell us anything about the likely direction of stock prices from here.
The Economy in June
Looking at the main economic numbers, the U.S. economy is neither surging nor faltering.
On growth, real GDP rose 2.1% annualized in the first quarter but may have slipped to less than 1% growth in the second. However, this downshift, if it shows up in the GDP report at the end of this month, will be due, almost entirely, to a sharp deterioration in volatile international trade and inventory numbers. This will likely be reversed quickly and could contribute to real GDP growth of better than 3% in the current quarter. Importantly, however, in the absence of further fiscal stimulus, growth should then moderate again, resulting in year-over-year growth of roughly 2.0% by the fourth quarter.
On jobs, the June employment report, released last Thursday, confirmed that the advance May report was an anomaly and that the true state of the labor market is one of tightness not strength. With just 57,000 jobs added in June and downward revisions to prior months, the three-month moving average of payroll job growth is now 111,000, well down from the 189,000 initially reported for last month. Meanwhile, as a reported 720,000 decline in the labor force reduced the labor-force participation rate to a 50-year low (excluding a few months during the pandemic), the unemployment rate fell to 4.2% - its lowest level in the past 12 months. This tallies with many other labor market indicators suggesting a shortage of available workers due to baby-boom retirements and a sharp reduction in immigration.
We expect this labor supply constraint, combined with only moderate GDP growth to result in monthly payroll gains of just 50,000 to 75,000 through the end of the year. However, even this anemic pace of job growth should yield a continued decline in the unemployment rate to roughly 4.0% by December and lower in early 2027. Meanwhile, wage growth remains subdued with a year-over-year increase in average hourly earnings of just 3.5% in June – likely lower than year-over-year CPI inflation for a third consecutive month.
On inflation, the June CPI report will be released on July 14th. We expect it to show a year-over-year increase in headline CPI of 3.8% - down from a peak of 4.2% in May. The biggest contributor to this decline will be a roughly 10% fall in gasoline prices between May and June. In addition, because gas prices fell throughout June and into July, lower energy costs should cut inflation for July also. This, along with moderate wage growth, diminishing shelter inflation and an effective decline in tariff rates, should allow CPI inflation to fall to a little over 3.0% year-over-year by December and, potentially, to below 2.0% in May of 2027 on the one-year anniversary of the 2026 inflation peak.
The Economy and Sentiment
These numbers generally paint a picture of economic moderation. As one illustration of this, we estimate that the so-called “misery index”, (that is the sum of the unemployment and year-over-year CPI inflation rates), was 8.03% in June. This would be better than it has been in more than 65% of months over the last 50 years.
Despite this, the Consumer Sentiment Index posted a final reading of 49.5 in June. Even after adjusting for a change in survey methods, this was weaker than in more than 98% of months in the 48½ years since the University of Michigan first began publishing monthly data for this series.
This anomaly is just one indication of a statistical break that has occurred in recent years in the relationship between economic variables and consumer sentiment. A statistical analysis run from January 1979 to March 2020 results in an equation that can explain over 71% of the variation in consumer sentiment based on the unemployment rate and recent changes in payroll jobs, consumer prices, stock prices and gas prices. The standard error for this equation is 6.9 index points, which means that, under certain assumptions, roughly two thirds of the actual observations fall within 6.9 index points of the numbers predicted by the equation.
However, when this equation is used to predict sentiment over the past six years, it misses badly and by generally increasing amounts so that, by June of 2026, while the equation estimated a consumer sentiment index of 88.2, or better than it has been 77% of the time over the past 50 years, the actual reading was almost 40 points lower, at 49.5 - worse than it has been 98% of the time over the same five decades.
This slide in sentiment relative to the fundamentals could, to some extent, reflect a recent amplification of a “K-shaped economy”, where the majority of respondents feel that they are falling behind even if the aggregate economic numbers look OK. It could also be a hangover from the pandemic that has left many feeling less socially anchored than in the past. Or it could be the result of insidious social media algorithms that feed their smart-phone captives an unrelenting stream of stories and images designed to make them scared and angry.
Sentiment and the Market
Whatever the cause, this plunge in sentiment does raise a question of whether it is still a useful contra-indicator for the stock market.
On page 32 of the Guide to the Markets we show consumer sentiment going back to 1970 and annotate 10 sentiment peaks and 9 sentiment troughs with the price-only returns on the S&P500 over the subsequent 12 months. Following the 10 sentiment peaks, the market gained a modest 4.8% while following the 9 sentiment troughs it gained an average of 24.1%. The logic is straightforward. When sentiment is low, investors are likely underestimating the possibility of better economic performance in the year ahead and thus pricing stocks too low, with the reverse happening when sentiment is high.
This analysis would suggest, that with sentiment at very low levels today, the stock market might be expected to post a better-than-average return over the next year.
But is this a legitimate conclusion if the reason for the drop in sentiment is primarily unexplained by economic variables?
To analyze this, we consider whether the sentiment effect on stock market returns is statistically significant, whether it is more powerful at sentiment extremes, and whether this effect is impacted by whether the sentiment extremes are explained by economic fundamentals or not.
On the first question, a statistical analysis of the stock market impact of sentiment over all the months from January 1978 to June 2025 shows that, with a better than 90% probability, lower-than-average sentiment does indeed predict higher-than-average stock market returns over the next 12 months, all other things being equal. However, the effect is modest. The average level for the sentiment index over this period was 78.0. Sentiment that was 10 index points lower than that would be expected to add 0.9% to returns over the following 12 months. A sentiment index reading of 49.5, which we saw last month, could have been expected to add 2.4% to returns over the following 12 months.
On the second question, it seems plausible that the sentiment effect would be stronger at extreme readings on sentiment. If we run the same analysis, but restrict it to just the highest 5% and lowest 5% of sentiment readings over the same period, the relationship is both more statistically significant and stronger. Restricting the analysis to just extreme sentiment readings suggests that last month’s sentiment reading of 49.5 could have been expected to add a hefty 7.8% to returns over the next 12 months.
Finally, we divide extreme sentiment readings into the part that is predicted by the equation and the part that is not. The results are interesting. While stock market returns are negatively correlated to both, the part of sentiment that is not explained by the equation is almost twice as powerful as the part that is.
This suggests that while investors still tend to get too pessimistic and optimistic at economic extremes, this is tempered by the impact of actual economic conditions on corporate performance. However, if sentiment plunges because of a surge in uncertainty or a particularly polarizing political environment, chances are the economic damage is a lot less than people fear and, when the uncertainty ebbs or politics become slightly less divisive, markets are better positioned to move higher.
Investment Implications
This is very relevant today, with sentiment at historically low levels. As we have already pointed out, much of the current weakness in sentiment is not explained by the state of the economy or factors that could undermine corporate performance. Low sentiment, precisely because it seems unjustifiable, suggests, all other things being equal, better returns in the year ahead.
However, the phrase “all other things being equal” needs to be underscored. The truth is that, while economic variables have, until recently, done a good job in explaining swings in sentiment, sentiment only explains a very small part in the variation in stock market returns.
Other factors, such as profit growth, valuations, interest rates, exchange rates, technological and marketing innovations and a potential host of changes in the political, tax and regulatory environment can all impact stock market returns. Moreover, in the fourth year of an AI-led bull market, many investors find themselves over-weight U.S. equities at a time when U.S. equity indices themselves are overly concentrated in a few mega-cap technology stocks.
All of this suggests that there are plenty of good reasons for investors to rebalance in a tax efficient manner. However, as has been the case historically, low sentiment points in the opposite direction, supporting the idea that today’s bull market could still have some room to run.