Portfolio Q&A: Income Fund
Flexibility is at the heart of our approach to fixed income markets.
Government bonds and other fixed income sectors have traditionally played an important role in portfolios for their ability to:
However, it has become increasingly challenging for investors to find income as interest rates have reached historical lows in some countries, and even fallen below zero in others.
In 2019, the US Federal Reserve cut rates three times for a combined 75 basis points. Other major central banks have stayed accommodative, with some making deeper cuts into negative territory and restarting bond purchase programmes. Today, over a quarter of the global aggregate bond market, in local currency terms, are negatively yielding.
Size of negative yielding debt market2
Yield can still be found, but may require an active approach to identify the best investing ideas. There are various types of bonds globally and they react differently to market changes such as interest rate movement and economic cycle. When managed properly, this could also mean added diversification1 in portfolios if alternative asset classes are included.
Market volatility and lower yields are expected to stay. It’s time to embrace the challenges, differentiate and invest where opportunities can be found via a diversified1 and flexible approach.
Impact of a 1% fall in interest rates3
Market volatility and price fluctuations persist amid heightened geopolitical risks, a slowing global economy and ongoing trade tensions. The Chicago Board Options Exchange (CBOE) Volatility Index, commonly known as the VIX or the “fear index”, measures market expectations of near-term volatility conveyed by S&P 500 Index (SPX) option prices.
The “fear index” has gone through a bumpy ride in the past two years, reaching two peaks in early 2018 and early 2019 before easing to about 13 as of end-October 2019. Yet, that was still about 20% higher than the level it began in 2018.
Changes in the VIX since 20184
US Treasuries, securitised debts and investment grade (IG) bonds generally have lower volatility and – more importantly – lower or even negative correlation to stocks. Allocating to fixed income can help build a resilient and diversified1 portfolio.
Yields and correlations of different fixed income sectors to equities5
1. Diversification does not guarantee investment return and does not eliminate the risk of loss.
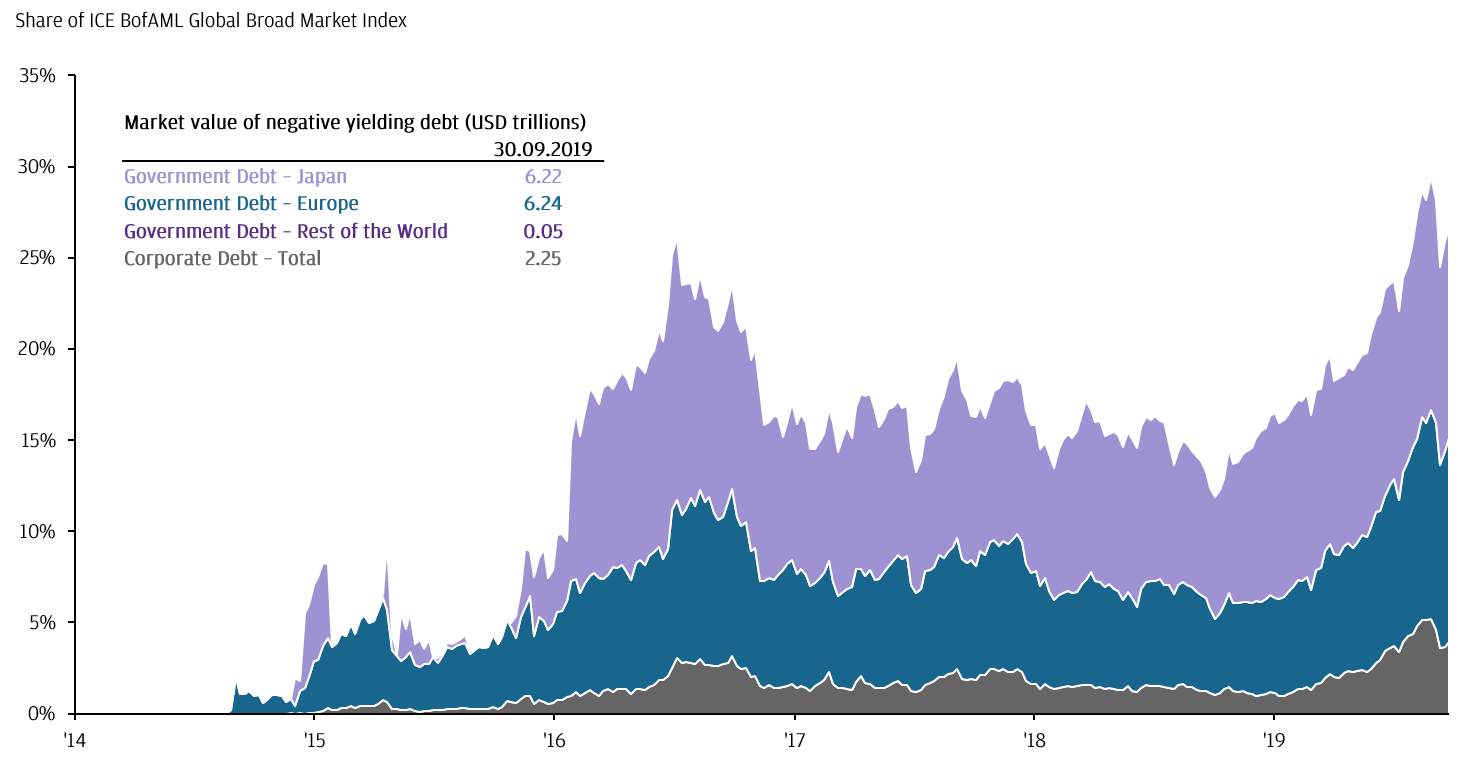
2. Source: Bloomberg, ICE BofA Merrill Lynch, J.P. Morgan Asset Management. Data reflect most recently available as of 30.09.2019.
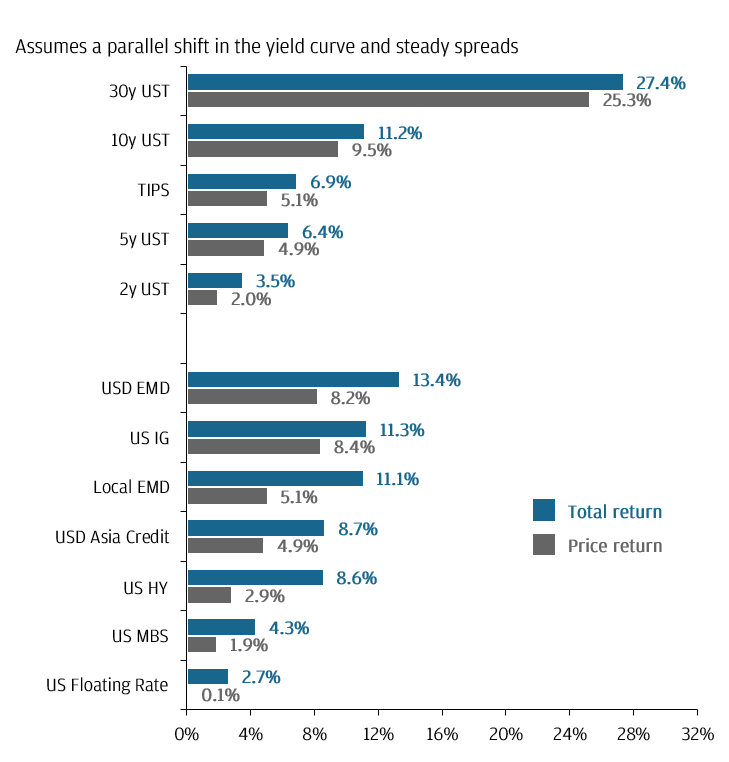
3. Source: Barclays, Bloomberg, FactSet, J.P. Morgan Economic Research, J.P. Morgan Asset Management. Based on Bloomberg Barclays US Treasury Bellwethers Index (2, 5, 10, 30y U.S. Treasuries), Bloomberg Barclays US Treasury Inflation-Protected Notes Index (TIPS), Bloomberg Barclays US Floating Rate Notes Index (US Floating Rate), Bloomberg Barclays US Aggregate Securitized – MBS Index (US MBS), Bloomberg Barclays US Aggregate Credit – Corporate – Investment Grade Index (US IG), Bloomberg Barclays US Aggregate Credit – Corporate – High Yield Index (US High Yield), J.P. Morgan Emerging Market Bond Index Global (EMBIG) (USD EMD), J.P. Morgan Asia Credit Index (USD Asia Credit), J.P. Morgan Government Bond Index – EM Global (GBI-EM) (Local EMD). Rising interest rates mean falling bond prices, while declining interest rates mean rising bond prices. Change in bond price is calculated using both duration and convexity, assuming a 1% fall in relevant local interest rate. Past performance is not a reliable indicator of current and future results. Data reflect most recently available as of 30.09.2019.
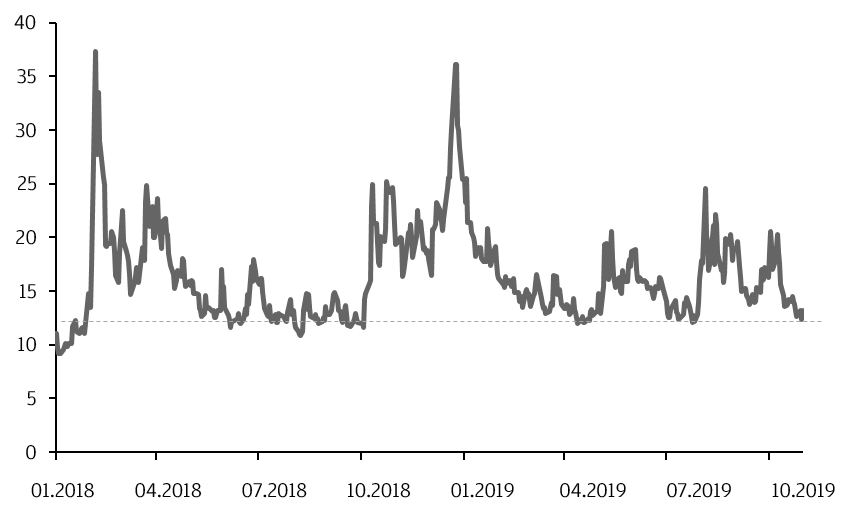
4. Source: FactSet, J.P. Morgan Asset Management. Past performance is not a reliable indicator of current and future results. Data reflect most recently available as of 31.10.2019.
5. Source: Barclays, Bloomberg, FactSet, ICE BofAMerrill Lynch, J.P. Morgan Economics Research, MSCI, J.P. Morgan Asset Management. Based on Bloomberg Barclays US Treasury (UST) Bellwether 2y & 10y (2y & 10y UST), Bloomberg Barclays US Aggregate, Credit – Investment Grade & High Yield (US Aggregate, IG & HY), Bloomberg Barclays US Securitised – Asset-Backed Securities (US ABS), Bloomberg Barclays US Securitised – Mortgage-Backed Securities (US MBS), Bloomberg Barclays US Securitised – CMBS – ERISA-Eligible Index (US CMBS), J.P. Morgan GBI-EM Global (Local EMD), J.P. Morgan EMBI Global (USD EMD), J.P. Morgan Asia Credit (JACI) (USD Asia Credit), J.P. Morgan Asia Credit (JACI) – High Yield (USD Asia HY), J.P. Morgan CEMBI (USD EM Corporates). *Correlations are based on 10-years of monthly returns. Data reflect most recently available as of 31.10.2019. Positive distribution yield does not imply positive return.
Capture the vast potential across Asian bonds
Invest in a global portfolio via high-rating bonds
Invest in our highest-conviction, income-generating ideas globally
# Source: J.P. Morgan Asset Management, USD (mth) class annualised yield as of end-April 2020. Positive distribution yield does not imply positive return. Dividend rate is not guaranteed. Annualised yield= [(1+distribution per unit/ex-dividend NAV)^distribution frequency]-1. The annualised dividend yield is calculated based on the monthly dividend distribution with dividend reinvested, and may be higher or lower than the actual dividend yield. Distributions may be paid out of capital which represents a return or withdrawal of part of the amount an investor originally invested or from any capital gains attributable to that original investment. Any payments of distributions by the Fund may result in an immediate decrease in the net asset value per share.
^ Source: J.P. Morgan Asset Management (USD (mth) class return as of end-April 2020, NAV to NAV in USD with income reinvested). Volatility based on monthly data. Past performance is not a reliable indicator of current and future results.
^^ Source: J.P. Morgan Asset Management (USD (san) class return as of end-April 2020, NAV to NAV in USD with income reinvested). Volatility based on monthly data. Past performance is not a reliable indicator of current and future results.
^^^ Source: J.P. Morgan Asset Management (USD (acc) class return as of end-April 2020, NAV to NAV in USD with income reinvested). Volatility based on monthly data. Past performance is not a reliable indicator of current and future results.
investment professionals6
investment locations
assets under management (AUM)7
Rich or cheap valuation on:
Multi-dimensional risk management is embedded at every stage of our investment process. Portfolio managers have ultimate responsibility for investment risk, with an embedded risk management function and an independent risk team providing additional layers of oversight.
Used to monitor volatility, correlation and duration
Allows us to test for “worst case” historical and customized scenarios
Ensures regular review of portfolio risk exposures
The portfolio risk management process includes an effort to monitor and manage risk, but does not imply low risk.