

Featured
Navigating through the trade policy fog
Discover how shifting tariffs and global supply chain dynamics are shaping U.S. trade policy, market impacts and business strategies in 2026.
What does the current midterm election landscape look like?
How could redistricting impact the election outcome?
How might policy shift after the midterms?
How do Americans view Artificial Intelligence?
How should investors approach investing in an election year?
How do markets perform in midterm election years?
What configuration of government typically performs best?
Currently, Republicans have a unified government – control of the White House and both chambers of Congress. However, their majority is slim, which means either they maintain narrow control, or cede one or both chambers of Congress to the Democrats.
The Senate currently consists of 45 Democrats, 53 Republicans and 2 Independents that caucus with the Democrats. The Democrats would need to gain 4 additional seats to take control of the Senate. While their open seats in Michigan and New Hampshire are considered a toss-up, six potential pick-ups would be most likely in North Carolina, Maine, Ohio, Texas, Iowa and Alaska.
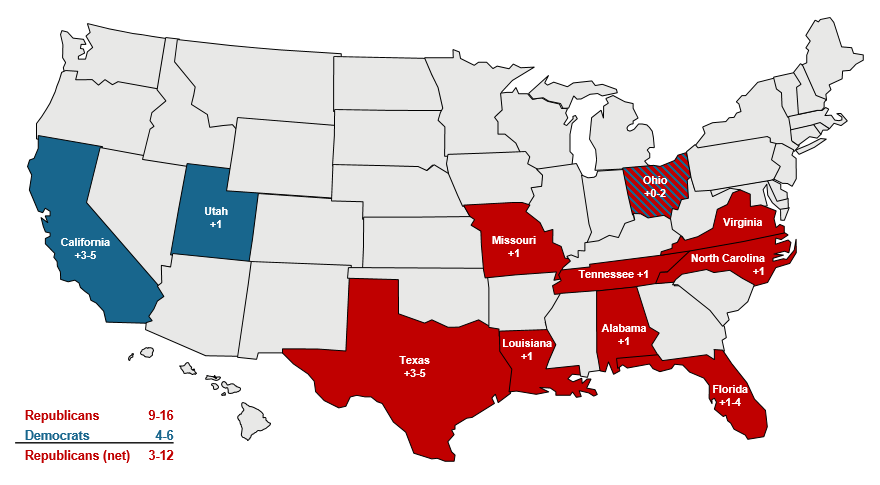
The House of Representatives currently consists of 219 Republicans, 214 Democrats, and 2 vacant seats (one formerly held by a Republican in Texas and one formerly held by a Democrat in Florida). The Democrats would need maintain their vacancies and win 3 additional seats to take control of the House. One additional complication is congressional redistricting, which could favor the Republicans in Florida, Texas, North Carolina, Tennessee and Missouri, but favor Democrats in California and Utah. In total, this could net the Republicans 5-10 seats. Still, the Democrats are marginally favored to win the House.
While individual races and candidates are of course key determinants, two other factors are at play. One, midterms are often considered a referendum on the president, and the president’s approval rating has slumped to its lowest of his term thus far. Two, campaign funding has been much stronger for Republicans than Democrats, which can move the needle in select races.

Source: 270towin, J.P. Morgan Asset Management. The Senate currently consists of 45 Democrats, 53 Republicans and 2 Independents that caucus with the Democrats. *Currently, the House of Representatives consists of 219 Republicans, 214 Democrats and 2 vacant seats (one formerly held by a Republican in Texas and one formerly held by a Democrat in Florida). “Current” includes vacant seats. Data are as of September 18, 2026.
After the U.S. Census Bureau releases its population survey every 10 years, each state redraws its congressional district lines to reflect changes in population. Because congressional representation in the House of Representatives is determined by these congressional districts, parties may attempt to draw the maps to favor their party.
This cycle, redistricting has been particularly active following the Supreme Court reversing prior rulings that protected the collective voting power of racial minorities in congressional maps under the 1965 Voting Rights Act.
Thus far, redistricting could yield solid flips in favor of the Republicans in Texas, Missouri, Louisiana, Alabama, and Tennessee to the tune of about 4 seats. New maps are also likely to favor Republican candidates in North Carolina and Florida for another 5 seats; however, those races could be much closer and redistricting doesn’t guarantee Republican victories in those seats. On the other hand, Democrats could net 3-5 seats in California and 1 in Utah. Democrats were also expected to potentially gain 4 seats in Virginia until the Supreme Court of Virginia struck down their map, potentially protecting some seats for Republicans. In Ohio, Republicans and Democrats struck a deal on district lines, which on balance may not clearly favor one party or another.
While redistricting is just one piece of the puzzle for some of these seats since many are competitive notwithstanding, redistricting as a whole is expected to net the Republicans 5-10 additional seats. Still, the Democrats had a decent chance of flipping 10-20 seats in the House in their favor, so while that margin narrows with redistricting, it should still be enough to surpass the 3 seats the Democrats need to flip in order to take control of the House.
The first two years of a president’s term are often a mad dash to check off as many campaign policy promises as possible. That is because often presidents have a unified government (control of Congress) after a general election, but Congressional control can often diminish or flip after the midterms, making it more difficult to achieve agenda items.
Below is an outlook for key policy items under continued Republican control vs. a divided Congress:
Affordability and homeownership are among the key existential concerns Americans are grappling with, but recently a new one has entered the fray: artificial intelligence. From the data center- buildout to the threat to jobs, opinions on AI are evolving. In fact, in 2022, 38% of Americans were more concerned than excited about AI. That jumped to 50% in 2025.
As massive capex pours into data center construction, 71% of Americans oppose local construction of data centers in their area, according to Gallup. Interestingly, the reasons cited were environmental and quality-of-life related, with only one-fifth of respondents mentioning cost implications such as higher utilities. This contrasts with the 77% of respondents in a recent Reuters/Ipsos poll that are concerned about AI making electricity costs higher.
Anxieties grow as the buildout translates to greater AI proliferation, and productivity gains threaten jobs. About 64% of U.S. adults think AI will result in fewer jobs.
Still, despite 71% of Americans thinking AI will make their personal information less secure, 43% of U.S. adults say it is important for the U.S. to be the world’s leader in developing AI. This highlights the tensions between the risks and opportunities artificial intelligence presents at a national level, which is why balanced regulation becomes a key consideration.
Thus far, the approach has been “innovate first, regulate later” with much of the regulatory activity happening at the state and local level rather than federally. Republicans’ approach has been light regulation with a focus on global competitiveness and national security, while Democrats have focused on consumer safeguards, labor protection, privacy and misinformation.
Despite early efforts, U.S. lawmakers have a long way to go on regulation – not only when it comes to establishing a framework but also garnering public support. Ipsos conducted a poll last year across 31 countries, and the U.S. scored the lowest with just 31% of respondents trusting their own government to regulate AI responsibly.

Political opinions are best expressed at the polls, not in a portfolio. One cardinal rule for investors: Don’t let how you feel about politics overrule how you think about investing.
The chart below shows a survey from the Pew Research Center asking Americans to rate economic conditions. The results show that Republicans often feel better about the economy under a Republican president, while similarly Democrats feel better about the economy under a Democratic president. Investors often make portfolio decisions based on their economic outlook.
Yet, average annual returns on the S&P 500 during the Obama administration of 16.3% and during the first Trump administration of 16.0% were almost identical and higher than the average return over the last 30 years of 10.3%. It is likely that the macro conditions, like ultra-low interest rates enjoyed during both Obama and Trump administrations, were a more influential driver of above-average returns during those periods, rather than the policy prescriptions each president espoused. Even as macro conditions have shifted, returns during the Biden administration and the second Trump administration have also easily exceeded long-term averages, owing to the strength of American companies, the aggregate health of the consumer and technological innovation.
Investors who did allow their political opinions to overrule their investing discipline may have missed out on above-average returns during political administrations they didn’t like.

Source: Pew Research Center, J.P. Morgan Asset Management. The survey was last conducted in February 2026. Pew Research Center asks the question: “Thinking about the nation’s economy, how would you rate economic conditions in this country today… as excellent, good, only fair or poor?” S&P 500 returns are average annualized total returns between presidential inauguration dates.
Guide to the Markets – U.S. Data are as of August 31, 2026.
Elections are often a source of anxiety for investors because they introduce a new element of uncertainty to markets, which can result in lower returns and higher volatility. Since 1937, returns in midterm years were 9.2% on average vs. 13.3% in non-midterm years. Realized volatility was also higher.
However, simple averages don’t tell the full story. Midterm years have also coincided with particularly choppy years in the markets that have been entirely unrelated to the elections themselves. For example, 2018 and 2022 were both midterm years in which the stock market suffered negative returns. However, the pressure on the equity market came from the Federal Reserve hiking interest rates. Another notable negative midterm year: 2002, as the market bottomed out due to the tech wreck.
Still, markets may encounter some bumps along the way in midterm years, but those wrinkles tend to be smoothed out very quickly in the run-up to the election and thereafter regardless of the result. In fact, average returns were slightly negative in each of the three quarters preceding a midterm but then jumped an average of 6.6% in the fourth quarter.
If that’s the case, why not reduce equity exposure before the election and ratchet it back up once the polls close? History shows that markets begin to rally just under a month before election day, making timing the market a difficult task, and one that is clearly unrelated to the election result itself.
S&P 500 total return, 1937-2025

Investors always want to know how markets perform under different government configurations. Since 1937, markets returned 16.3% under unified Republican control, but 9.4% under a Republican president with a divided Congress.
While simple to compute, these returns tell investors very little about why markets performed the way they did and how markets are likely to perform in the future. Monetary policy, fiscal policy, economic growth, labor markets, corporate profits and valuations are much better indicators of future returns. Fiscal policy is driven by the government of course, but if we get some form of divided government, policy making has historically been much more constrained.
The economic context, not the political context, tends to be much more relevant to understanding historical market environments and returns.
S&P 500 total return, 1937-2025, (#) = occurrences

Key Policy Slides


Navigating through the trade policy fog
Discover how shifting tariffs and global supply chain dynamics are shaping U.S. trade policy, market impacts and business strategies in 2026.

Latest Insights
The information presented is not intended to be making value judgments on the preferred outcome of any government decision or political election.