
Economic & Market Update: Using the Guide to the Markets to explain the investment environment
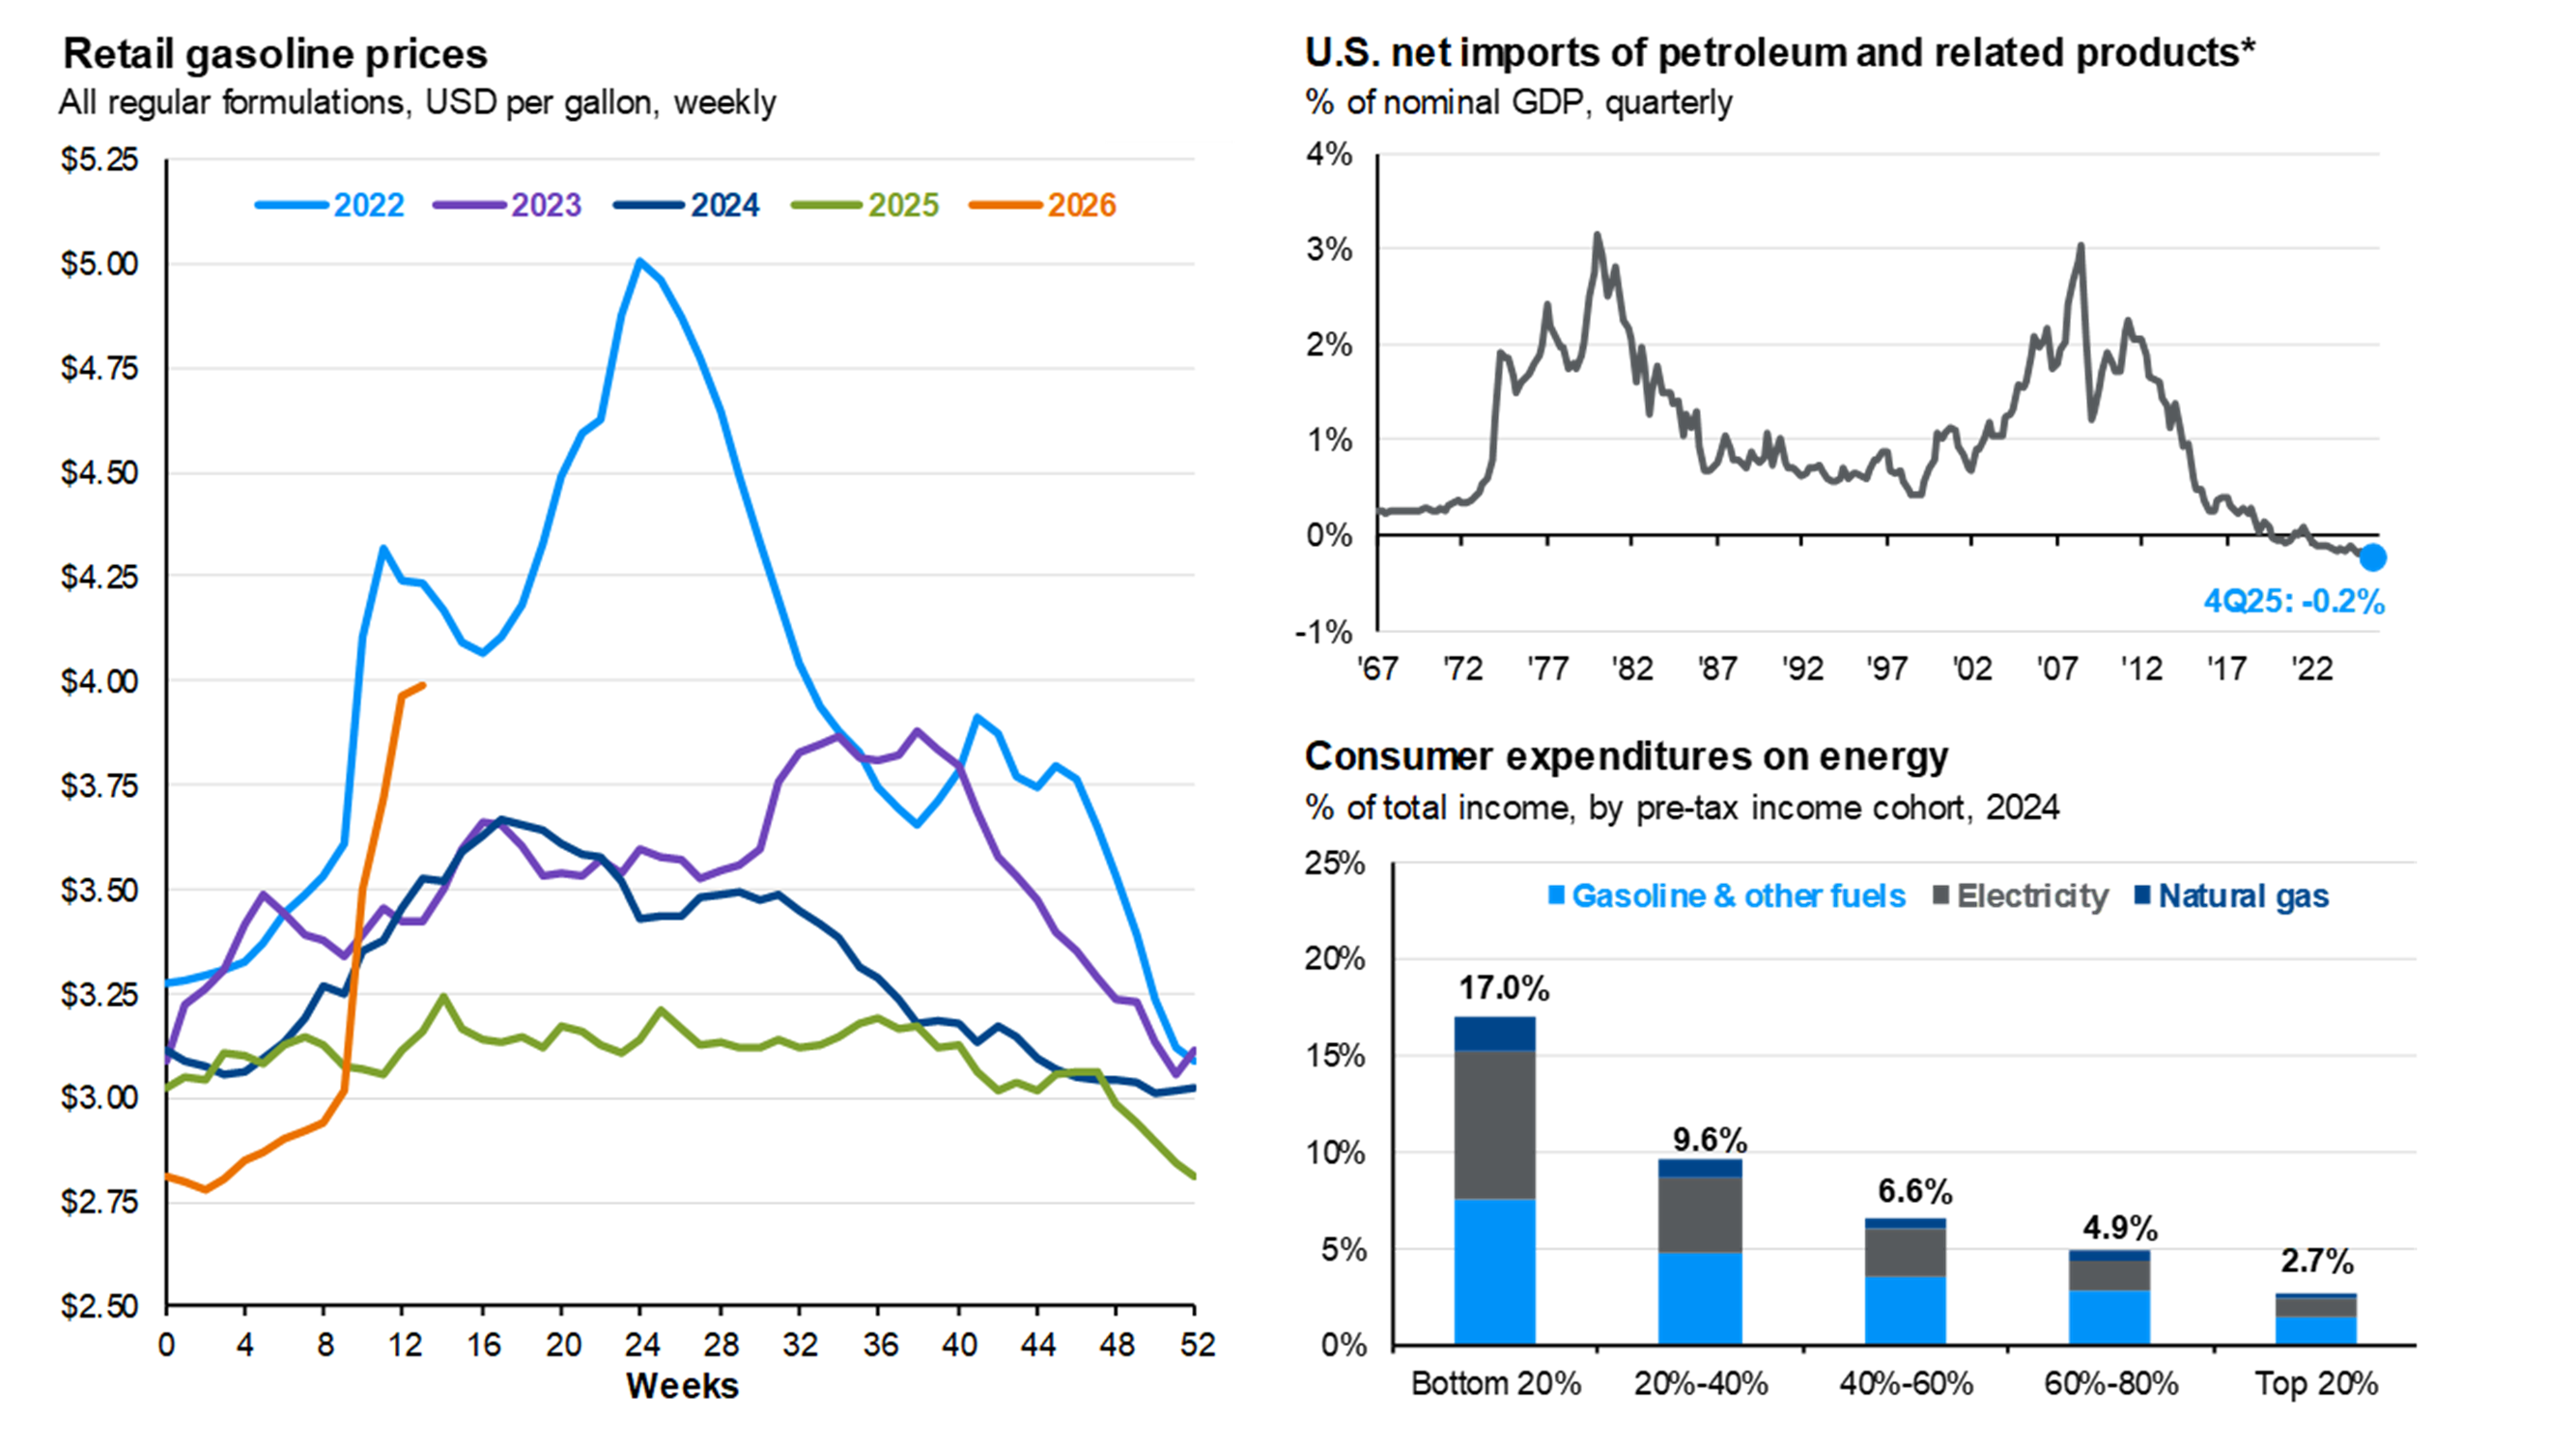
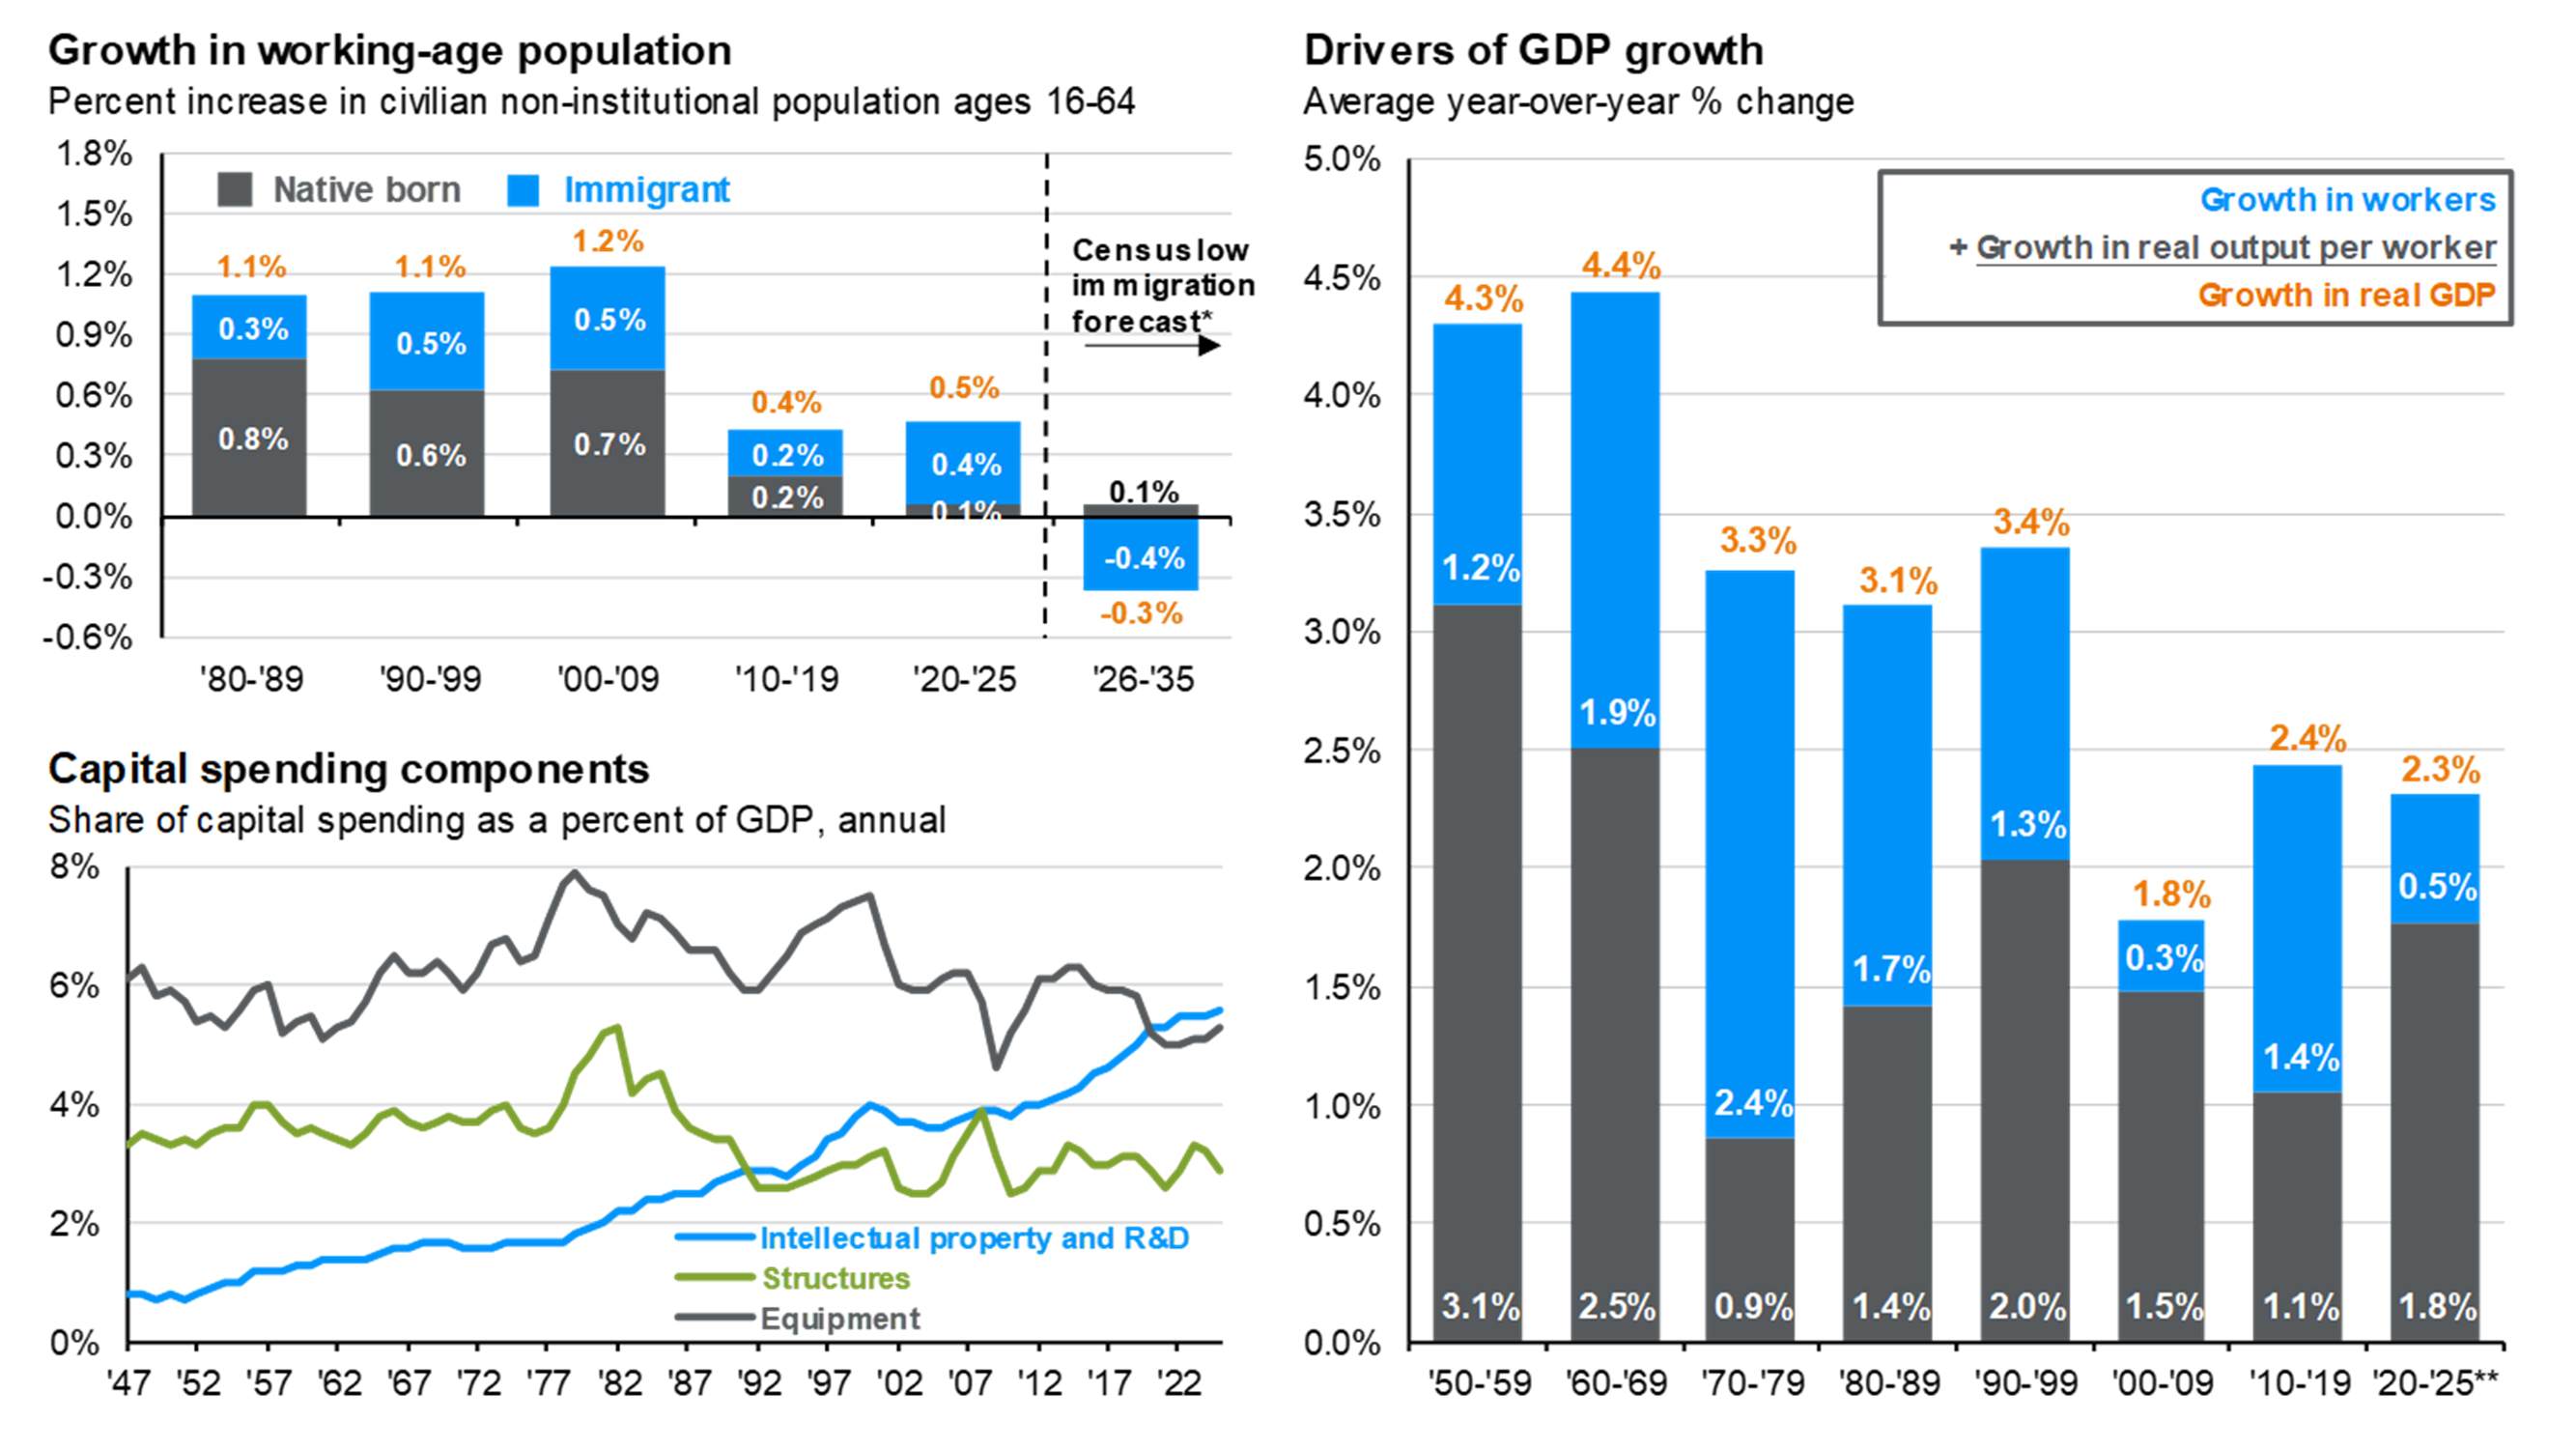
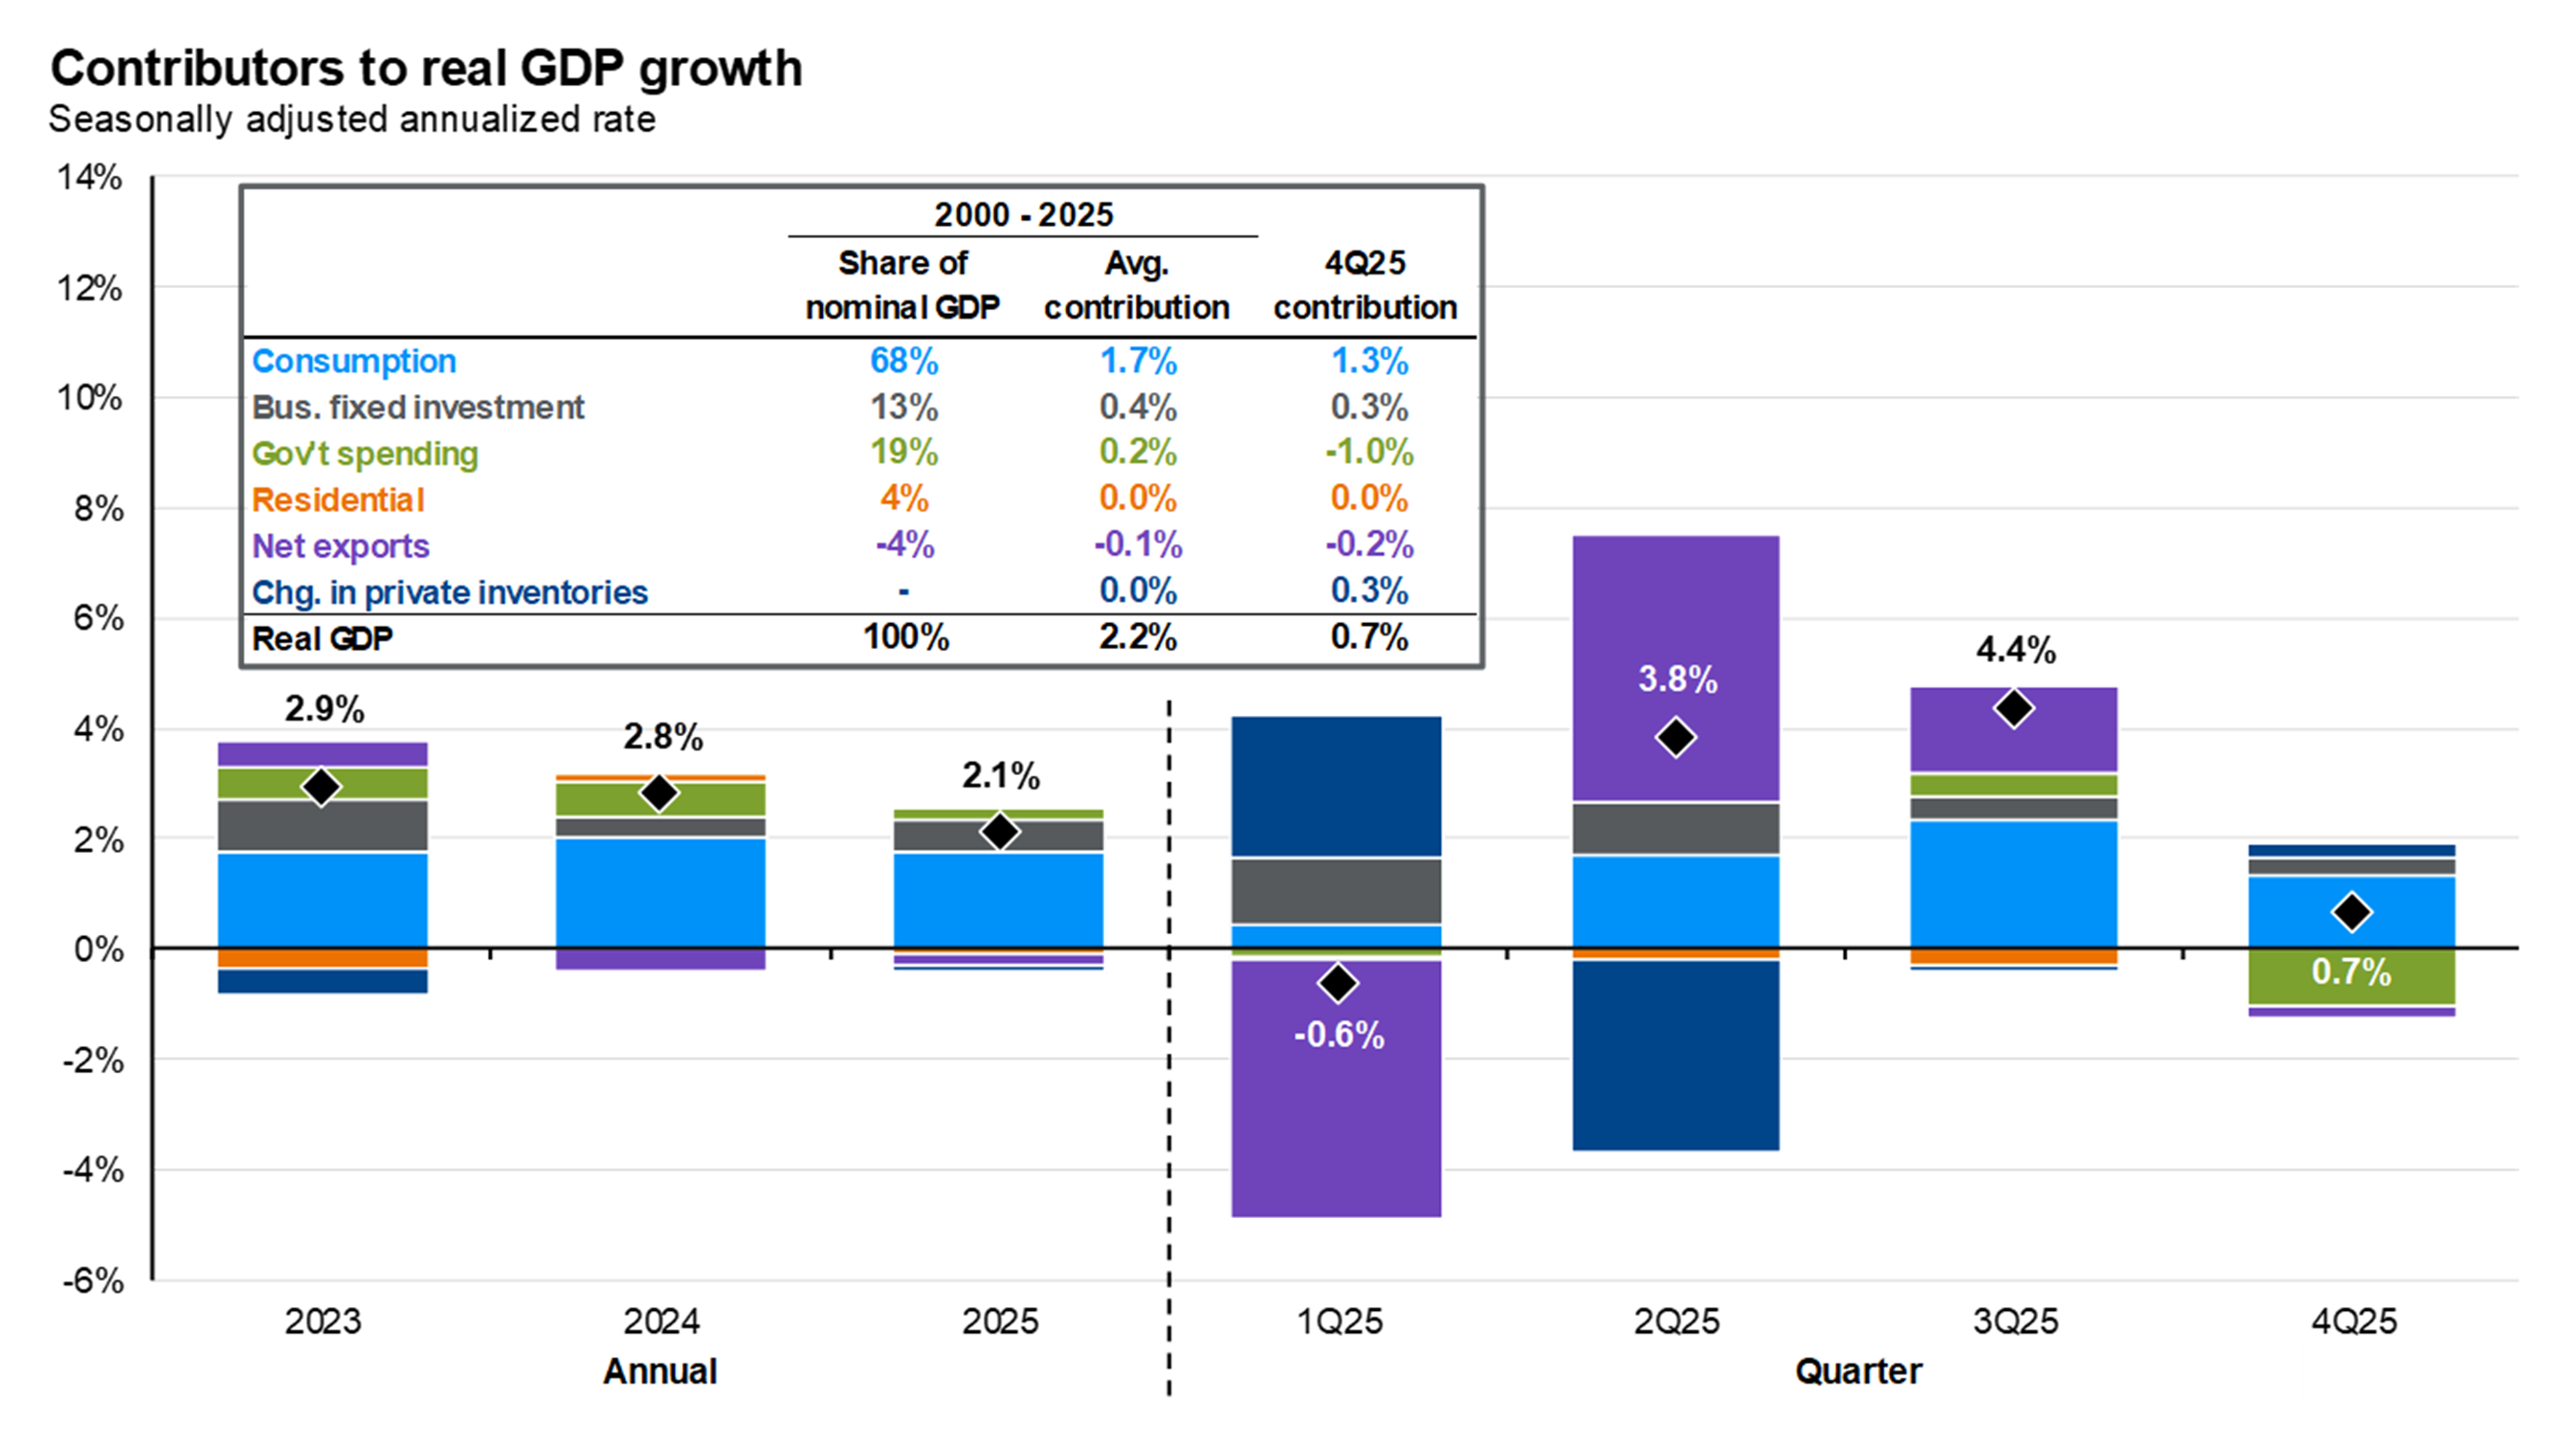
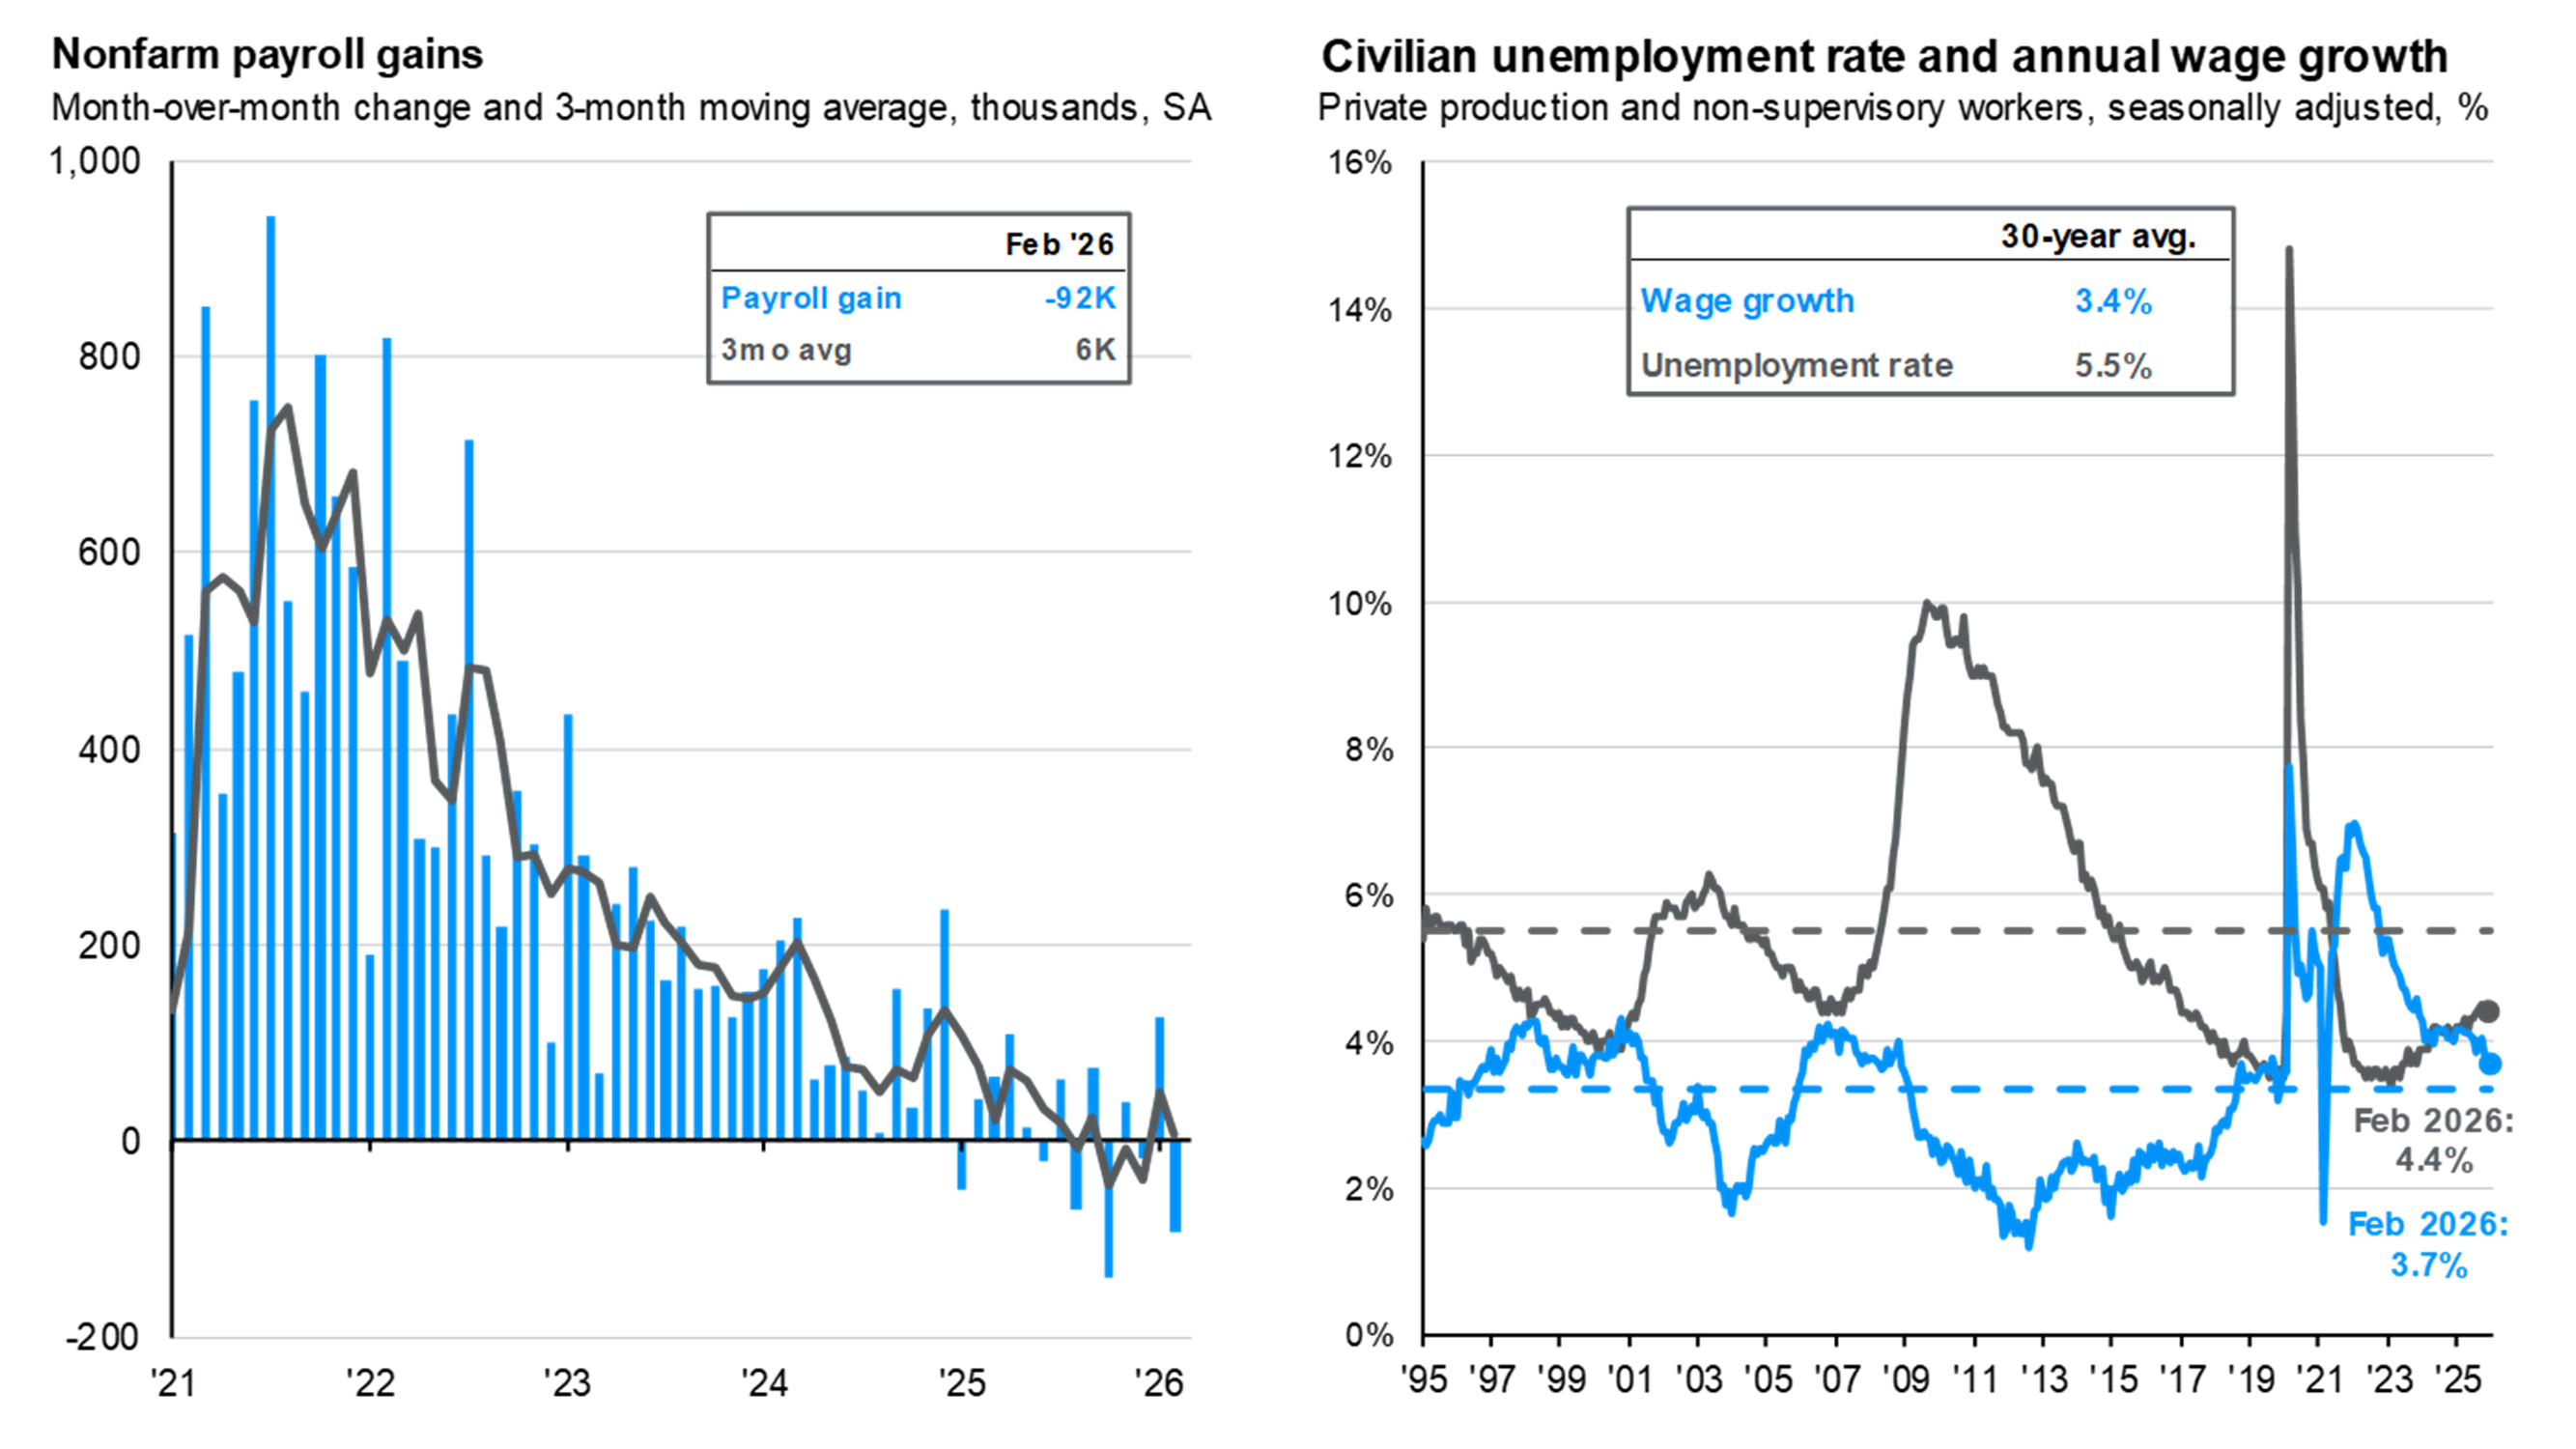
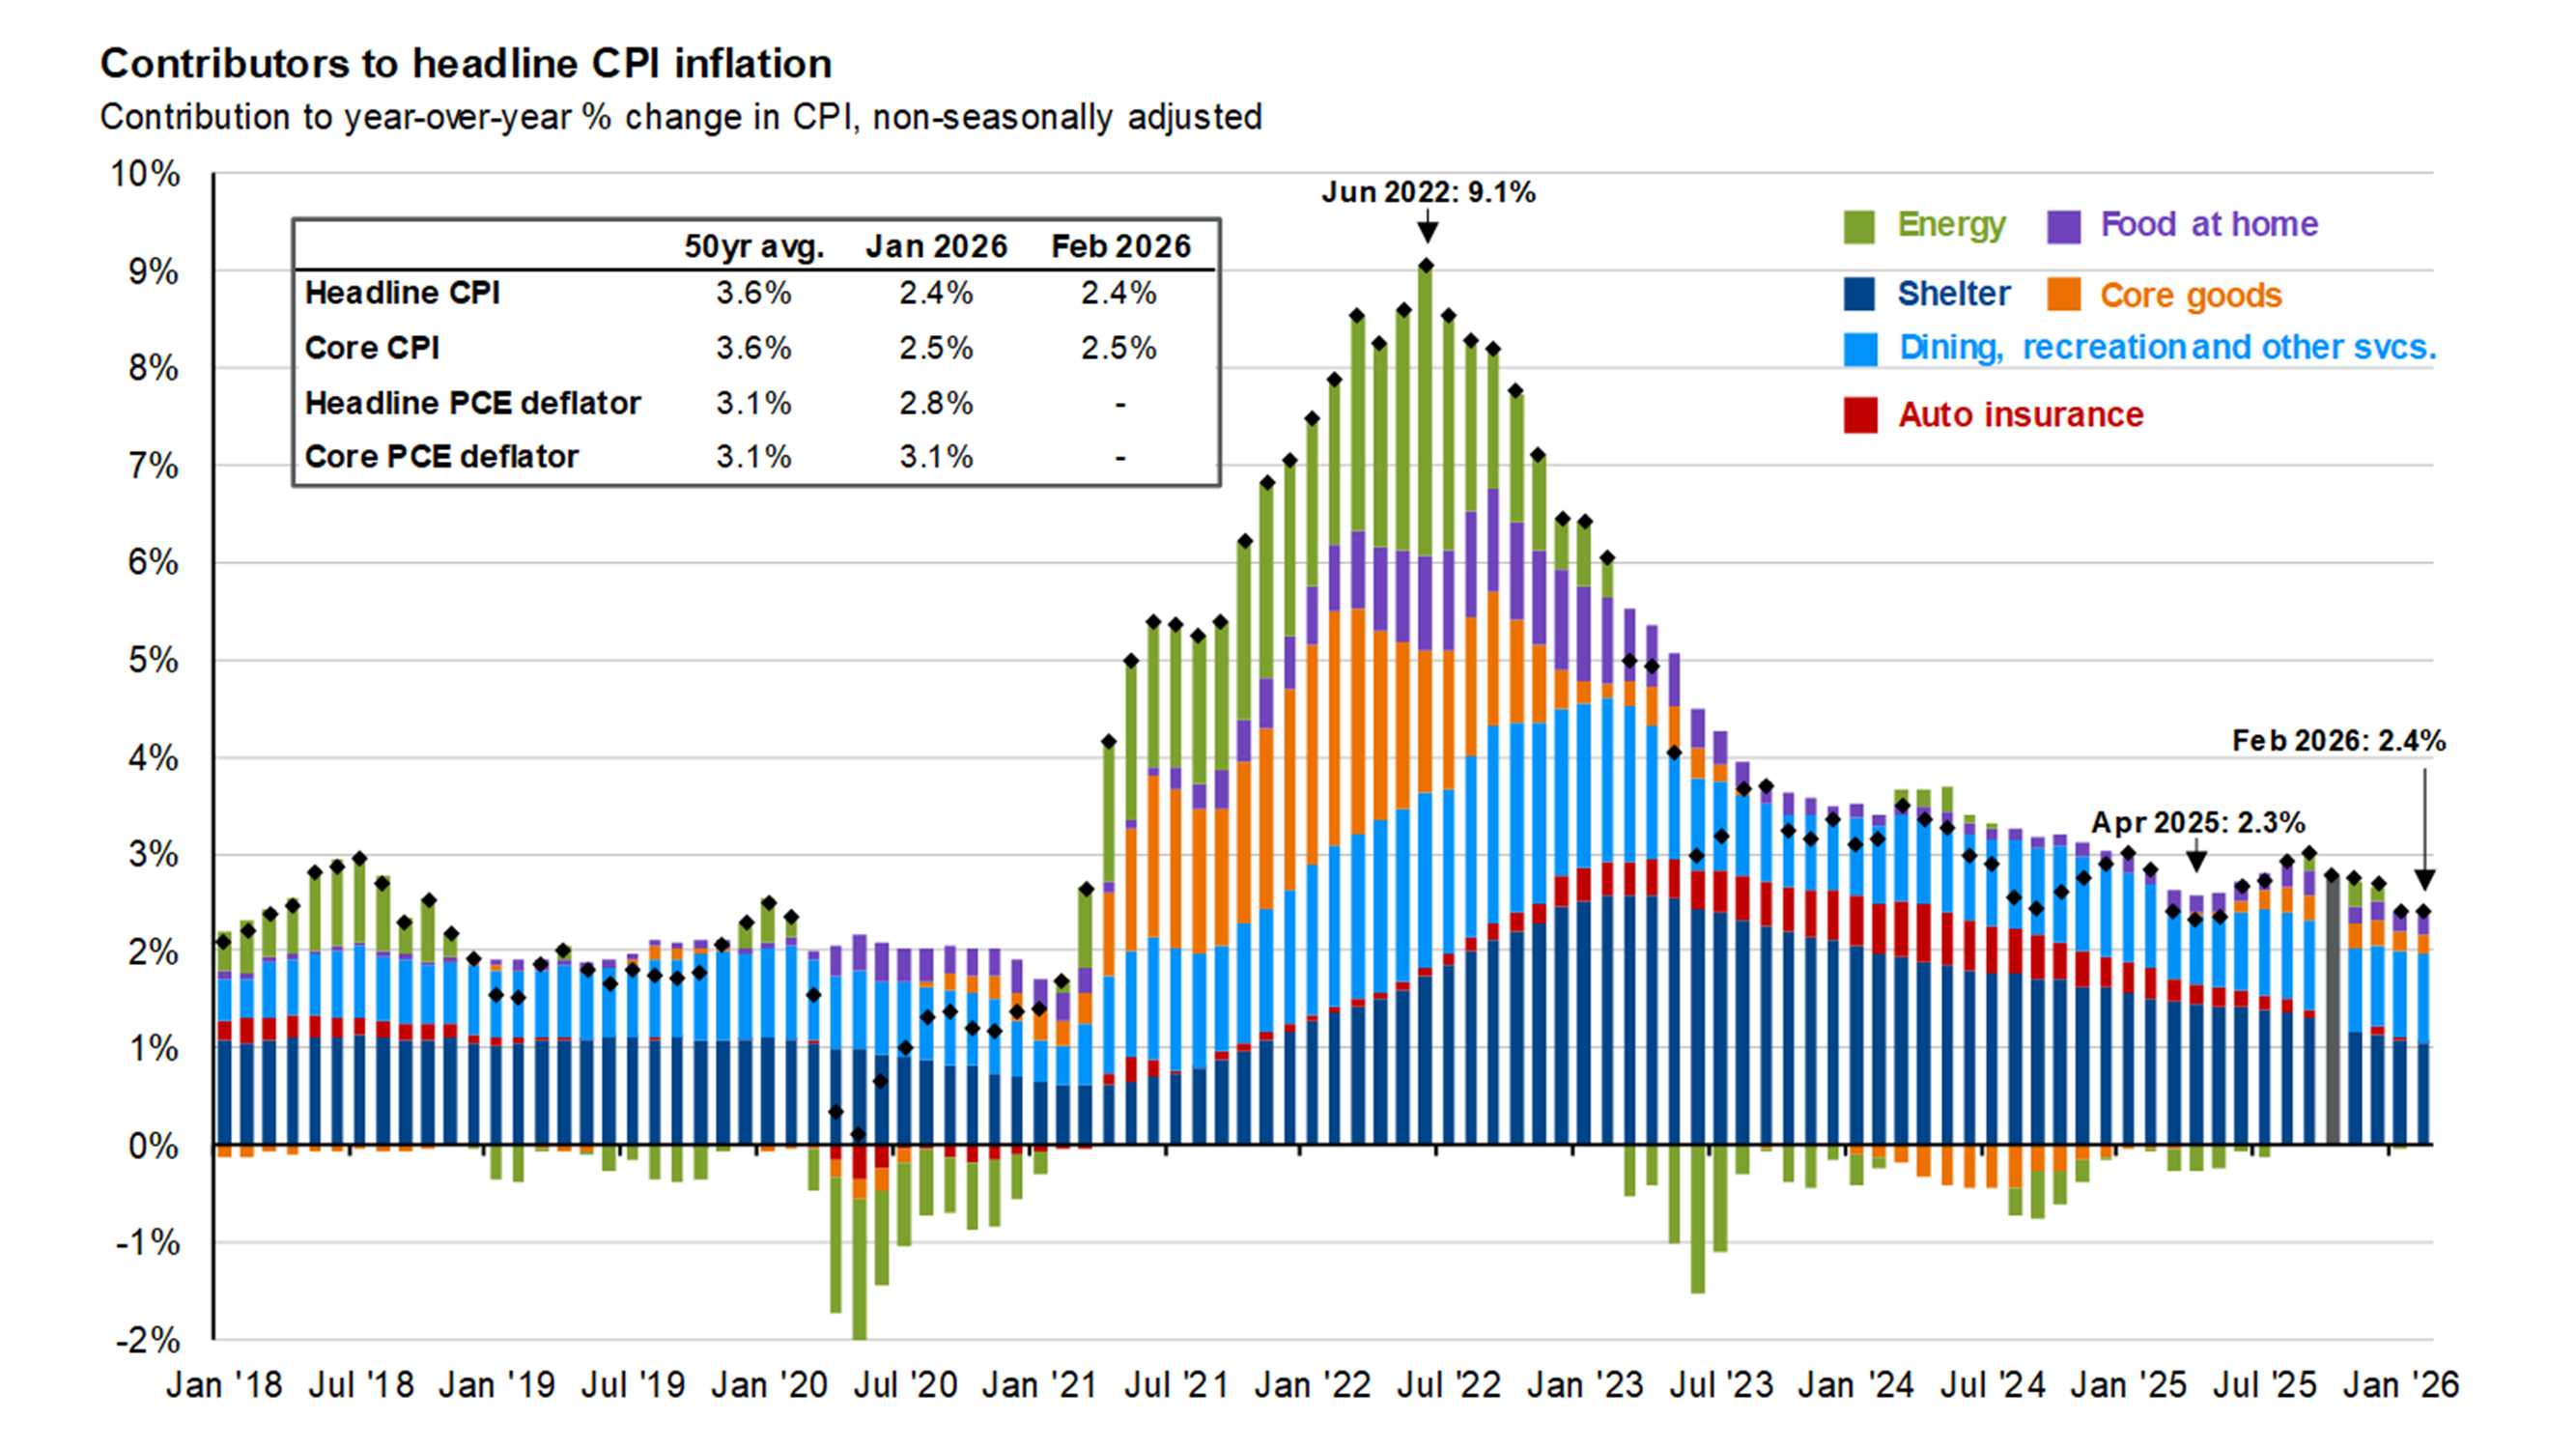
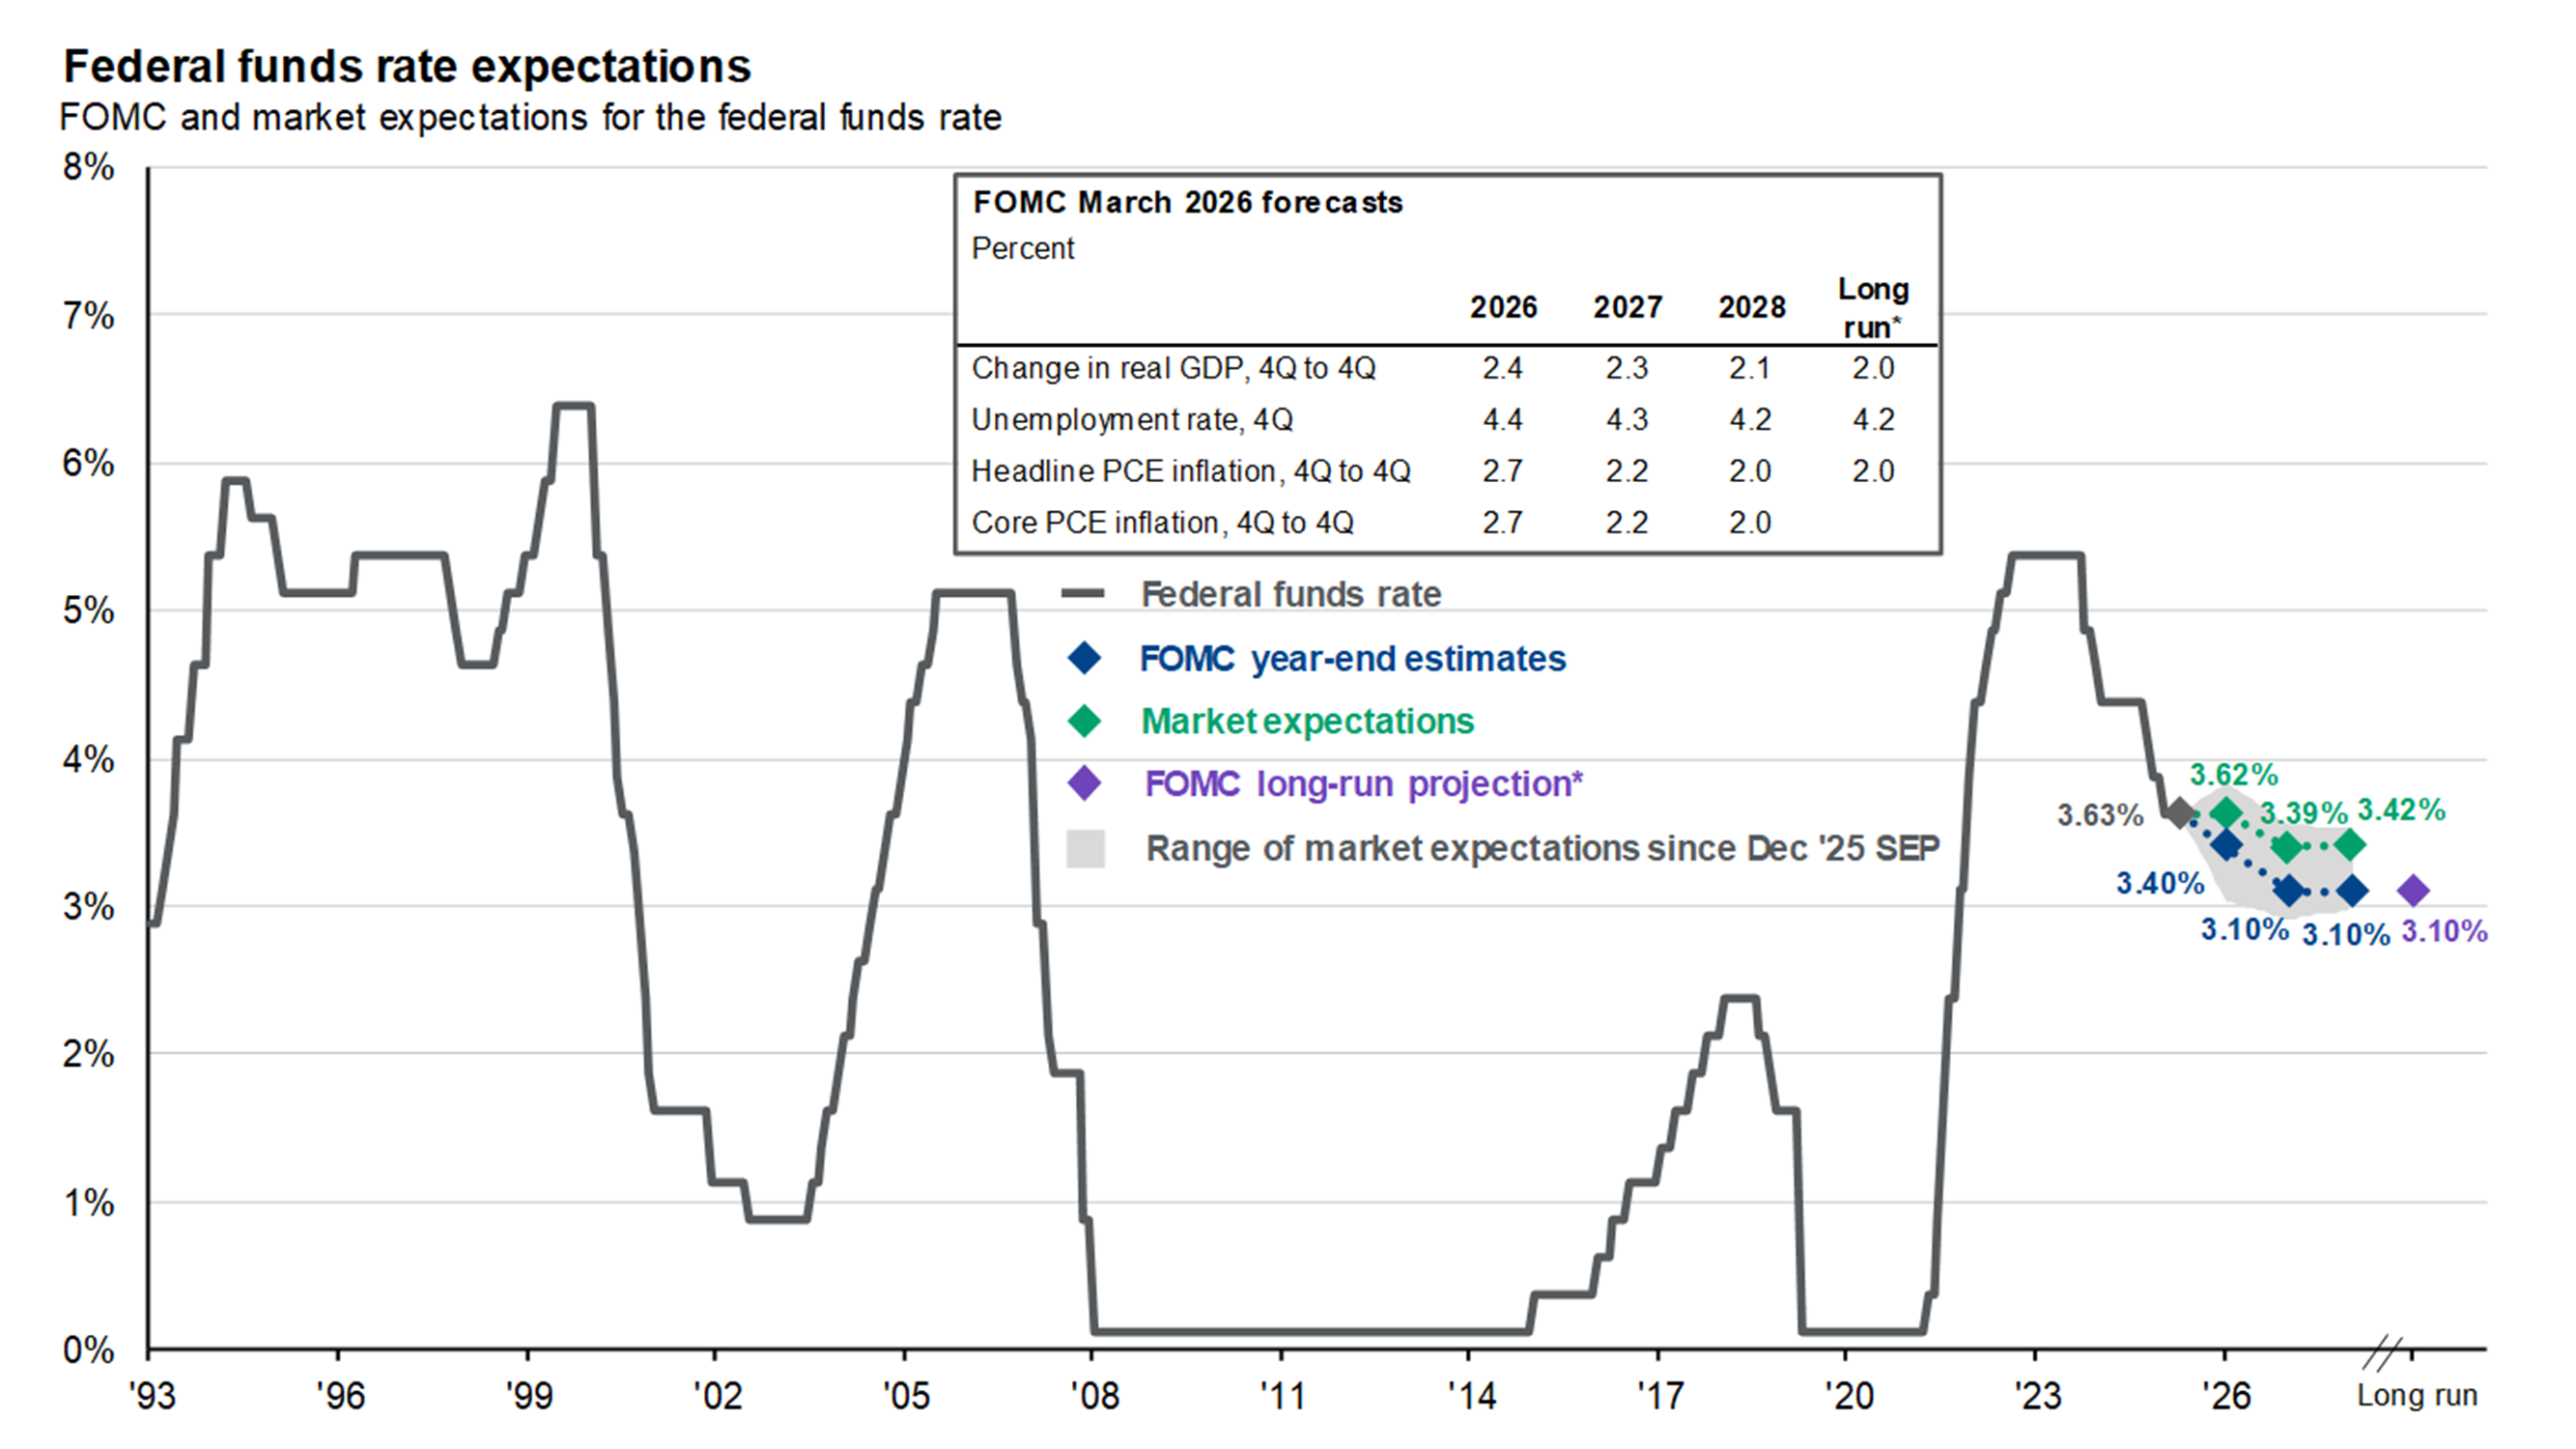
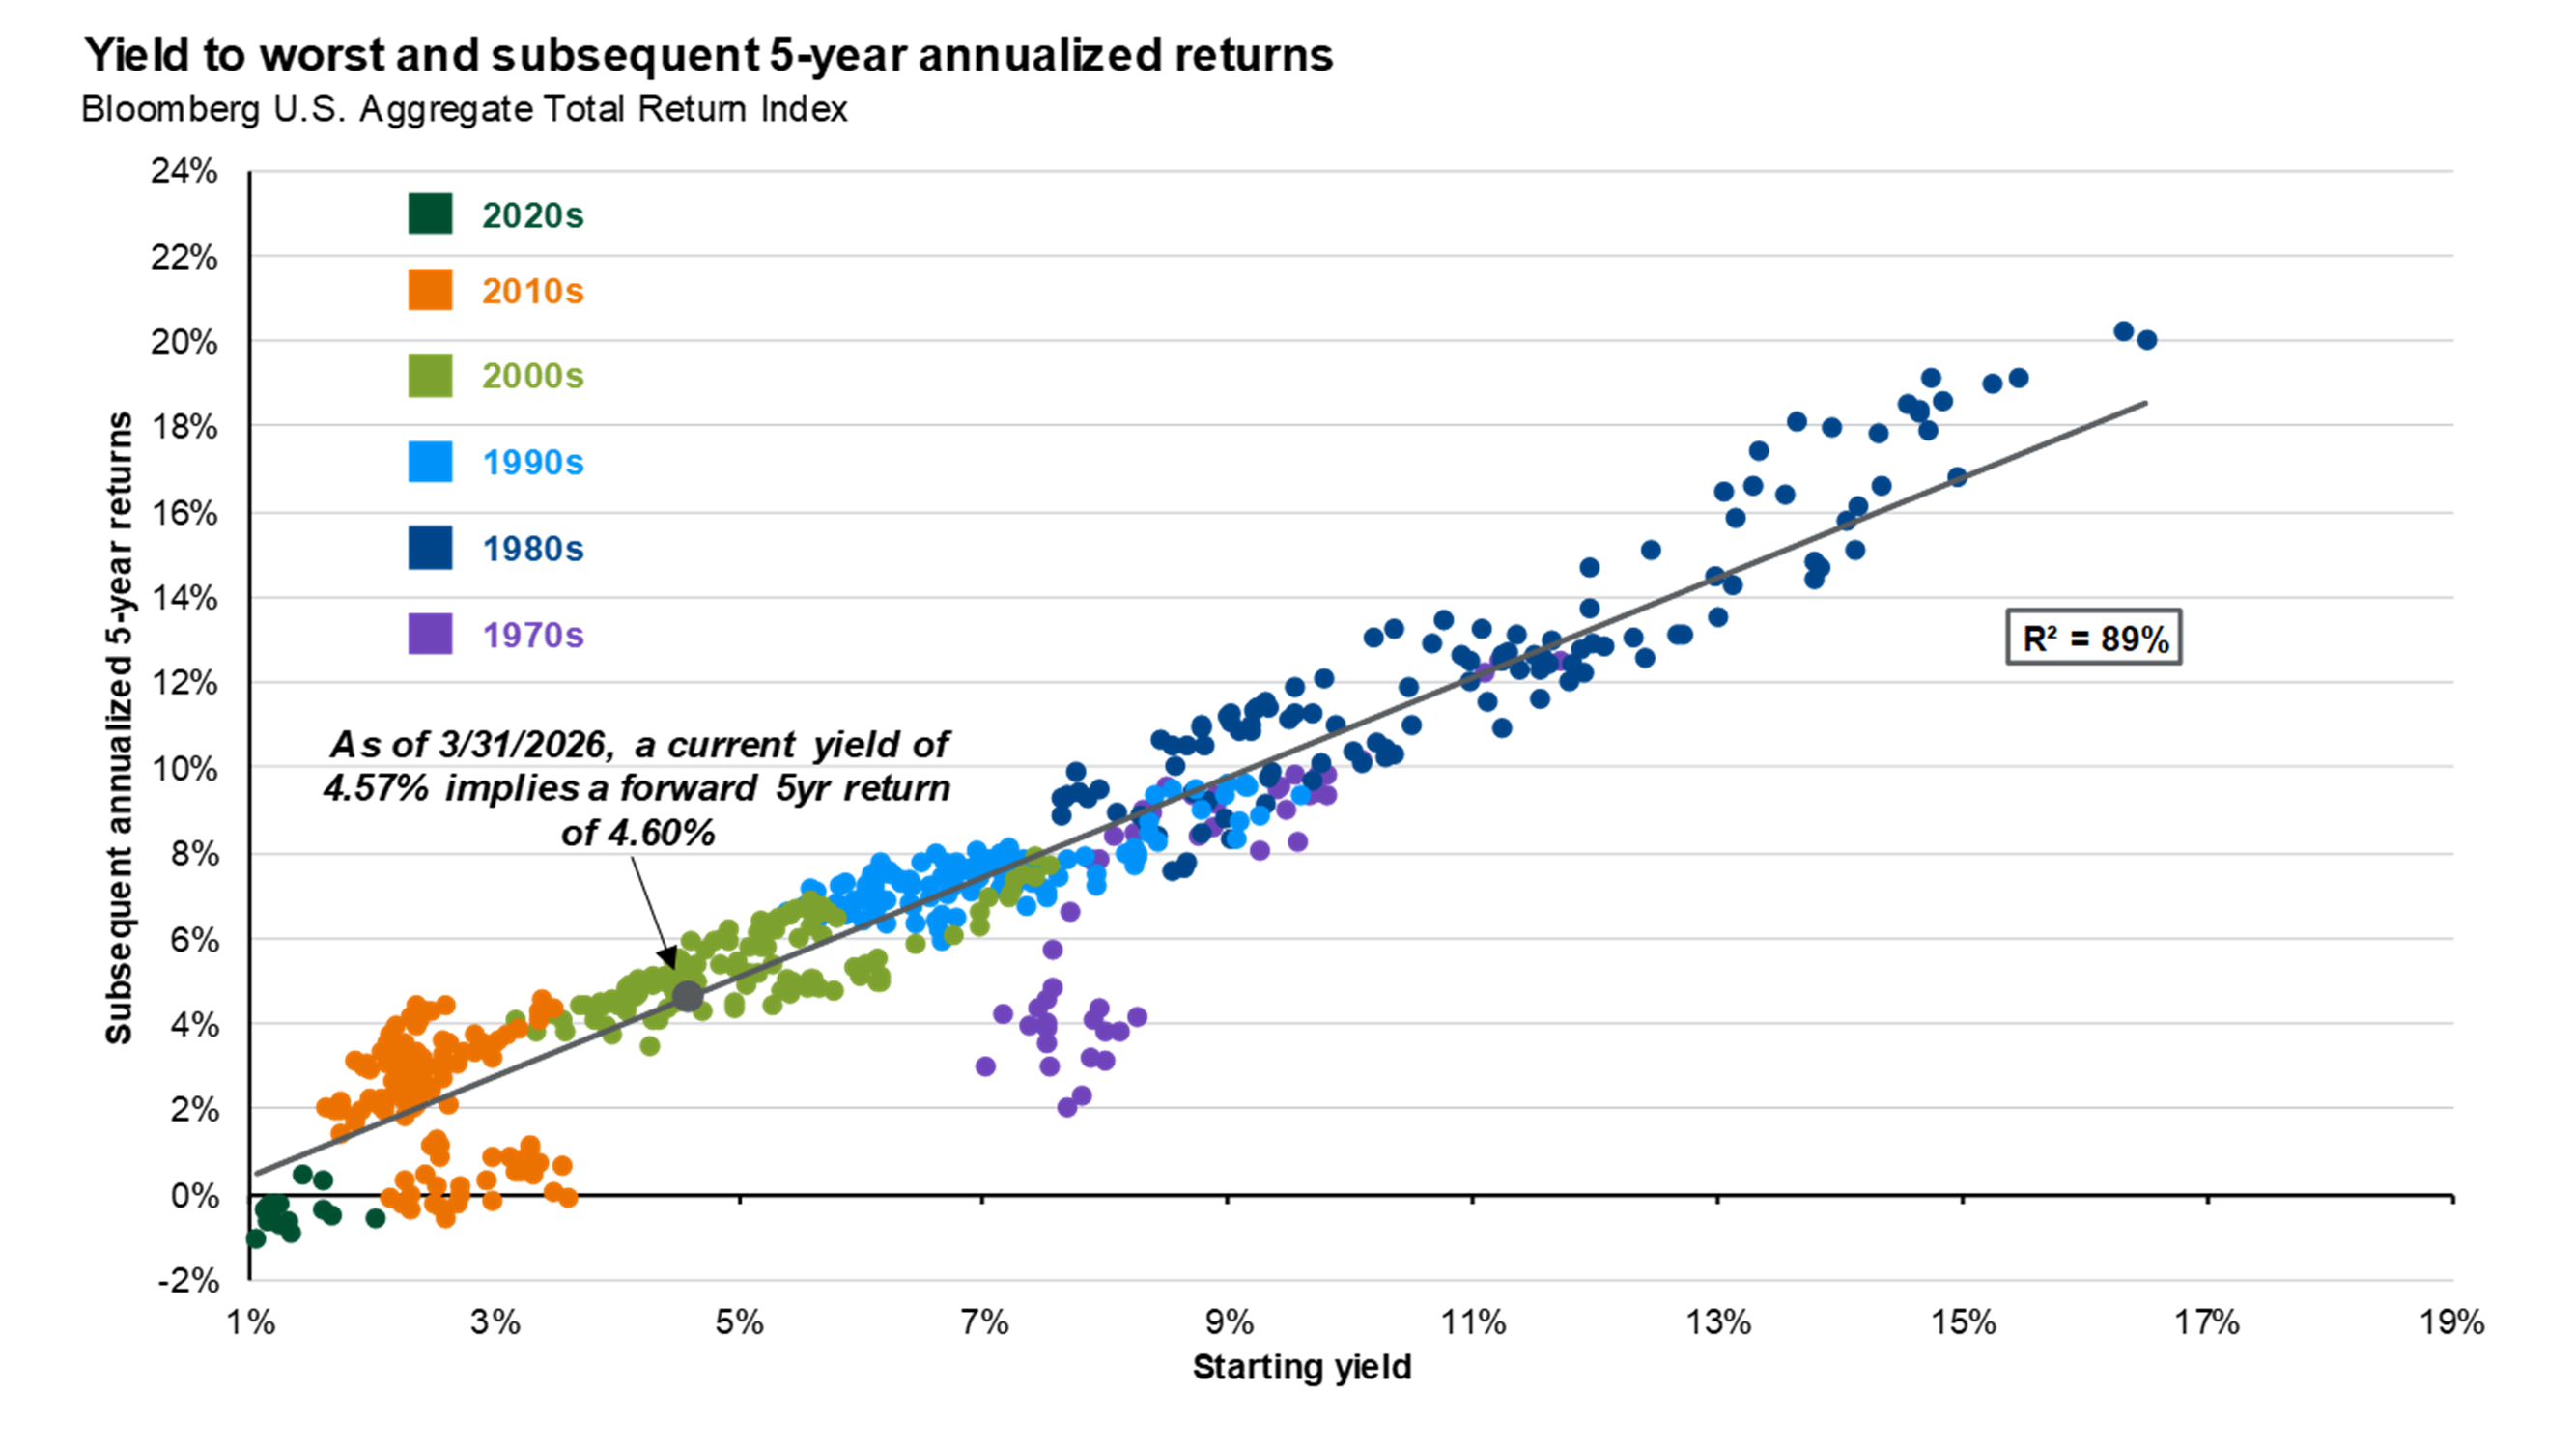
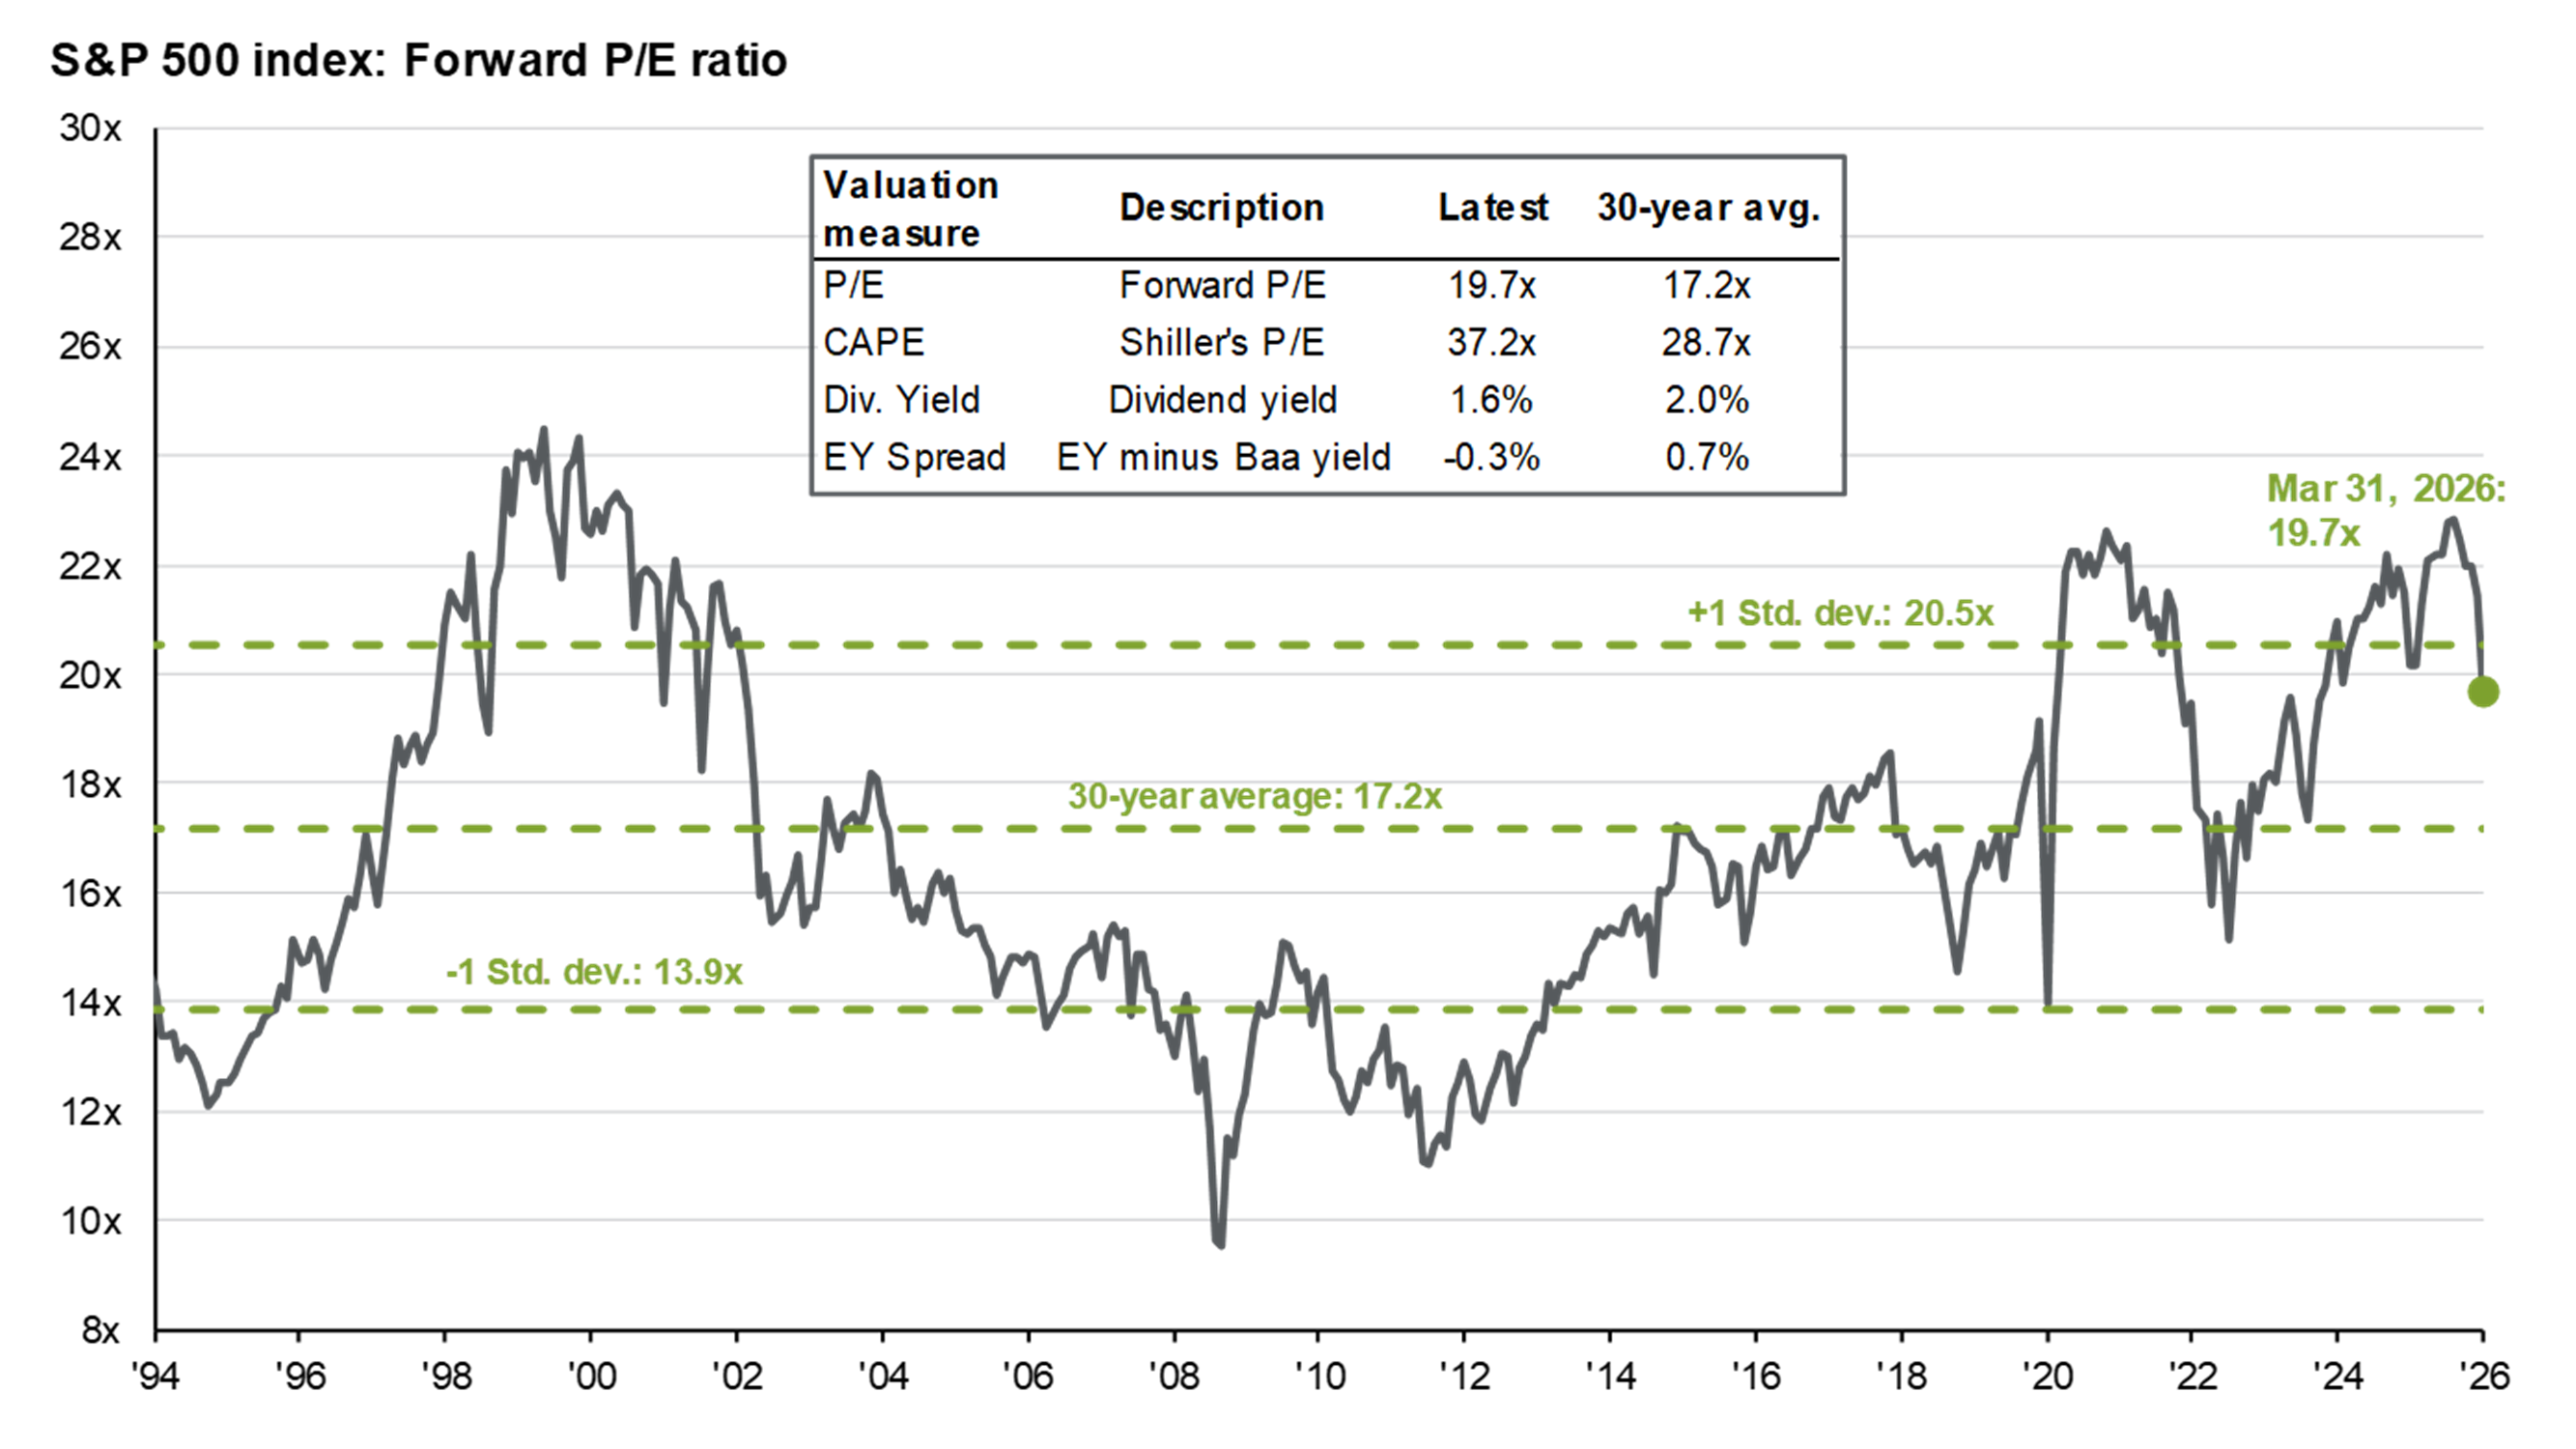
There are 65 pages in the Guide to the Markets. However, we believe that the key themes for the quarter can be highlighted by referencing just 10 slides.
Economic & Market Update: Using the Guide to the Markets to explain the investment environment