


On Thursday, the Bureau of Economic Analysis, commonly known as the BEA, will release revised data on the national income and product accounts going back to the start of 2019. This is an annual process, usually only mildly interesting to economists and ignored by everyone else. However, this year it’s more important since it could help clarify the trajectory of the economy at a critical time for both political and monetary policy choices. It’s also important because it could help resolve at least some of a yawning discrepancy between the estimates of output produced and income received in the American economy.
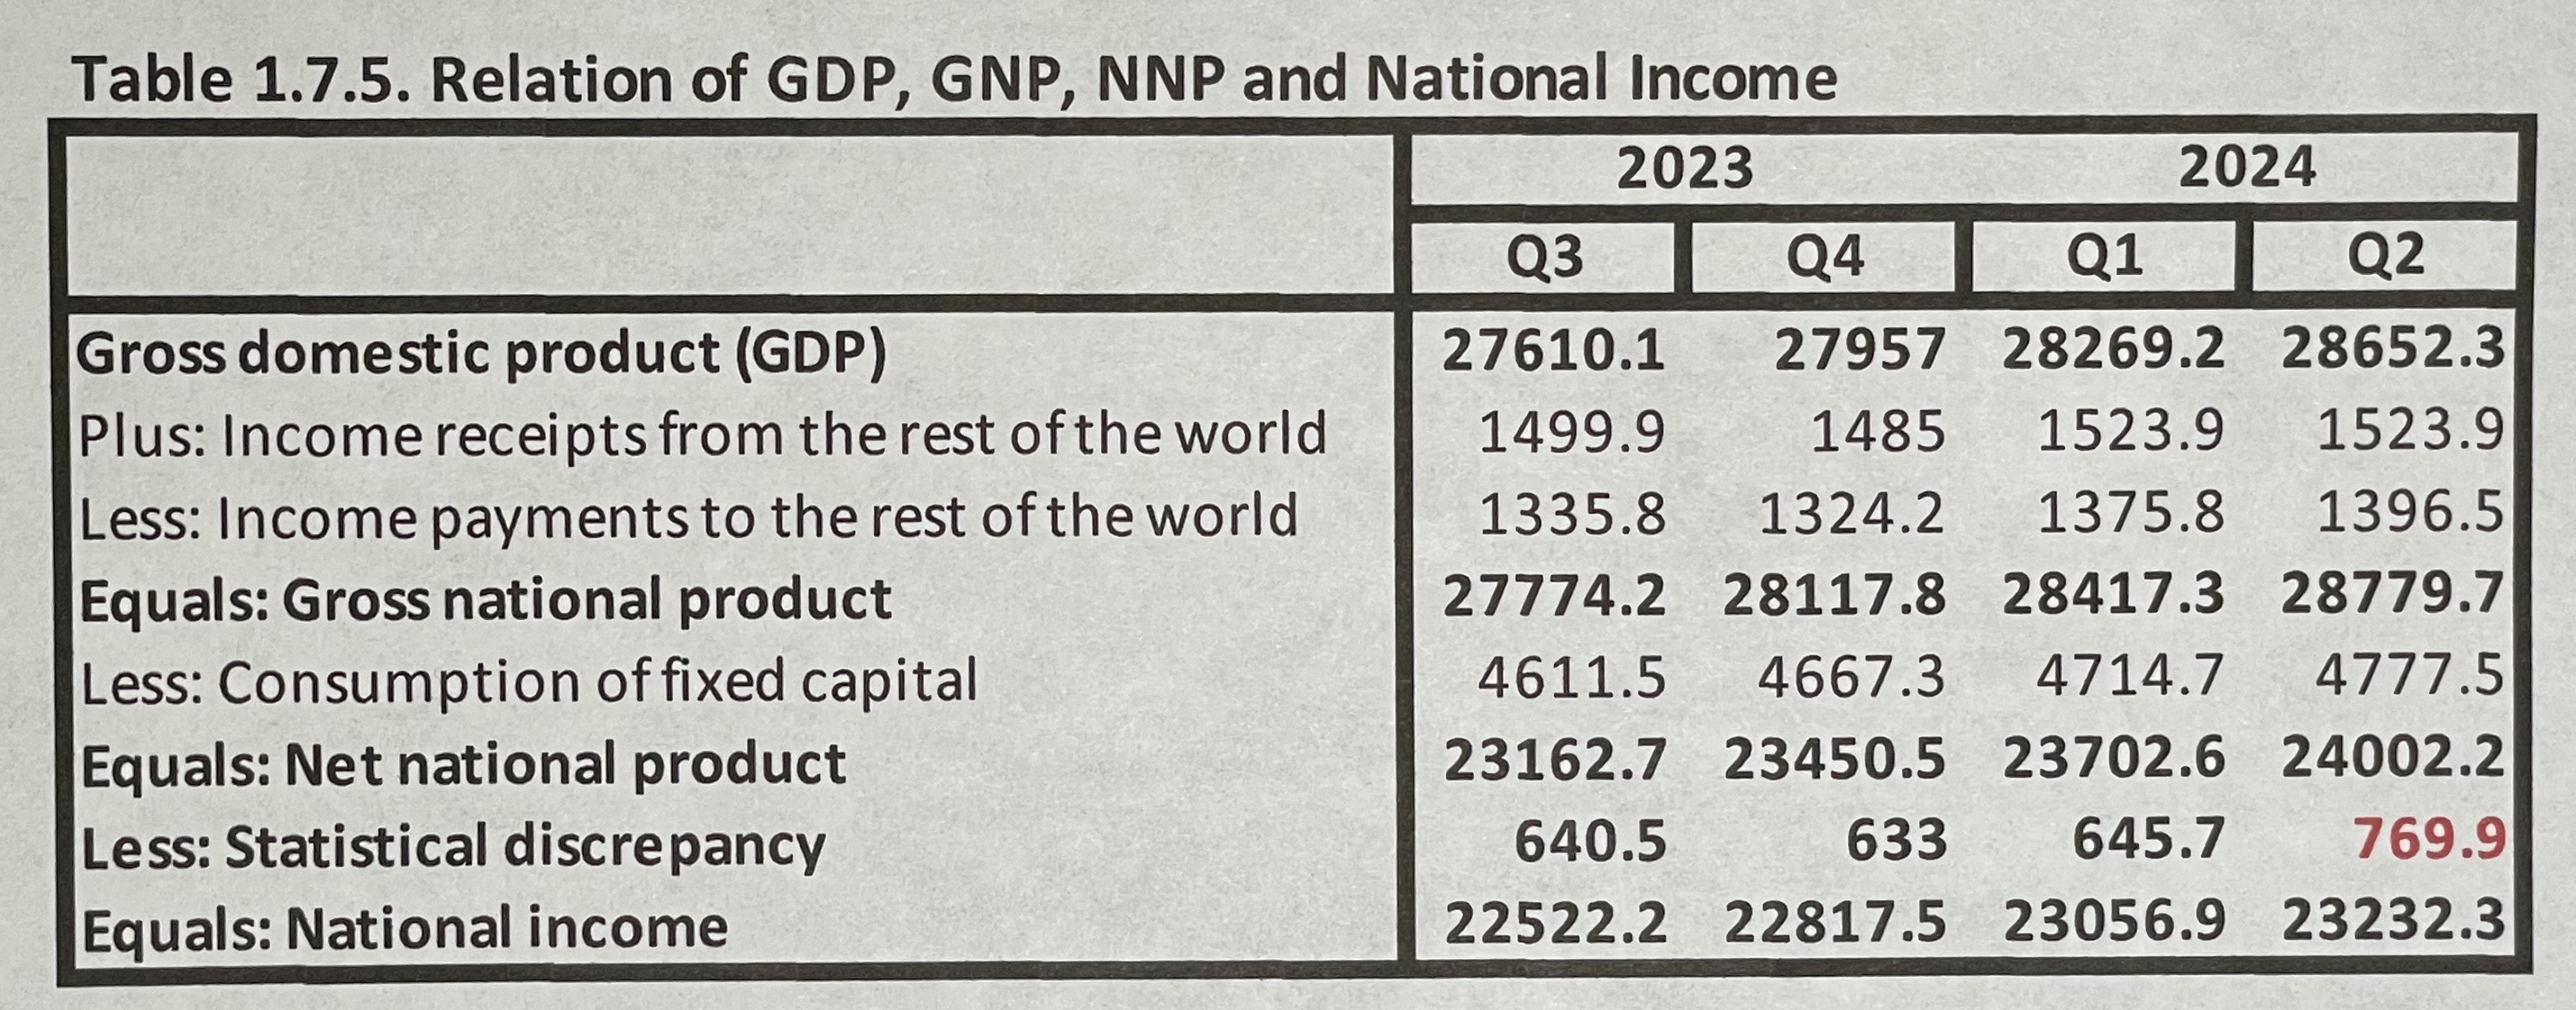
In theory, of course, there should be no such discrepancy. The total value of goods and services produced in the United States should be precisely equal to the total value of the income received by the producers of that output. In practice, however, government estimates of these totals have never been exactly equal and in the second quarter, the so-called “statistical discrepancy”, (that is the gap between net national product and national income), had widened out to a record $769.9 billion, or 2.7% of GDP. In other words, our measured income was 2.7% lower than our measured output.
This begs a number of questions. First, what’s causing this discrepancy? Second, will Thursday’s revisions either reduce or eliminate it? and third, regardless of whether it gets fixed or not, what does any adjustment to the discrepancy imply about the health of the consumer and business sectors, and the potential path going forward for both economic growth and inflation?
Reasons for the Error
The broad explanation offered by the BEA for the existence of a significant statistical discrepancy is that the output and income accounts use different data sources with different timing and different seasonal adjustment. However, other explanations include misreporting or evasion of taxes, inconsistent approaches to measuring depreciation, and measures of capital gains and losses leaking into measures of profits and income where they don’t properly belong.1
These, of course, are not new problems and, in an ideal world, the BEA would be leading a drive to achieve greater consistency in data collection, accounting and seasonal adjustment techniques to try to nearly eliminate the statistical discrepancy. However, perhaps because of budget constraints, the annual revisions merely chip away at the problem. As evidence of this, over the past decade, annual revisions have reduced the statistical discrepancy by only 20% for the most recent GDP quarter.
Consequently, this Thursday’s data may only provide partial enlightenment on some key economic issues. That being said, recent history does suggest two things about the likely nature of this year’s revision.
First, to the extent that the gap between output and income is closed by revisions, most of the change will likely occur on the income side of the ledger. Over the last decade, the absolute size of the percentage revisions to output have been only half as large as the revisions to income.
Second, in revising income, while the BEA may boost measured worker compensation, they are more likely to increase profits or proprietors’ income. Historically, those categories have seen much larger revisions than compensation.
What the Revisions could Reveal
So what might we learn about the economy this week?
First, current data show that, despite the pandemic, real GDP grew at an above trend 2.2% over the past five years – will revisions trim those numbers down to 2.0% or below?
Second, will revised data show stronger gains in personal income or corporate profits or both over the past five years?
The personal saving rate stood at 3.3% in the second quarter compared to 7.4% on average in 2019. If personal income is revised up, it should boost the personal saving rate, leaving consumers looking less tapped out heading into the end of the year.
Second quarter adjusted after-tax profits for all corporations, according to the BEA, were up 29% from five years earlier. However, S&P500 pro-forma and operating earnings per share were up 45% and 46% respectively over the same period. If revisions show that the government numbers underestimated profit growth, they could also suggest that corporations have the resources to continue hiring and investing into 2025.
Any revisions to inventory growth could also be important in determining the pace of stock-piling or inventory reduction as 2024 draws to an end.
Finally, economists will be watching revisions to inflation, as measured by the personal consumption deflator. Revised data could widen or narrow the gap between CPI inflation and its cooler consumption deflator counterpart. This will either increase or diminish the probability that year-over-year consumption deflator inflation could fall to 2.0% in September, validating the Fed’s aggressive monetary easing move of last week and increasing the likelihood of a speedier “normalization” in interest rates going forward.
Investment Implications
Markets are supposed to be forward looking so some might question the relevance of revisions going all the way back to 2019. However, the truth is there remains great uncertainty about the path the economy is on. So far, current data continue to point to a soft-landing expansion. However, with futures markets anticipating faster Fed easing than the Fed itself is indicating and the S&P500 trading at a lofty 21.4 times forward earnings, it appears that financial markets have more than fully discounted this benign outcome. In this environment, it makes sense to be well diversified and pay special attention to any information, including revised national income and product account numbers, that might suggest any straying from this still narrow path.