


Is it the right time to get invested and stay invested?
Compounding can help build wealth, but many investors fall into two common traps. Here’s why.
Read more

FIXED INCOME IN AN INFLATIONARY WORLD
Prolonged inflation, central bank tightening and slower economic growth will likely persist, prompting some investors to work harder in the search for more attractive income prospects1.
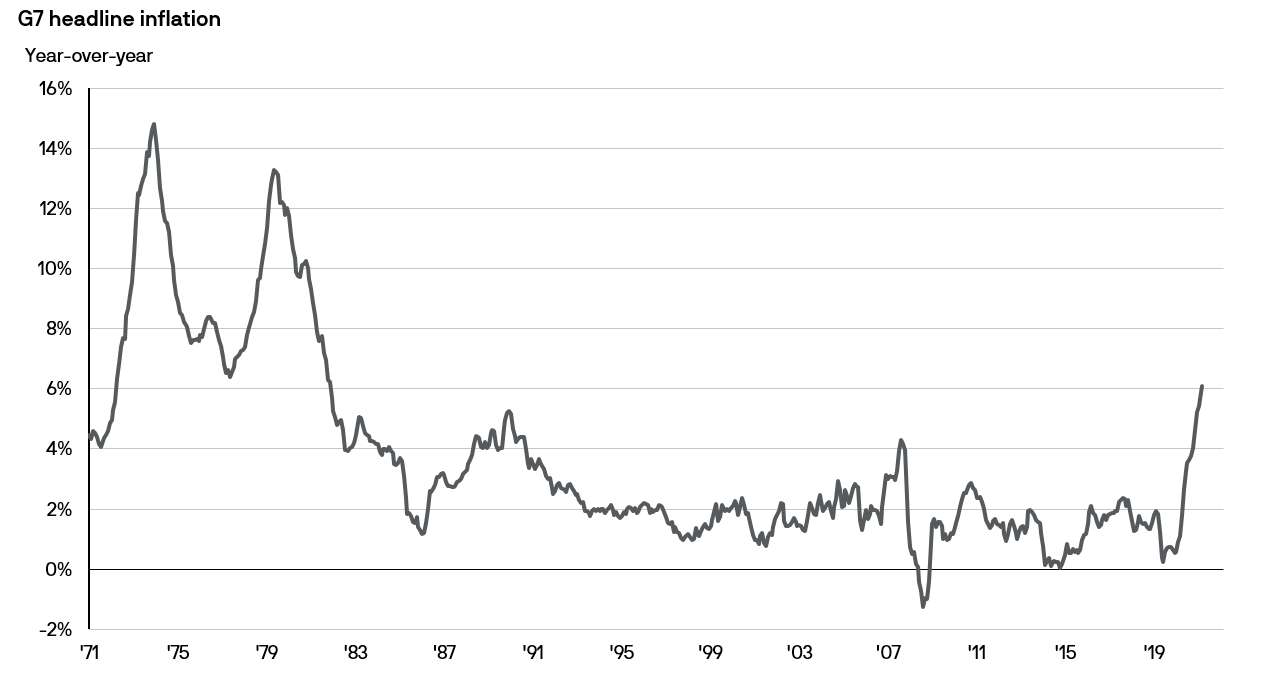
2. Source: FactSet, World Bank, J.P. Morgan Asset Management. Data as of 31.03.2022. G7 refers to Group of Seven nations - Canada, France, Germany, Italy, Japan, the UK and the US.
Inflation remains a key focus amid tight supply chains, semiconductor shortages, higher energy and food prices and rising wage costs. In Australia, the annual consumer price index rose to 5.1% in the March 2022 quarter3 because of higher housing construction costs and fuel prices. The Reserve Bank of Australia has responded to this higher inflation by increasing rates to 0.85%4 in June 2022. This is matched by the US Federal Reserve (Fed) as they are likely to continue raising rates over the balance of 2022. We believe the Fed will look to get to at least 3% on the policy rate as quickly as possible before reassessing the fundamental backdrop.
In today’s environment, it’s crucial to employ an unconstrained and flexible approach to differentiate and invest where opportunities can be found – with a particular focus on seeking quality and higher yielding allocation ideas.
FIXED INCOME SOLUTIONS IN AN INFLATIONARY WORLD
WHERE WE SEE OPPORTUNITIES
1. Diversifying across the fixed income spectrum
An unconstrained approach can help identify the high-conviction investing ideas for a diversified fixed income portfolio.
As market conditions evolve, allocating across the full fixed income spectrum - traditional assets such as government and investment-grade (IG) bonds as well as non-traditional assets such as securitied5 credit and high-yield6 (HY) corporate bonds - can help build a resilient and diversified portfolio.
Investors should consider how they allocate to each fixed income market segment as the difference in drivers of return, sensitivity to interest rate movements and corporate fundamentals will affect returns. Having the flexibility to move between sectors may be advantageous.
2. Actively managing duration7
In fixed income investing, duration is a gauge of interest rate risk, showing how bond prices and yields will likely change when rates move. Generally, longer duration bonds may suffer more price decline in response to a rise in interest rate. Therefore, duration positioning has served both as a risk management8 tool as well as a source of alpha.
We prefer high quality, short-duration bonds. We believe government bonds can be a place to add duration. Yields on 10-year US Treasuries more than doubled this year, as of 8 June 2022, and should offer some flight-to-quality benefits at a yield above 3%9. If Fed expectations shift to a higher terminal rate, we believe the front-end of the Treasury market would absorb most of the repricing, with the back-end remaining stable.
Our research encompasses fundamental, quantitative and technical analysis
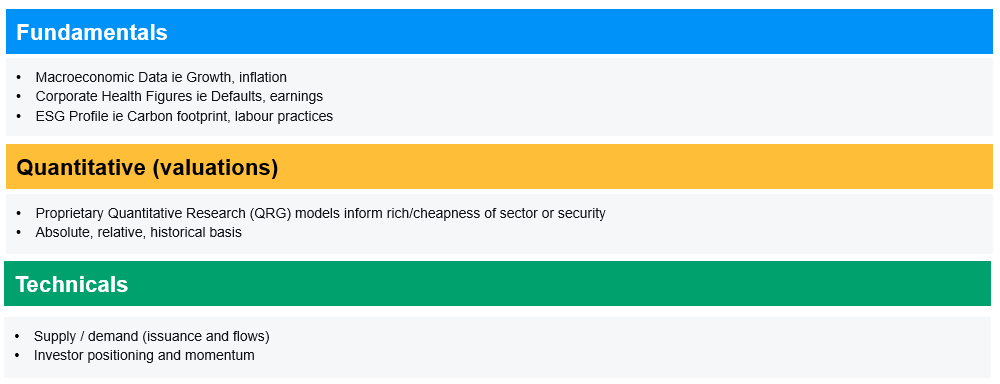
Provided for illustration only, not to be construed as offer, research or investment advice. As of 31.03.2022.
Our risk management discipline is essential to our investment process.
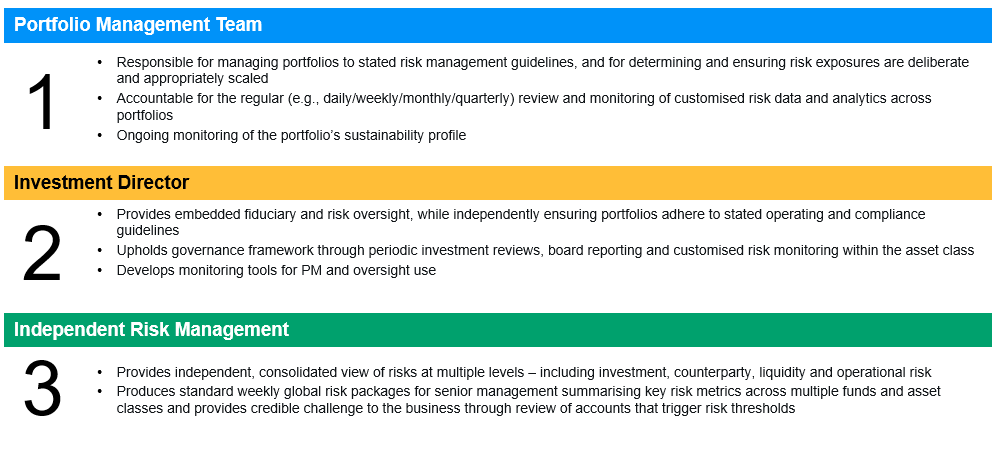
The portfolio risk management process includes an effort to monitor and manage risk, but does not imply low risk. The manager seeks to achieve the stated objective. There can be no guarantee the objective will be met. Forecasts, projections and other forward looking statements are based upon current beliefs and expectations, may or may not come to pass. They are for illustrative purposes only and serve as an indication of what may occur. Given the inherent uncertainties and risks associated with forecast, projections or other forward statements, actual events, results or performance may differ materially from those reflected or contemplated. As of 31.03.2022.
![]()
![]()
![]()
* Includes portfolio managers, research analysts, traders and investment specialists with VP title and above.
^ Due to rounding, data may not always add up to the total AUM. AUM figures are representative of assets managed by the Global Fixed Income, Currency & Commodities group and include AUM managed on behalf of other J.P. Morgan Asset Management investment teams. The manager seeks to achieve the above stated objective. There can be no guarantee the objective will be met.
Source: J.P. Morgan Asset Management, as of 31.03.2022.
Provided for information only based on market conditions as of date of publication, not to be construed as investment recommendation or advice. The manager seeks to achieve the stated objectives. There can be no guarantee the objectives will be met.
Diversification does not guarantee investment return and does not eliminate the risk of loss.
1. For illustrative purposes only based on current market conditions, subject to change from time to time. Not all investments are suitable for all investors. Exact allocation of portfolio depends on each individual’s circumstance and market conditions.
3. Source: Consumer Price Index, Australia, Key Statistics, Australian Bureau of Statistics, 27.04.2022.
4. Source: “Statement by Philip Lowe, Governor: Monetary Policy Decision”, Reserve Bank of Australia, 07.06.2022.
5. Securitisation is the process in which certain type of assets, such as mortgages or other types of loans, are pooled so that they can be repackaged into interest-bearing securities. Examples of securitised debt include asset-backed securities and mortgage-backed securities.
6. High-yield credit refers to corporate bonds which are given ratings below investment grade and are deemed to have a higher risk of default. Yield is not guaranteed. Positive yield does not imply positive return.
7. Duration is a measure of the sensitivity of the price (the value of the principal) of a fixed income investment to a change in interest rates and is expressed as number of years.
8. The portfolio risk management process includes an effort to monitor and manage risk, but does not imply low risk.
9. Source: J.P. Morgan Asset Management, “Global Fixed Income Views 3Q 2022”, 13.06.2022.
CONTACT US

For more information, please call or email us. You can also contact your J.P. Morgan representative.
1800 576 100 (Application enquiries)