Amid the festivities
It is customary in Hong Kong and Singapore to serve ‘pun choi’, or a prosperity pot, when families and friends gather to celebrate the Lunar New Year3. The dish comprises multiple layers of seafood, meats and vegetables, and is slow-cooked over time.
And like a ‘prosperity pot’, investors, depending on their investment objectives and risk appetite, could consider a wider variety of income sources in an investment portfolio1.
Seeking diversification in a portfolio for robust income potential has become increasingly important especially as the Fed is expected to raise interest rates this year4.
Broadening income sources
Symbolising unity and good fortune, the aim of a ‘prosperity pot’ is to tap into a wide variety of quality ingredients in the casserole, such as abalone, which can be sourced from South Africa, dried scallops from Japan or pork belly from Spain, just to name a few options. And the dish can become more flavourful, or sometimes complex, deeper inside the casserole3.
Searching for income could be likened to seeking quality ingredients for this Lunar New Year dish, investors could consider traditional and non-traditional sources within a single asset class, or multiple asset classes across different regions, markets and sectors.
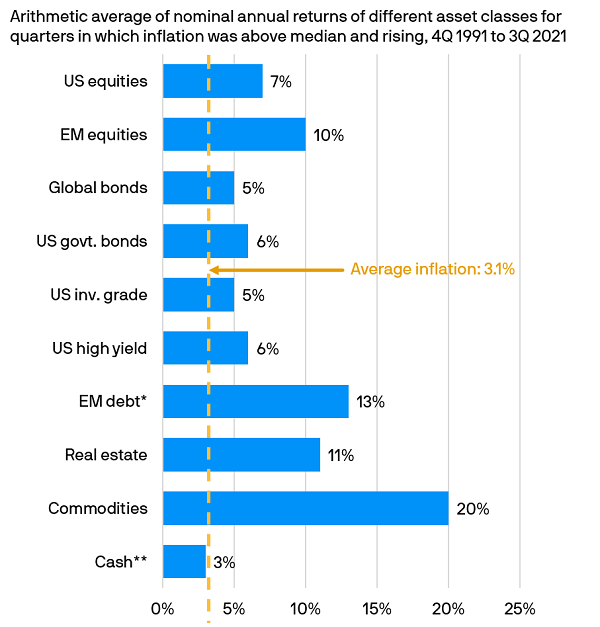
Investing across a broader spectrum of asset classes in the overall portfolio1 could help capture income opportunities and manage risks, as some asset classes could have a relatively lower correlation against the others in changing market conditions, and could generate different returns, as illustrated in the chart below5.
Asset class returns in a high-inflation environment5

5. Source: Barclays, Bloomberg, Dow Jones, FactSet, Federal Reserve, J.P. Morgan, MSCI Global, NCREIF, Strategas/Ibbotson, J.P. Morgan Asset Management. Median inflation was 2.33% in measured period. Rising inflation distinction is relative to the previous quarter. High and rising inflation occurred in 34 of the 120 measured quarters. *Emerging Markets (EM) debt based on the period 4Q 1994 - 3Q 2021. **Cash based on the period 4Q 1992 - 3Q 2021. Based on Shiller S&P 500 Composite total return index (US equities), MSCI Emerging Markets Index (EM equities), Bloomberg Barclays Global Aggregate (Global bonds), Bloomberg Barclays Aggregate US Treasury Index (US govt. bonds), Bloomberg Barclays Aggregate US Corporate Investment Grade Index (US inv. grade), Bloomberg Barclays U.S. Corporate High Yield Index (US high yield), J.P. Morgan EMBI Global (EM debt), NCREIF Property Index (Real estate), S&P GSCI (Commodities) and Bloomberg Barclays U.S. Treasury – Bills (1-3 months) (Cash). Indices do not include fees or operating expenses and are not available for actual investment. Past performance is not a reliable indicator of current and future results. Data reflect most recently available as of 31.12.2021.


