

Stock, flow or impulse?
07/09/2017
Andrew Norelli
North Korea, Charlottesville, border wall funding, Arpaio, two hurricanes, and North Korea (again) have collectively renewed a sense of social and political chaos in the United States in recent weeks, but you wouldn’t know it from looking at stock prices or credit spreads. Conversely, economic data in the US has been reasonably firm, with Q2 GDP revised up to 3.0% and Q3 still tracking above 3% according to the Atlanta Fed. And yet, you wouldn’t know it from looking at Treasury yields. Risk asset prices have remained resilient, but interest rates have fallen to post-election lows. Both price movements are confounding in the sense that economic performance should drive interest rates, and/or that risk markets are not properly reflecting the looming geopolitical risks. However, neither economic data nor the chaotic news cycle is the dominant force driving prices right now. It’s still central bank balance sheets, and specifically the flow (as opposed to the stock or the impulse) of global quantitative easing (QE) that is maintaining the buoyancy in financial asset prices. Given the geopolitical uncertainties, and that US Treasurys are (still!) among the highest-yielding safe-haven assets in the world, it also seems reasonable that their prices would especially benefit from the QE flow.
Notwithstanding all the discussion of balance sheet reduction and tapering, the developed market central banks in aggregate are still very much in expansionary mode, with the G4 balance sheets still growing by more than $1 trillion per year on an annualized pace (see Chart). The strength of asset prices in the face of fundamental challenges serves as an enduring reminder for me of the importance of this positive QE flow.
The link between QE flow and asset prices makes intuitive sense. The world’s stock of savings is held in two places: cash and everything else (“financial assets”). QE, by its nature, increases the supply of cash in the world, and simultaneously decreases the supply of non-cash financial assets, by removing government bonds, corporates, and in some cases equities from circulation. Those securities are replaced in the financial system by cash of equivalent value. So, QE increases the ratio of cash to financial assets worldwide, and that ratio reflects the relative abundance or scarcity of cash available to purchase each unit of assets. QE’s influence on that ratio drives up the price of financial assets, all else equal. This rationale suggests that it is the flow of QE, i.e. the speed with which cash is injected and financial assets are removed, that influences the change in asset prices. Flow is positive, asset prices go up; flow is negative, asset prices go down. However, despite this simplicity (or maybe because of it) the relationship between balance sheets and asset prices is still a matter of intense debate.
Some clever analysis yields a compelling case that the impulse, rather than the flow, of global central bank balance sheets is likely to be the primary driver of asset prices. Whereas the “flow” of QE is the speed of balance sheet increase, the “impulse,” is its acceleration. If the speed of balance sheet growth is slowing down, impulse is negative. A carefully constructed dataset shows a remarkably good fit between QE impulse and change in spreads and stock prices. Unfortunately the fit is so good historically that it almost looks like data mining, and recently, there has been a material breakdown: global central bank QE impulse has already turned negative, most demonstrably back in Q2 of this year, and asset prices have continued to remain buoyant.
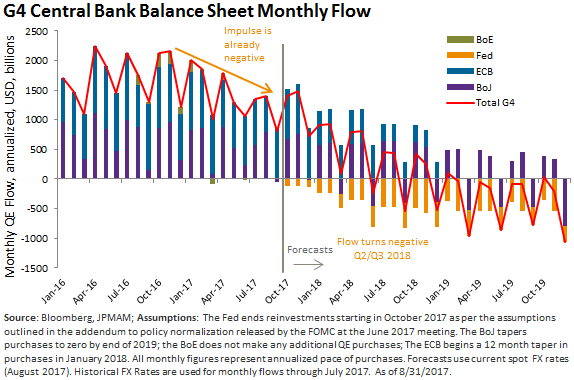
In April and May, the Bank of England completed their final QE program, the ECB reduced their purchases, and the BOJ began an unofficial reduction in purchases as they shifted to a term interest rate cap policy. The rate of balance sheet expansion slowed down, and the rate has continued to slow in the months since. That is, the acceleration, or impulse, in balance sheet size turned negative, while the rate of growth (the flow) remained positive. Meanwhile, global risk assets have remained broadly supported in the face of significant risks to global and domestic stability, and bond prices have also remained high / yields low, despite encouraging growth and employment statistics.
Fed policymakers’ intense focus on shrinking the size of their balance sheet suggests they believe it is the stock, i.e. size of their balance sheet, rather than the flow or impulse which impacts markets and the economy. By that rationale, the stable $4.5 trillion balance sheet remains highly stimulative. If they want to remove part of the stimulus their balance sheet policy provides, they believe they need to shrink it, and that as long as their sheet size is above a certain lower theoretical level, its size alone is still stimulative rather than neutral or suppressive to economic growth.
My feeling is that the flow is the critical factor, both for asset prices as discussed here, and for the impact on the economy (see Printing versus Burning blog post). That is, the current stable balance sheet size is neutral for the US, and attempts to shrink it will be impactful for markets and the economy. However, that neutrality on a domestic level is overwhelmed by QE expansion still going on elsewhere in the G4. As the chart shows, G4 central bank flow does not turn negative until Q2-Q3 2018 (note the assumptions), but I don’t expect that the impact on asset prices will be delayed until that date. The negative domestic flow, set to begin this year, could be more influential than the offsetting positive flow elsewhere. Until negative flow begins in the US though, I expect more of the same.