logo
  • My Collections
    View saved content and presentation slides
  • Portfolio Analysis
  • Log out
  • Funds
      Contact Us

      Fund Listing

      • Mutual Funds
      • ETFs
      • ETF Range
      • How to Invest

      Capabilities

      • All Funds
      • Alternatives
      • Equities
      • Fixed Income
      • ETF Investing
      • Active research
      • Model Portfolios

      In Focus

      • Investing for Income
      • Investing for Fixed Income
      • Investing for Global and EM Equities
      • Investing for Sustainability
      • Investing for Alternatives
    • Insights
        Contact Us

        Market Insights

        • Market Insights Overview
        • Guide to the Markets

          The J.P. Morgan Guide to the Markets illustrates a comprehensive array of market and economic histories, trends and statistics through clear charts and graphs.

        • Guide to Alternatives

          Objective insights on alternatives industry trends, with charts and data across private equity, private credit, real estate, infrastructure and hedge funds.

        • Guide to Investing in Asia

          The Guide to Investing in Asia explores the diverse economies, markets and investment trends across Asia, including Japan, India, China and Southeast Asia.

        • Weekly Market Recap

          Finding balance in Chinese equities: export sectors could gain from progress on trade, while domestic-facing companies cushion against global trade volatility.

        • On the Minds of Investors

          What investment questions are on the minds of investors? Explore the questions investors ask frequently and find answers at J.P. Morgan Asset Management.

        • Podcasts

          Insights from Tai Hui, Chief Market Strategist, Asia, on what is happening in financial markets, from our Asia Pacific headquarters in Hong Kong.

        • Mid-Year Outlook 2026

          Global uncertainties abound: the Middle East conflict, central banks' response to returning inflation, U.S. policy shifts and the fast-changing AI landscape.

        • Solving for Fixed Income

          Exploring how the current environment has affected fixed income's traditional role and the many other opportunities that can accomplish its traditional objectives.

        • Eye on the Market

          Explore Eye on the Market, timely commentary that offers views on the economy, markets, and investment portfolios by Michael Cembalest.

        Portfolio Insights

        • Portfolio Insights Overview
        • Guide to ETFs

          Explore J.P. Morgan Asset Management’s ETF investing guide with insights on ETF market trends and best investing practices for smarter portfolio decisions.

        • Global Asset Allocation Views

          Amid resilient growth and a fading energy shock, we stay positive on risk assets, favoring U.S., Japan and EM equities and U.S. high yield.

        • Global Equity Views

          The profit outlook is cloudier, but we still expect modest growth. Many of our investors favor quality financials and industrials, avoiding high-priced defensives.

        • Fixed Income

          We highlight themes and implications from various fixed income teams to help guide your portfolio decisions.

        • Global Fixed Income Views

          Central bank credibility, solid profits, capex and resilient consumers lift expansion odds to 85%, outweighing inflation and AI headwinds.

        • Sustainable Investing

          Sustainable Insights

        • Alternatives Insights

          We bring you insights based on our nearly 50 years of experience investing in alternatives and more than 800 alternatives professionals around the globe.

        • Long-Term Capital Market Assumptions

          Our Long-Term Capital Market Assumptions (LTCMAs) deliver forward-looking return, volatility and correlation estimates for 200+ asset and strategy classes in 20+ base currencies.

      • Investment Ideas
          Contact Us
          • Latest ideas
          • Alternatives Outlook
          • Sustainable investing
          • ETF Knowledge
        • Resources
            Contact Us
            • All Resources
            • Multimedia
            • Insights App
            • Digital Portfolio Insights
            • Announcements
          • About Us
              Contact Us
              • Overview
              • Awards
              • Diversity, Opportunity and Inclusion
              • Spectrum: Our Investment Platform
              • Our Leadership Team
              • Our Commitment to Research
            • Contact Us
              • My Collections
                View saved content and presentation slides
              • Portfolio Analysis
              • Log out
            • Financial Professional Login
            Log in
            You are about to leave the site Close
            J.P. Morgan Asset Management’s website and/or mobile terms, privacy and security policies don't apply to the site or app you're about to visit. Please review its terms, privacy and security policies to see how they apply to you. J.P. Morgan Asset Management isn’t responsible for (and doesn't provide) any products, services or content at this third-party site or app, except for products and services that explicitly carry the J.P. Morgan Asset Management name.
            CONTINUE Go Back
            1. Printing versus burning

            • LinkedIn Twitter Facebook WhatsApp

            Printing versus burning

            20/04/2017

            Andrew Norelli

            The dynamics of the Fed balance sheet have flared up in the macro discourse once again, and for a host of reasons, that discussion has evolved toward a recognition that monetary policy post-QE is simply different, and that if a shrinkage of the balance sheet is undertaken, the “right” size for the balance sheet is probably significantly larger than it was pre-crisis. Notwithstanding the irrelevance of the debate if political disruption worsens in the coming months, I want to examine two of the less talked-about considerations that suggest to me that the optimal balance sheet is larger than what’s implied by the pre-crisis trend, and reduction should be undertaken only if policy rate tightening is demonstrably insufficient to restrain inflation pressure.

            At a primordial level, the Fed’s balance sheet supplies currency in circulation (physical cash) as the medium of exchange. Demand for cash is generally increasing. Perhaps surprisingly, without an expanding supply of the medium of exchange, economic growth is otherwise deflationary. Imagine a group of marooned shipwreck survivors establish an island economy with a fixed money supply; say a finite number of sea shells.[1] Economic growth will ensue as the survivors each work to support the society according to their respective competitive advantages. Hunters hunt, builders build, farmers farm, etc. Productivity expands, as does the real value of the output, but because the number of sea shells is fixed, prices for a given unit of output will trend downward over time as the fixed number of shells is needed for an ever-increasing number of transactions in the economy. That deflationary effect would intensify over time as demographic effects of increasing population contribute to rapid growth in real output, but with that same fixed number of sea shells circulating as the medium of exchange. As prices decline, sea shells would get subdivided. Parallel mediums of exchange would likely surface.

            Avoiding this effect is one of the reasons that central bank balance sheets tend to increase over time in modern fiat currency regimes. If economic growth is desirable (it is [2]) and the central bank has a positive inflation target (all are positive), then currency in circulation generally needs to trend upward to facilitate increasing transaction volume. Currency in circulation right now comprises about $1.5 trillion of the $4.5 trillion total Fed balance sheet, and that’s up from only $800 billion pre-crisis. The rate of growth in demand for cash has also increased, despite the slowdown in nominal GDP growth.

            Additionally, bank deposits are supplanting physical cash as the medium of exchange. Employees are paid by direct deposit, checking account balances are transferred from buyer to seller electronically, bills are paid electronically, and credit and debit cards facilitate the convenience of electronic payment as much as they facilitate extension of credit. This makes a difference. In the primitive island economy above, bankers will bank: someone will take deposits and make loans. That action at a fundamental level though, results from demand for credit, not demand for the medium of exchange. As long as there is no easy way to pay for stuff on the island with deposits (transactions require sea shells of which there is a finite amount), the lack of sea shells would still constrain the economy through transaction volume.[3] In contrast, in our modern economy bank deposits are now nearly fungible with cash because they’re directly spendable, and as such, are supplanting cash as the medium of exchange. This is a long winded way of saying we need deposit growth over time to avoid deflation, the same way we needed physical cash growth in generations gone by.[4]

            In the pre-crisis days, the Fed did not directly create bank deposits. The commercial banking system responded to demand for credit, and sought deposits to fund their credit creation (lending), which in turn created more deposits. The Fed wasn’t involved, other than indirectly influencing demand for credit through their interest rate policy. Credit creation by commercial banks is still a major driver of deposit growth, but now post-crisis, the Fed has a direct role as well. Through their QE programs, the Fed facilitated significant increases in bank deposits. The Fed bought bonds from the private sector, which in turn deposited the money in banks, which in turn deposited the money at the Fed as excess reserves.

            During periods of time in the last eight years where the Fed was actively expanding its balance sheet through QE or the various rescue lending programs, deposit growth in the commercial banking system was noticeably higher than when the taps weren’t open (note the purple bars in the chart below). With the Fed balance sheet flat-lining in 2010 and since 2015, deposit growth slowed to 3.5% and 4.5% respectively. These are the lowest sustained deposit growth rates since the early 1990s. I suggest that shrinking the balance sheet through a reduction in excess reserves will further slow deposit growth or even contract the total level. The anti-inflationary impulse from this would be significant. Without a very robust increase in credit creation to offset the effect, a serious tightening of financial conditions would ensue.
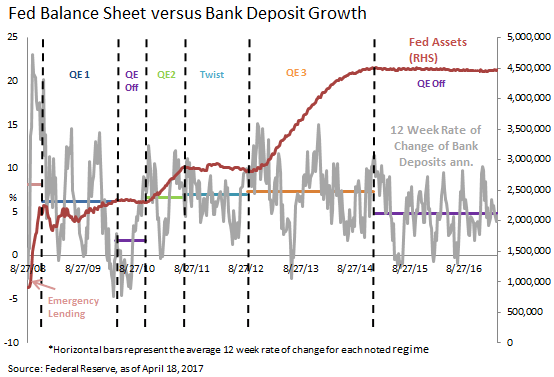
            For those that follow the debate about the Fed balance sheet actively, I’m not at all diminishing the importance of concerns about the reversal of the portfolio rebalance channel, widening term premiums, or the unknown impact of various regulatory changes on demand for excess bank reserves. I’m extending those concerns to highlight the increasing potential significance of bank deposits as a driver of inflation and nominal GDP growth, and the relationship between the change in the size of the balance sheet and deposit growth. In the old central banking regime, the Fed acted reactively to deposit growth by supplying scarce reserves. Now, in a market saturated with reserves, they’re a driver of deposit growth (or potentially shrinkage). For all these reasons, balance sheet reduction has the potential to significantly tighten financial conditions, and should be used when the policy intent is a significant tightening of financial conditions. That is, when materially brisk policy rate tightening isn’t getting the job done.


            [1] To be precise, this is a finite monetary base. Higher order monetary aggregates are not necessarily fixed.

            [2] "Structurally Slowing Growth Implications," May 2016.

            [3] The sea shells remain the monetary base and medium of exchange. The deposits, though part of the “money supply,” are not directly spendable on the island and therefore belong to a higher order monetary aggregate: M1 under the American definition.

            [4] And yet, physical cash demand remains high. The strongly held suspicion is that most of the physical cash in circulation is used for anonymous stores of value and illicit transactions. Some stats: nearly 80% of the currency in circulation is in $100 bills, enough for every American household to inventory over $1000 at a time. Estimates indicate more than half of US physical currency is actually held abroad:

            https://www.federalreserve.gov/pubs/ifdp/2012/1058/ifdp1058.pdf

            • Federal Reserve
            • Central Banks
            • Market Views
            • Monetary Policy
            • Rates
            • Economic Outlook

            RELATED ARTICLES

            Watch the lag: thoughts on core CPI (part 2 – an update)

            We analyze which economic indicators the Fed should pay attention to and which ones are false alarms.

            Read more

            The forest and the trees

            When constantly watching financial markets and following the 24-7 news flow, it can be easy to get caught up in the trees and miss the forest.

            Read more

            Getting the market back on its feet

            Market functionality needs to be restored no matter how anyone feels about the methods it may take to get there. If the current market conditions persist, the consequences may be severe.

            Read more
            JPMorgan Asset Management

            • Terms & Conditions
            • Financial Services Guide
            • Privacy Policy
            • Cookie Policy
            • Investment Stewardship
            • Voting Policy
            • Unit Pricing Policy
            • Complaint Resolution
            • Sitemap
            J.P. Morgan

            • J.P. Morgan
            • JPMorgan Chase
            • Chase

            Please note:  Following recent amendments to the Corporations Act, where unitholders have provided us with your email address, we will now send notices of meetings, other meeting-related documents and annual financial reports electronically unless the unitholder elects to receive these in physical form and notify us of this election. Unitholders have the right to elect whether to receive some or all of such Communications in electronic or physical form, the right to elect not to receive annual financial reports at all and the right to elect to receive a single specified Communication on an ad hoc basis, in an electronic or physical form.


            All investments contain risk and may lose value. This advertisement has been prepared and issued by JPMorgan Asset Management (Australia) Limited (ABN 55 143 832 080) (AFSL No. 376919) being the investment manager of the fund. It is for general information only, without taking into account your objectives, financial situation or needs and does not constitute personal financial advice. Before making any decision, it is important for investors to consider the appropriateness of the information and seek appropriate legal, tax, and other professional advice. For more detailed information relating to the risks of the Fund, the type of customer (target market) it has been designed for and any distribution conditions please refer to the relevant Product Disclosure Statement and Target Market Determination which have been issued by Perpetual Trust Services Limited, ABN 48 000 142 049, AFSL 236648, as the responsible entity of the fund available on https://am.jpmorgan.com/au.