


Combining active and passive
Passive management has its advantages…
Passive management is often seen as an economical way to get market exposure. The clear advantage is that it presents the opportunity to enjoy diversification1 derived from investing in a pool of assets by resembling holdings of a benchmark. Nonetheless, indexing also inherently translates into an inability to deliver any return beyond the benchmark.
…combining active and passive could be even better
What if there was a way to potentially outperform the benchmark after fees, and to achieve this with a risk profile very similar to the benchmark?
Why an enhanced indexing approach?
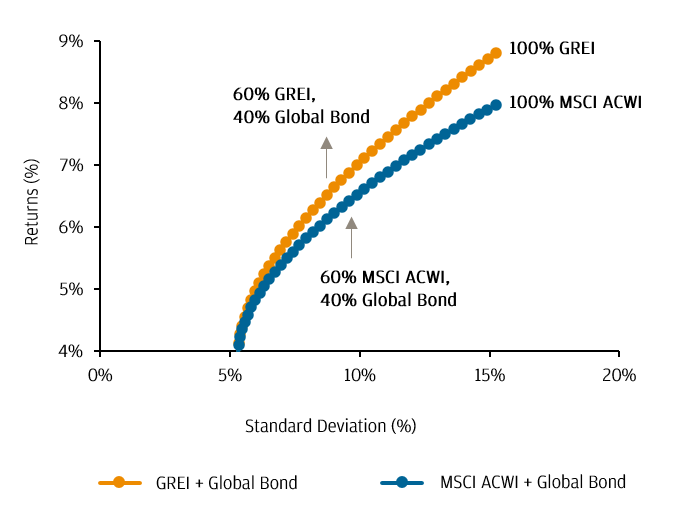
The chart on the right compares efficient frontiers2 using solely index returns for both stocks and bonds (shown in blue) and the corresponding efficient frontiers when JPMorgan Global Research Enhanced Index Equity Fund (GREI) substituted for their respective index funds (shown in orange).
In each instance, the inclusion of GREI over the respective index funds raises the aggregate return with relatively smaller corresponding increase in the aggregate risk. We believe this presents an attractive risk-adjusted return opportunity.
Raising the efficient frontier with GREI versus passive equity indexes3
1. Diversification does not guarantee investment return and does not eliminate the risk of loss.
2. An efficient frontier for a portfolio of assets defines the optimal return of the portfolio for a given amount of risk, using the volatility of returns of hypothetical portfolios as the measure of risk.
3. Source: J. P. Morgan Asset Management, Bloomberg. Data from October 2003 to November 2020. Performance data for JPMorgan Global Research Enhanced Index Equity Fund (Global REI) is based on the Global ACWI REI Composite in USD gross of fees. Global bond returns are based on Bloomberg Barclays Global Aggregate Total Return Index. MSCI ACWI refers to the MSCI All Country World Index. Indices may not include fees or operating expenses and are not available for actual investment. Past performance is not a reliable indicator of current and future results.
Why JPMorgan Global Research Enhanced Index Equity Fund?
The JPMorgan Global Research Enhanced Index Equity Fund (GREI) is a global equity solution with attractive fees, aiming to maximise risk-adjusted returns through active, bottom-up stock selection4.
The Fund strives4 to deliver positive alpha at low active risk by optimising the stock-specific ideas of our team of about 80 fundamental research analysts5. It is part of the global REI strategies J.P. Morgan Asset Management has been managing in the past 30-plus years by exploiting stock specific insights on a risk and transaction cost aware basis.
ACING YOUR PORTFOLIO
ALPHA
GENERATION
optimised by leveraging
a time-tested approach

ACTIVE
STOCK SELECTION5
covering
2,500+ stocks

ATTRACTIVE
FEES
with a risk profile
closely resembling an index

A HIGHLY RATED
PORTFOLIO
with recognitions
from the industry

4. The stated target returns are the investment manager’s objectives only. The objectives are gross of fees. There is no guarantee that these objectives will be met.
5. Source: J.P. Morgan Asset Management, data as of 31.05.2021. For illustrative purposes only.
6. Source: J.P. Morgan Asset Management, as at 30.06.2021. Refers to performance of unhedged share class of JPMorgan Global Research Enhanced Index Equity Fund. Net of fees performance is calculated on Bid – Bid with gross income reinvested, i.e. net of ongoing fees and expenses. Past performance is not indicative of future results and performance.
7. Source: J.P. Morgan Asset Management, as at 31.05.2021. Management costs are comprised of a management fee, expense recoveries and indirect costs. The figures in the above table are based on indirect costs incurred by the Fund in the financial year ending 30.06.2020, including the Responsible Entity's reasonable estimates where information was not available as at the date of the Product Disclosure Statement. As these indirect costs are calculated on the basis of indirect costs paid in the financial year ended 30.06.2020, the actual cost may differ from the amount set out above. A portion of the indirect costs are costs incurred in respect of over-the-counter (“OTC”) derivatives used by the Underlying Sub-Fund and this cost is not capped. Indirect costs are deducted from the Underlying Sub-Fund's assets. They are reflected in the Unit price of the Fund and are not an additional cost to you.
8. The rating issued in March 2021 is published by Lonsec Research Pty Ltd ABN 11 151 658 561 AFSL 421 445 (Lonsec). Ratings are general advice only, and have been prepared without taking account of your objectives, financial situation or needs. Consider your personal circumstances, read the product disclosure statement and seek independent financial advice before investing. The rating is not a recommendation to purchase, sell or hold any product. Past performance information is not indicative of future performance. Ratings are subject to change without notice and Lonsec assumes no obligation to update. Lonsec uses objective criteria and receives a fee from the Fund Manager. Visit lonsec.com.au for ratings information and to access the full report. © 2020 Lonsec. All rights reserved.
9. The Zenith Investment Partners (ABN 27 103 132 672, AFS Licence 226872) (“Zenith”) rating (assigned November 2020 referred to in this piece is limited to “General Advice” (s766B Corporations Act 2001) for Wholesale clients only. This advice has been prepared without taking into account the objectives, financial situation or needs of any individual and is subject to change at any time without prior notice. It is not a specific recommendation to purchase, sell or hold the relevant product(s). Investors should seek independent financial advice before making an investment decision and should consider the appropriateness of this advice in light of their own objectives, financial situation and needs. Investors should obtain a copy of, and consider the PDS or offer document before making any decision and refer to the full Zenith Product Assessment available on the Zenith website. Past performance is not an indication of future performance. Zenith usually charges the product issuer, fund manager or related party to conduct Product Assessments. Full details regarding Zenith’s methodology, ratings definitions and regulatory compliance are available on our Product Assessments and at http://www.zenithpartners.com.au/RegulatoryGuidelines.
RESEARCH IS AT THE CORE OF EVERYTHING WE DO
Stock selection is one of the key drivers of excess returns. Leveraging fundamental insights of about 805 equity analysts globally, we translate this advantage into a robust valuation model, which further contributes to a portfolio that maximises our convictions.
Uncompensated risk is managed using a portfolio construction framework which limits stock-specific, sector, region, style and country risks as well as trading costs.

- About 80 fundamental research analysts5 globally
- 2,500+ securities names5 covered
- Analysts forecast normalised and sustainable earnings

- Proprietary earnings and cash flow estimates
- Stocks quintile ranking based on fundamentals
- Common language and valuation concept across sectors and analysts

- Experienced portfolio management team drives portfolio construction
- Maximise stock specific ideas within risk control bands
- Manage uncompensated risks (beta, sector, style)
5. Source: J.P. Morgan Asset Management, data as of 31.05.2021. For illustrative purposes only.
MANAGED WITHIN AN ESG FRAMEWORK
Environmental, social and governance (ESG) factors are of growing importance to investors and can have significant implications for long-term performance. Systematic and explicit consideration of these factors is built into the strategy’s investment process.
![]()
Stewards of the Environment
![]()
Equitable approach to Social capital
![]()
Governance that fosters sustainability and long-term value creation
OUR GLOBAL EQUITIES CAPABILITIES10

US$699 billion
Assets under management
7
locations worldwide
370+
Equity investment professionals with 13+ average years of experience
145
Equity research analysts with 10+ average years of experience
US$150 million
Global research budget
10. Source: J.P. Morgan Asset Management as of 31.03.2021. Includes portfolio managers, research analysts, traders and investment specialists with VP title and above.
Our insights

For more information, please call or email us. You can also contact your J.P. Morgan representative.
1800 576 100 (Application enquiries)