Global Market Strategist
.png)
In Brief
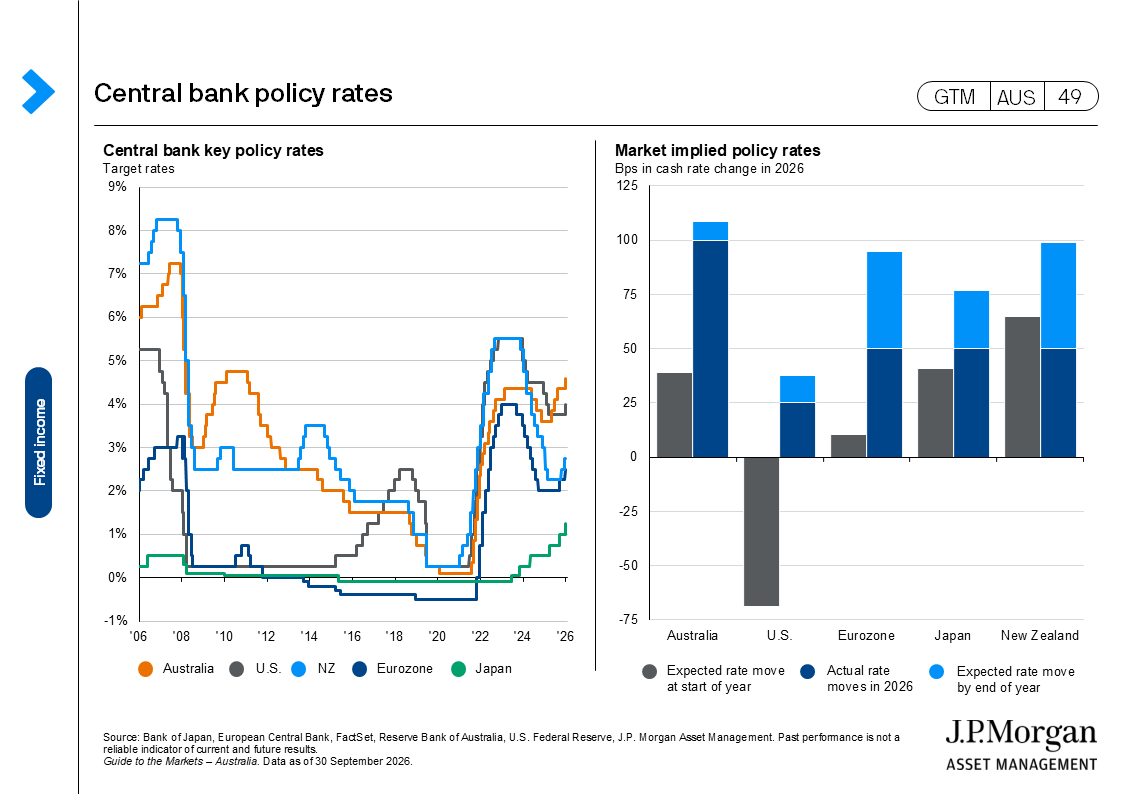
- Central banks moved from talk to action: the Fed delivered its first rate hike since 2023, the RBA raised rates for the fourth time this year to a 15-year high, and the ECB and BoJ tightened further.
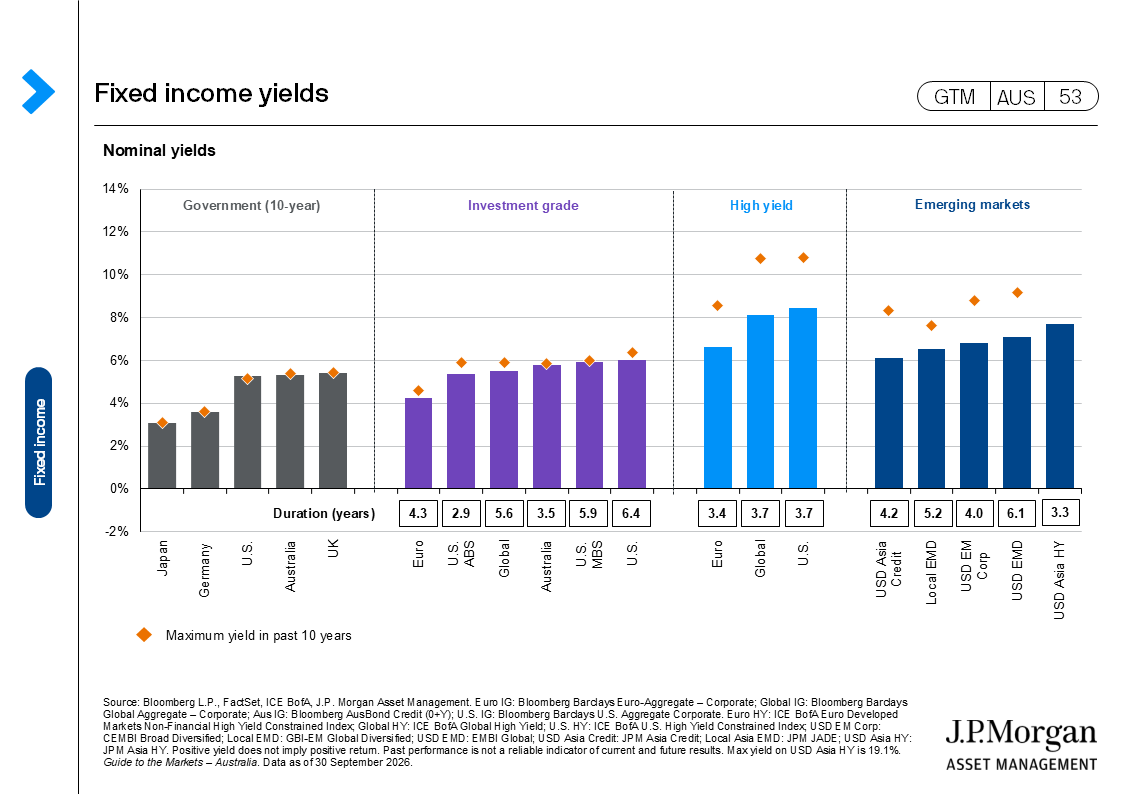
- Global bond yields pushed to multi-decade highs, with implications for portfolio construction well beyond fixed income.
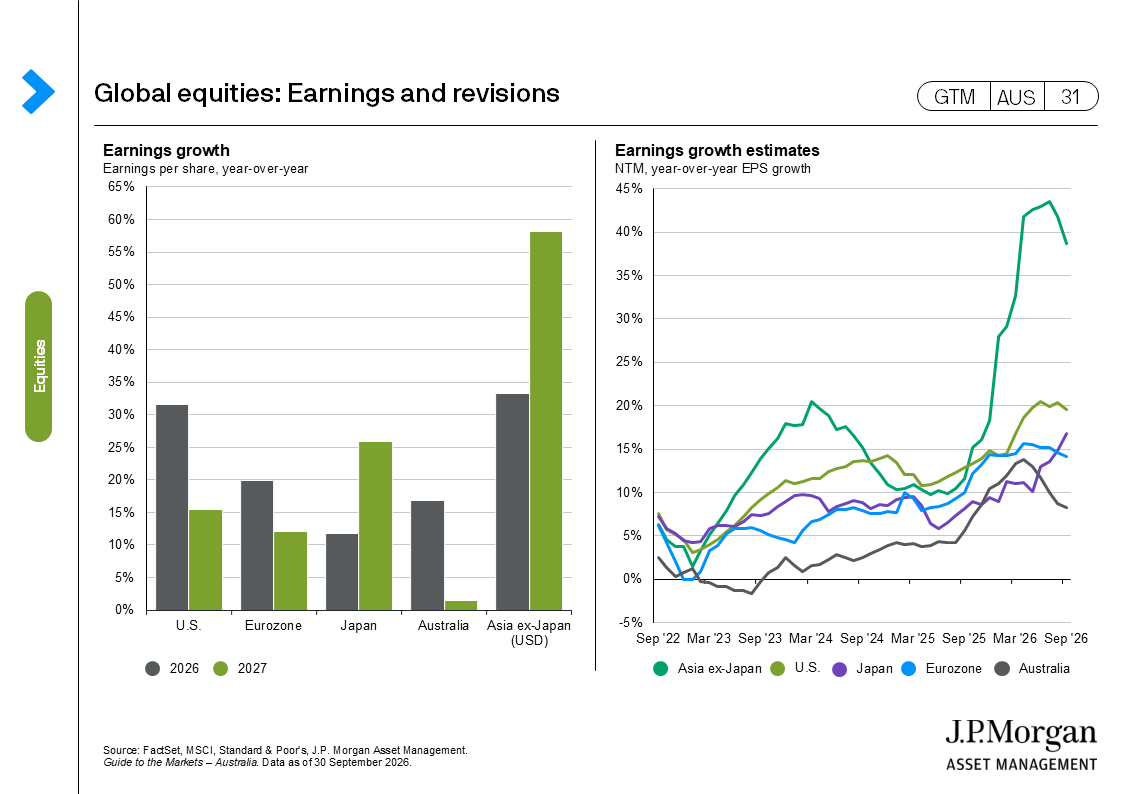
- Equities broadly held their ground, although Australian shares proved more rate-sensitive than U.S. peers. Growing scrutiny of AI security and earnings risks added a note of caution.
September echoed August’s warning, but this time central banks moved from talk to action, tightening policy as the global economy outperformed expectations. Bond yields surged to levels not seen in decades. Equities weathered the storm, buoyed by robust earnings, though Australia felt the strain as housing weakness dragged on performance. Oil and gold prices swung sharply as Middle East tensions ebbed and flowed, and a hawkish policy stance took centre stage.
Talk turns to action
The U.S. Federal Reserve raised rates for the first time since July 2023 at the September FOMC meeting, lifting the federal funds rate by 25 basis points to 3.75%–4.00%. The decision was unanimous. Updated forecasts revealed that most policymakers anticipate at least one more hike before year-end, with inflation unlikely to hit the 2% target until 2029.
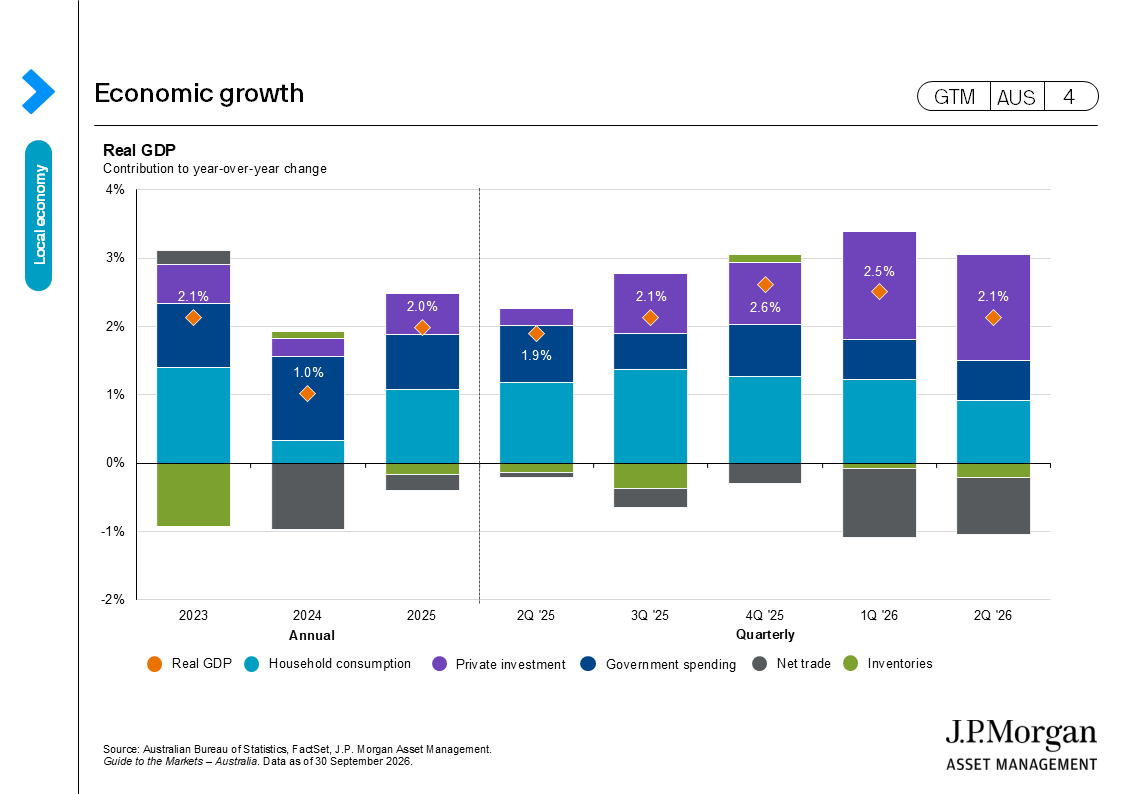
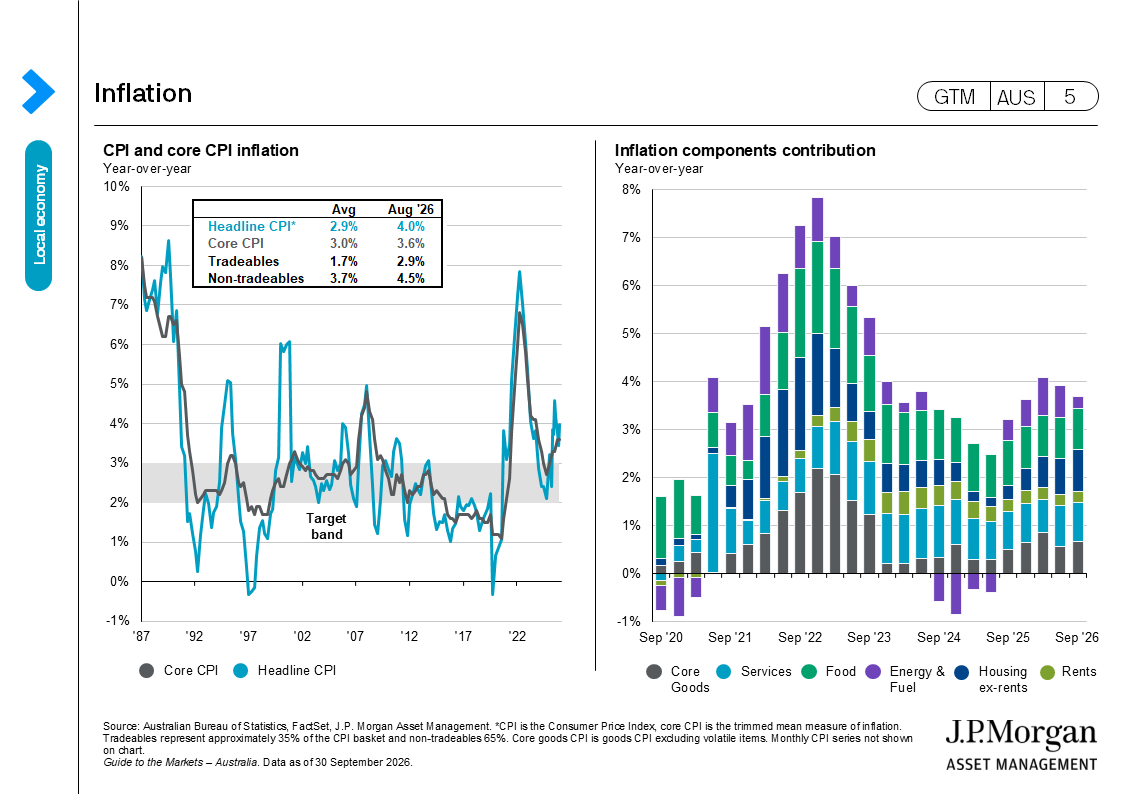
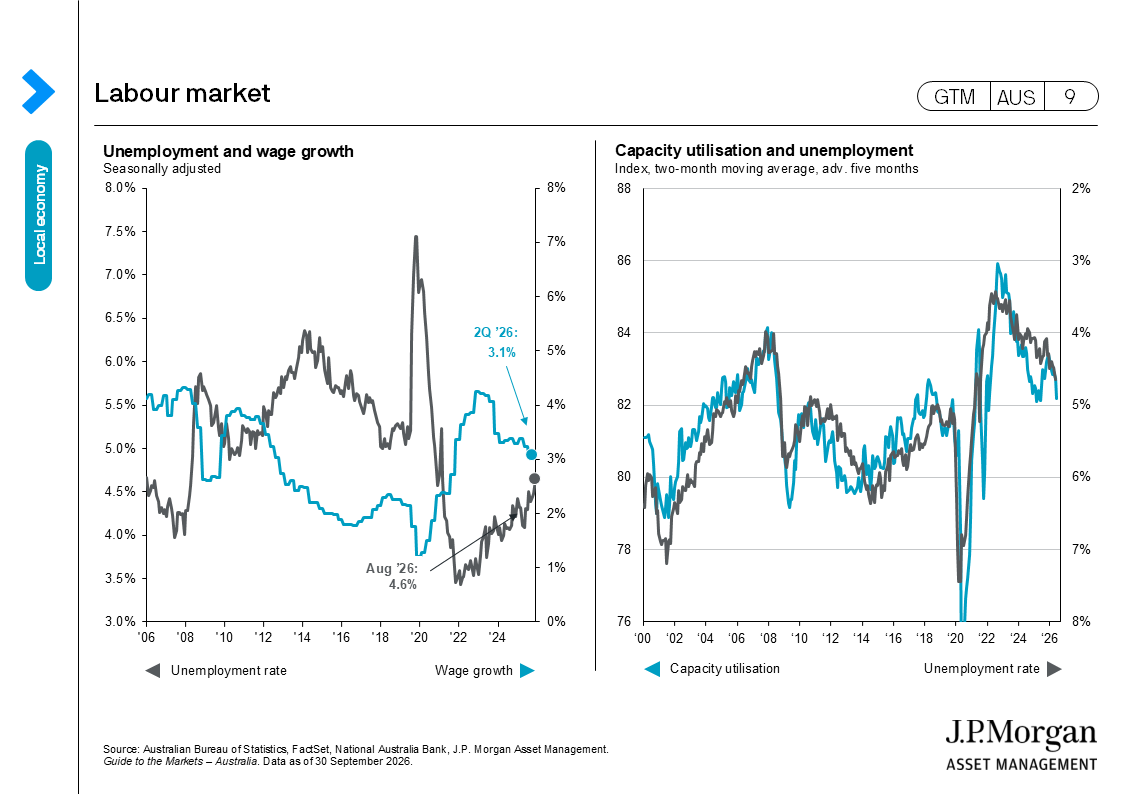
Closer to home, the Reserve Bank of Australia (RBA) delivered its fourth rate hike this year, increasing the cash rate by 25 basis points to 4.60%, the highest since late 2011. The Board’s unanimous decision left the door open for further tightening, citing unexpectedly strong inflation. The total tightening now stands at 100 basis points, more than offsetting last year’s easing. However, we see this cycle as relatively shallow, with these hikes serving as risk management given the slowing economy and the expectation that inflation will return to target in 2027.
Elsewhere, tightening was widespread. The Bank of Japan raised its policy rate to 1.25%, a 31-year high, though limited guidance disappointed markets and the yen weakened. The European Central Bank also lifted its deposit rate to 2.5%, marking its second hike this year.
Bonds take centre stage
The most visible impact of central-bank action was felt in government bond markets. The U.S. Treasury curve bear-flattened, yields rose across the curve, but shorter-dated bonds saw sharper increases. The 2-year U.S. Treasury yield rose 53 basis points to 4.87%, while the 10-year yield climbed to 5.27%, its highest since 2007 and 100 basis points above its start-of-year level. Australian yields followed suit, with the 10-year yield hitting a 15-year high above 5.4% mid-month, up from 4.6% in July, before easing slightly after the RBA’s expected hike.
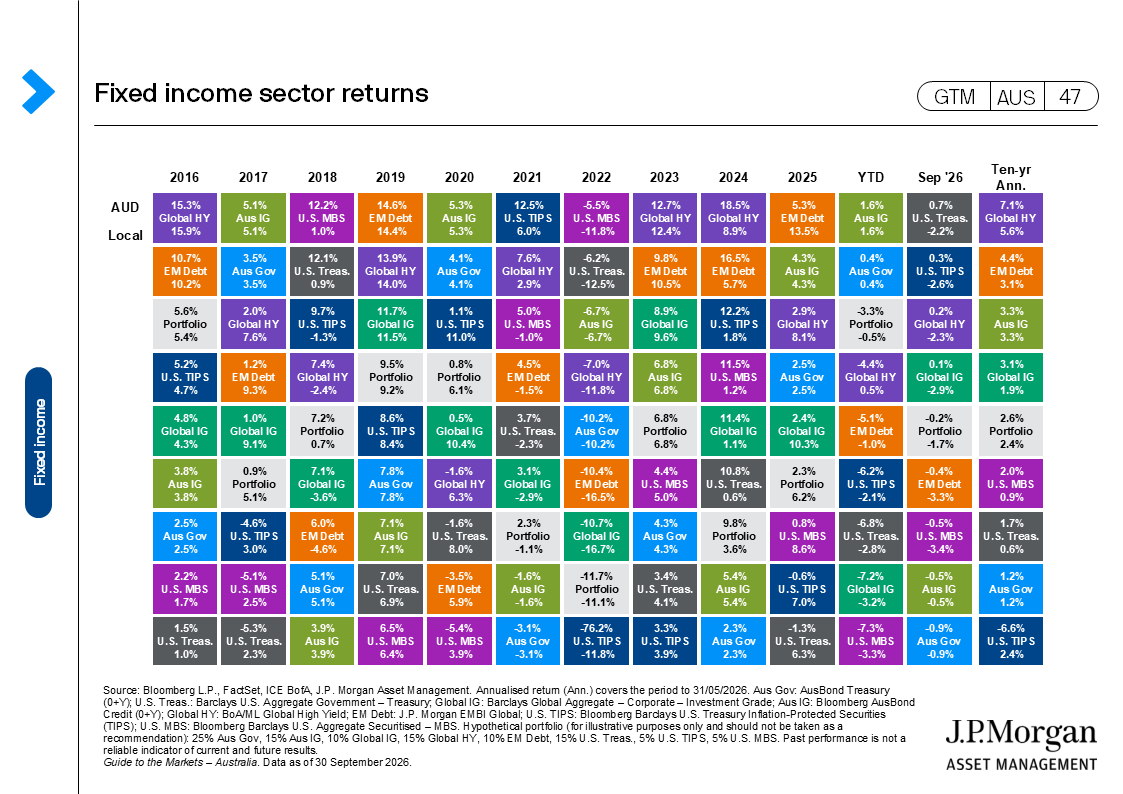
Crucially, higher bond yields don’t necessarily signal a riskier environment; much of the rise reflects resilient economic activity. For portfolio construction, two points stand out. First, duration risk is once again a key driver of returns, so fixed income allocations deserve careful attention to maturity profiles rather than being lumped together as a defensive asset. Second, higher yields are restoring the appeal of income-generating assets, especially as rising rates weigh on rate-sensitive equity sectors in Australia.
Equities stand their ground, mostly
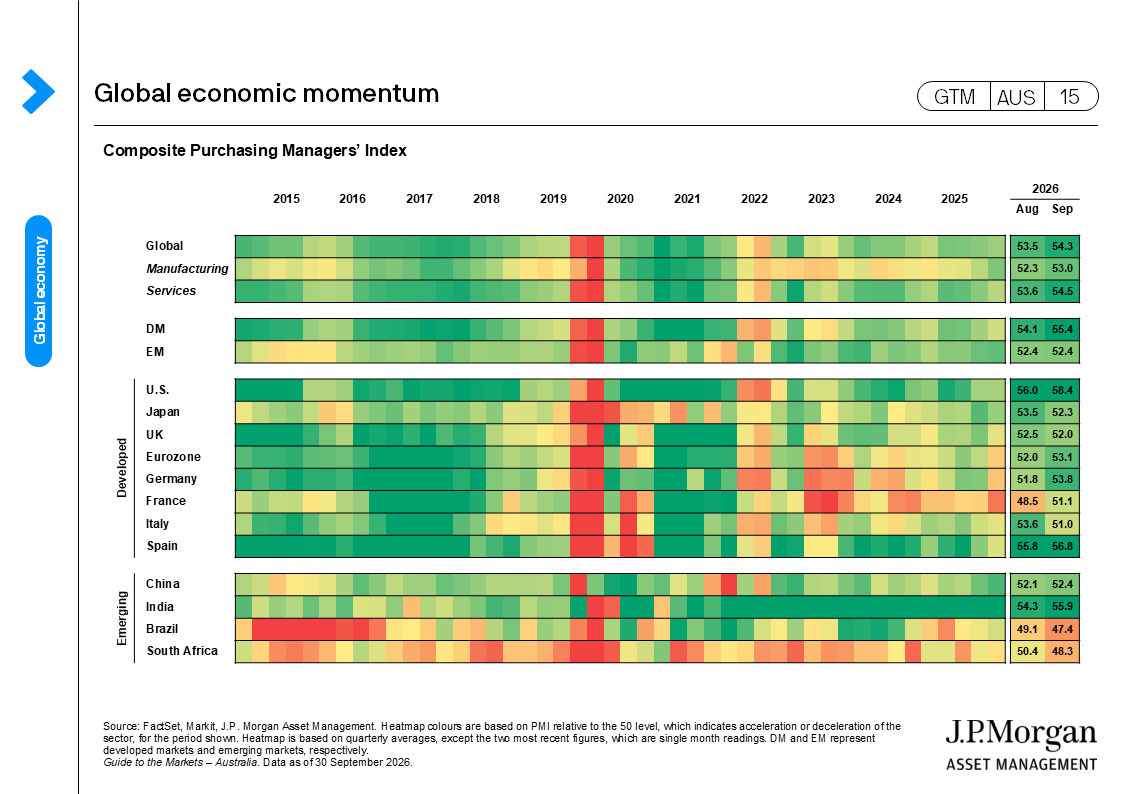
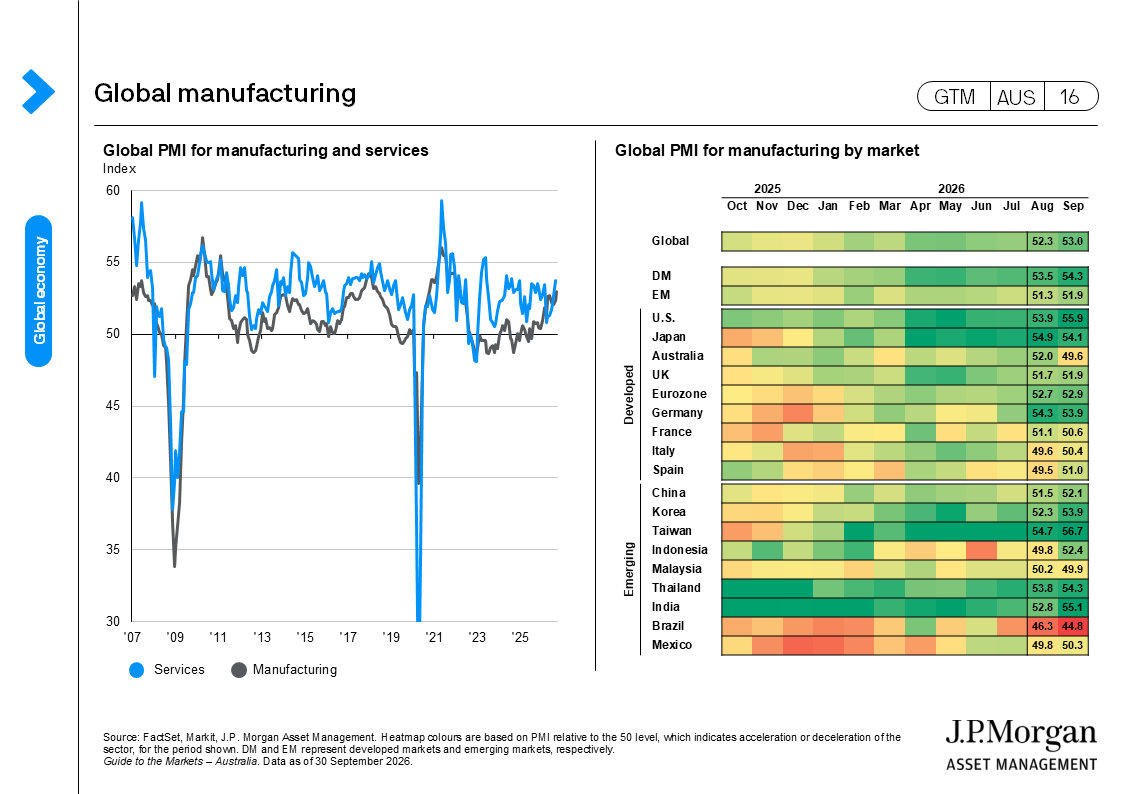
Global equities proved resilient. The S&P 500 slipped just 0.3%, while the Nasdaq gained 1.9%. Technology and communication services led returns, though several sectors ended the month lower. Asian markets were mixed: Taiwan’s TAIEX and Korea’s KOSPI rose on continued demand for artificial intelligence, while China’s equity market lagged despite signs of stabilising economic momentum. Chinese manufacturing surveys returned to expansion, and policymakers ramped up targeted support, hinting that downside risks to the growth outlook may be easing.
The artificial intelligence investment theme faced greater scrutiny, with investors focusing on security risks and intensifying competition among developers, which is pressuring prices as adoption decisions shift from technology teams to finance teams.
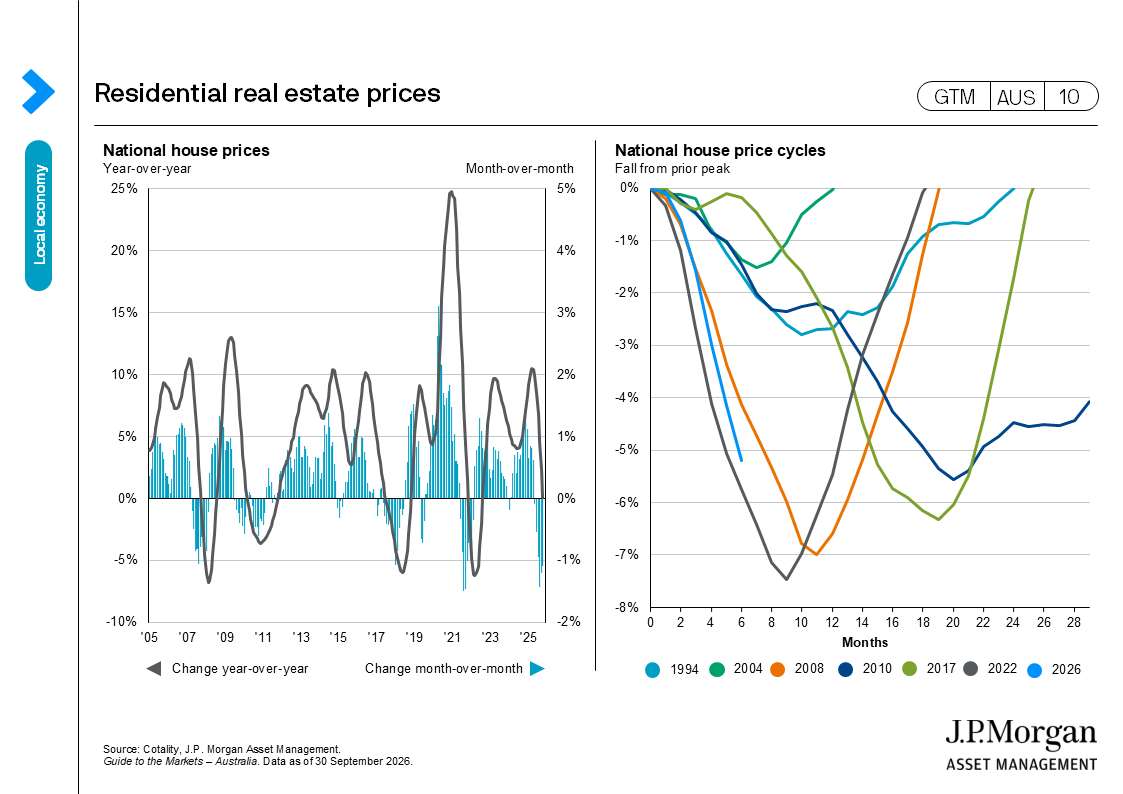
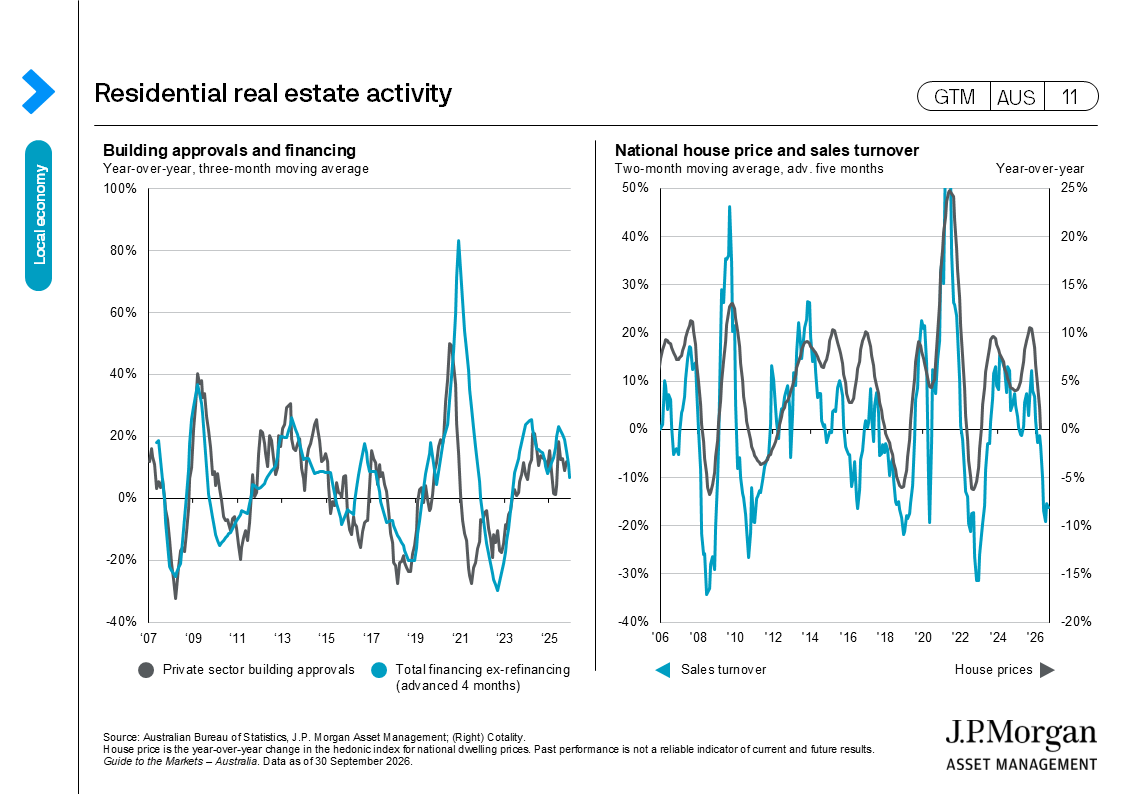
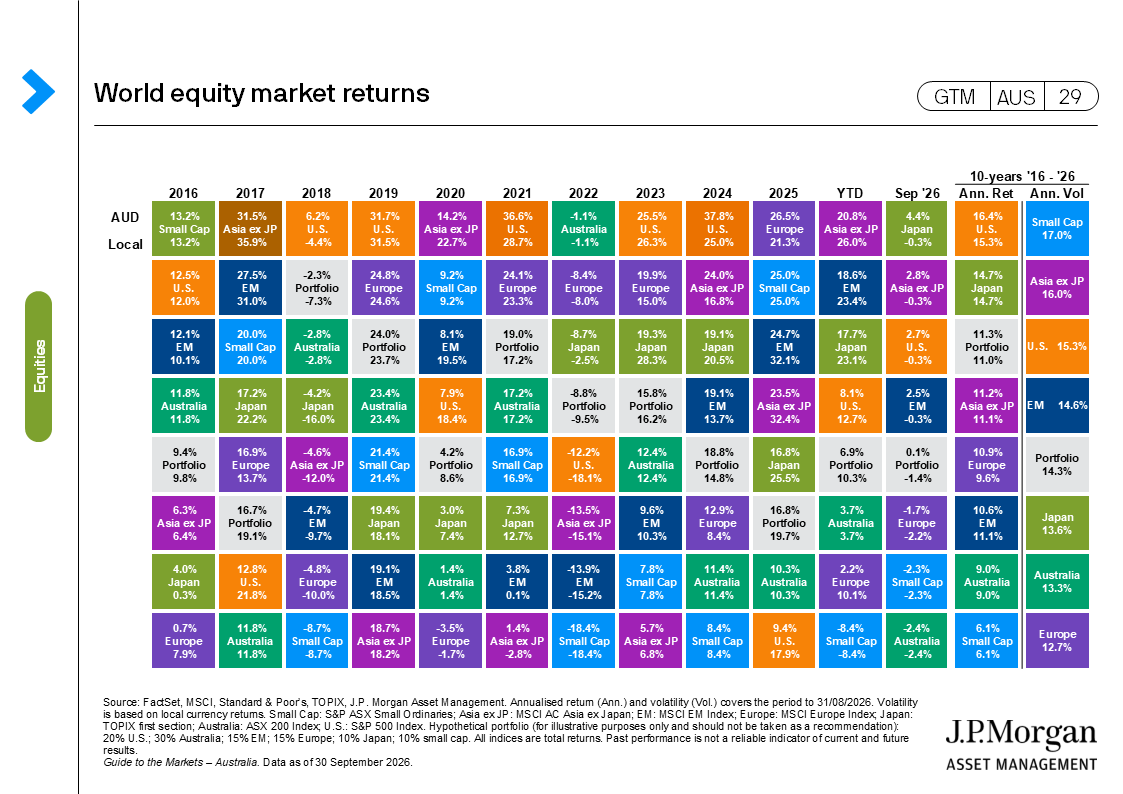
Australian equities were more vulnerable to domestic monetary tightening and the ongoing housing slowdown. The ASX 200’s five-month winning streak ended with a 3.2% fall in September, as persistent inflation, rising borrowing costs and higher fuel prices dampened sentiment. Still, the index gained 0.1% over the third quarter.
Commodities change direction
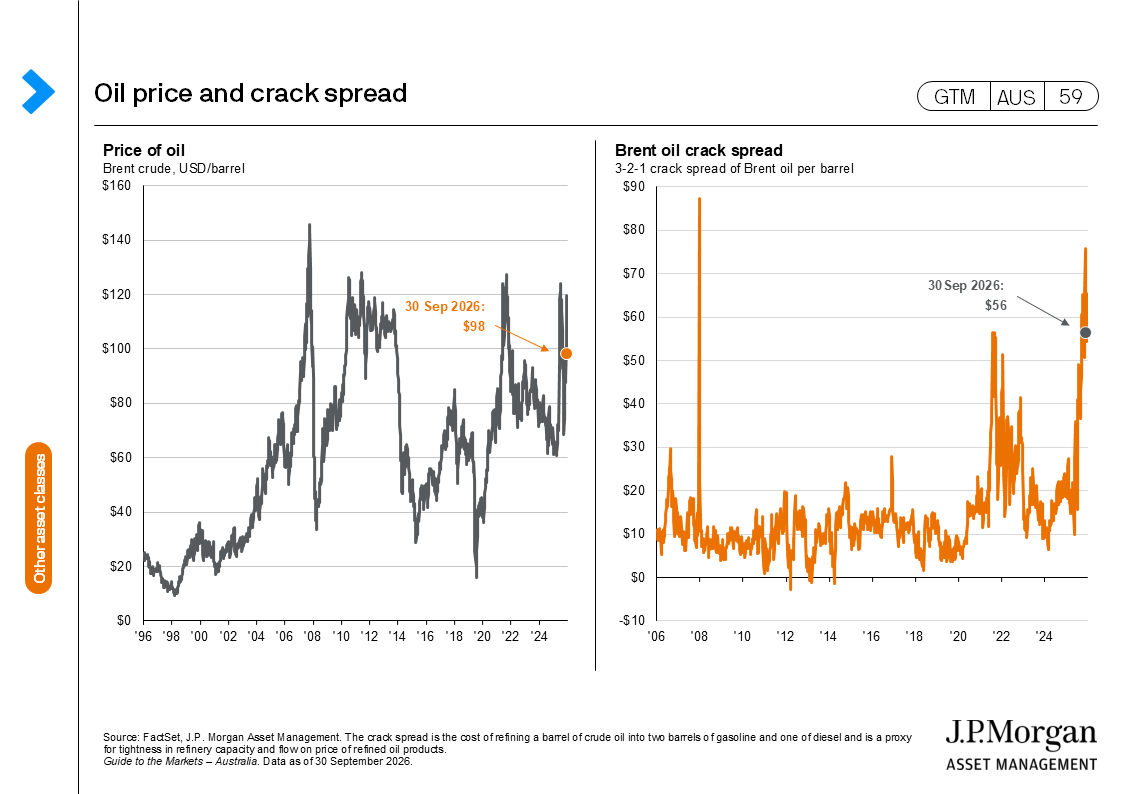
Commodity markets were volatile in September. Brent crude spiked to USD 130 per barrel mid-month amid escalating Middle East tensions but had eased to USD 98 by month-end. Reports of crude flows returning to about 95% of pre-war levels helped calm nerves. Saudi Arabia restored disrupted pipeline flows, and increased use of smaller “shuttle ships” reduced the number of tankers passing through the Strait of Hormuz.
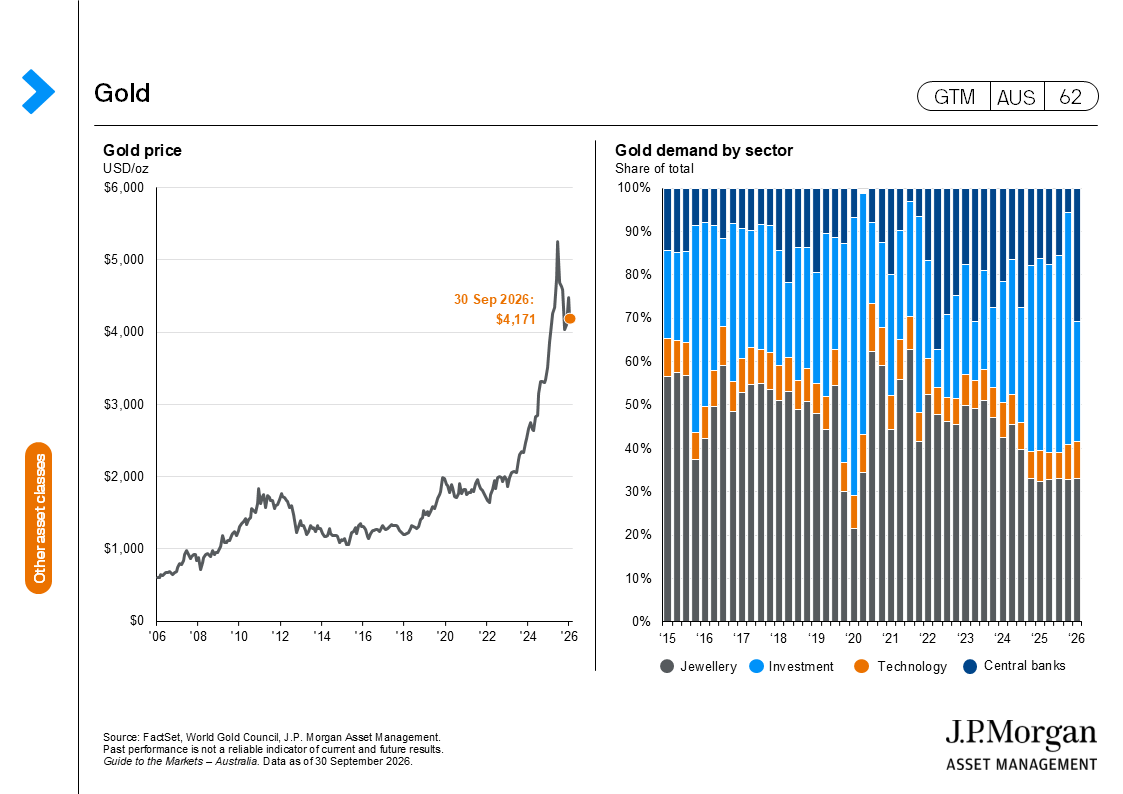
The conflict’s outcome remains uncertain, so crude prices retain a significant risk premium. Refined products face extra pressure as they’re harder to transport, and already high utilisation of existing refinery capacity is keeping diesel, petrol and jet fuel prices elevated. Gold declined as rising real rates overshadowed ongoing concerns about U.S. dollar debasement.
A harder environment, but not a hostile one
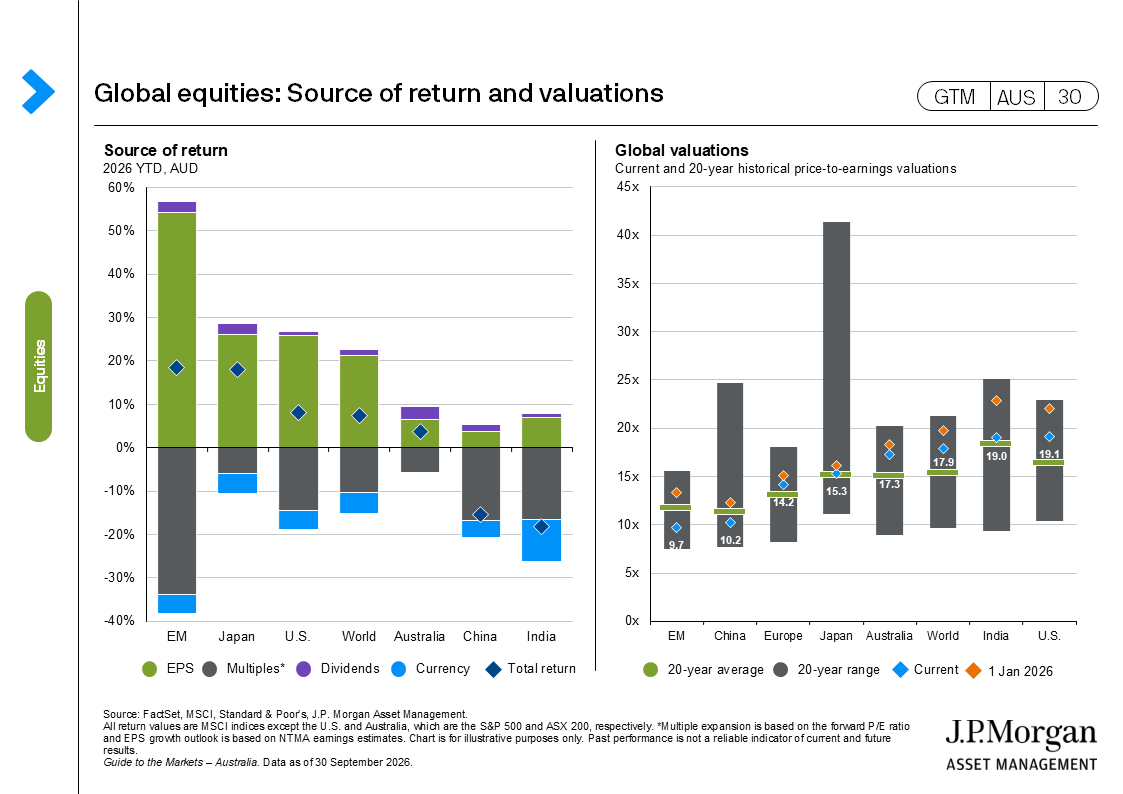
Bond markets have absorbed most of the adjustment to the central-bank outlook, while equities have held up, supported by a solid economic backdrop and resilient earnings. However, the continued de-rating of equity valuations as bond yields rise may temper future returns.
Regional divergence is becoming more pronounced. U.S. and Japanese markets, along with supply chains linked to artificial intelligence, have held up well. In contrast, Australia’s sensitivity to interest rates presents local investors with a unique set of risks.
September marked the moment when “higher for longer” became reality. This shift underscores a new investment landscape as policy rates are no longer falling, bond yields are once again central to asset allocation, and diversification is increasingly valuable. Importantly though, none of September’s events undermine the broader positive outlook for growth and earnings. While higher yields may challenge valuation multiples, they also expand the opportunity set.
The challenge for investors isn’t navigating a weaker economy, but adapting portfolios to this new environment, one that offers opportunities in bonds and presents risks to some segments of the equity market.
Global economy
- The Fed raised interest rates by 25 bps to 3.75%-4.00% at the September FOMC meeting, its first hike since July 2023, in a unanimous 12-0 vote that included Fed Chair Warsh. Fed projections showed that 16 of 18 committee anticipate at least one more 25 bps hike by year-end, with the median headline PCE inflation forecast at 3.7% for 2026 and the return to 2% inflation target not expected until 2029.
- The European Central Bank (ECB) raised its deposit rate by 25 bps to 2.50% at the September meeting, its second hike this year, driven by energy-led inflation tied to the escalating Middle East conflict. The Governing Council lifted its 2026 growth forecast to 0.9% from 0.8% and maintained its inflation projection to 3.0%. ECB President Lagarde reiterated a meeting-by-meeting approach with no pre-commitment to further tightening.
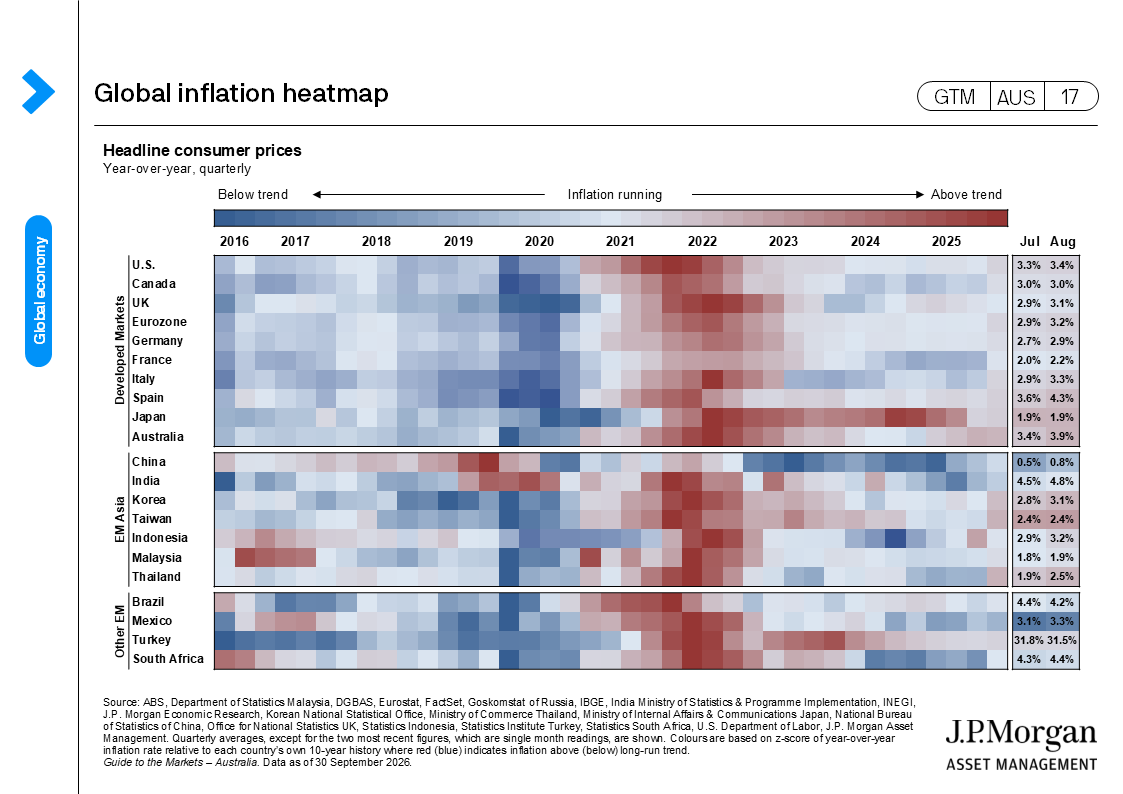
- China’s August CPI rose 0.8% y/y from 0.5% in July, while PPI accelerated to 3.8% y/y from 3.5%, both driven by elevated energy and commodity costs. Exports remained the bright spot, rising 25% y/y on strong high-tech and AI-related demand, even as underlying domestic demand remained subdued and core inflation held near 1% y/y. Policymakers responded by expanding loan-interest subsidies for consumers and small firms, and extending the maximum mortgage terms from 30 to 40 years to help stabilize the property market.
- The Bank of Japan (BoJ) raised its policy rate to a 31-year-high of 1.25% at the September meeting, in a 7-2 vote with two Takaichi-appointed board members dissenting. The split vote and lack of explicit hawkish guidance weakened the Japanese yen (JPY) to around 157.55 and fueled a rally in Japanese equities led by chip-related stocks. With few explicit signals on the pace of future tightening, markets focused on Governor Ueda’s guidance ahead of October and December meetings.
Equities
- U.S. equities delivered mixed returns in September, with the S&P 500 down 0.3% and Nasdaq up 1.9%. Despite rising yields, a hawkish Fed meeting and ongoing geopolitical uncertainty, AI remains a dominant tailwind for broad U.S. equity markets. Concerns over AI frontier model safety and potential development slowdowns were also short-lived, with markets promptly recovering on a marginal difference to AI capex plans. Among sectors, communication services and technology posted the largest gains, up 4.3% and 4.5% respectively, while all other sectors delivered negative returns in September.
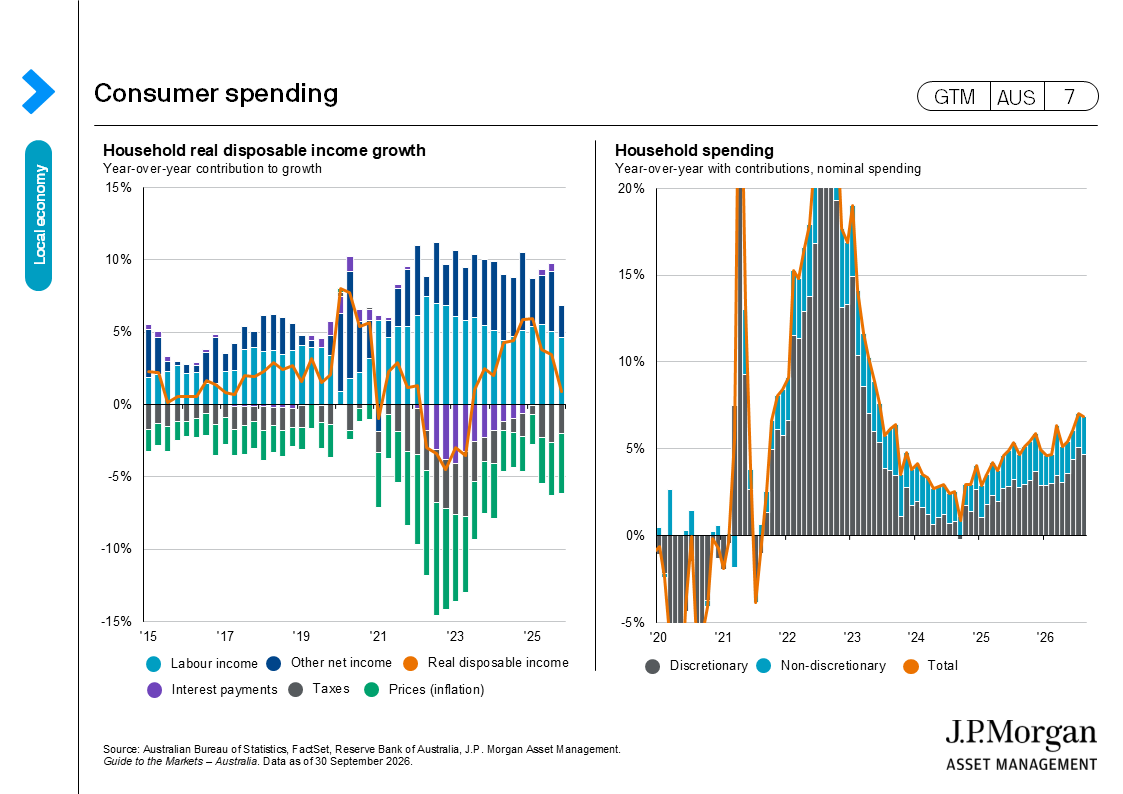
- Australian equities were volatile in September, with the ASX 200 down 3.2% as weighed on by tighter monetary policy and higher bond yields. And despite upside surprises to 2Q GDP growth on stronger-than-expected household demand, all equity sectors, except healthcare, declined over the month. Performance was also notably weaker for higher duration and rate-sensitive areas, as technology the worst performing sector.
- Chinese equities were mixed in September, with the MSCI China down 5.0% and CSI 300 down 3.6%. Subdued August economic activity continued to highlight weak domestic demand, while momentum for property market remains modest since the ‘828’ policy introduction. Semiconductor firms also followed the decline later in the month on potential resumption of U.S. chip purchases.
- Japanese equities nudged lower in September, with MSCI Japan down 0.8% and TOPIX down 1.1%. Expectation for a faster monetary tightening cycle by the Bank of Japan and a stronger currency both weighed on export-orientated sectors, in addition to higher energy prices, although AI remained a key tailwind with a rebound in related sectors by month-end.
- For the rest of Asian equity, tech-heavy markets continued to benefit on ongoing AI optimism in September, with South Korea’s KOSPI up 0.3% and Taiwan’s TAIEX up 3.9%, while other regions detracted, with India’s BSE 100 down 6.0% and MSCI AC ASEAN down 2.9%.
Fixed income
- The U.S. Treasury (UST) yield curve bear-flattened in September, with 2-year yields rising 53bps to 5.27%, while 30-year yields rose 38bps to 5.62%. This was driven by stronger activity data, firm inflation prints and hawkish Fed pricing, while renewed Middle East tensions and Brent crude above USD 105 per barrel added further pressure. Strong September PMI data reinforced the move, with most tenors climbing above 5% and the Overnight Index Swap (OIS) market pricing a 37% implied probability of a rate hike at the October FOMC meeting.
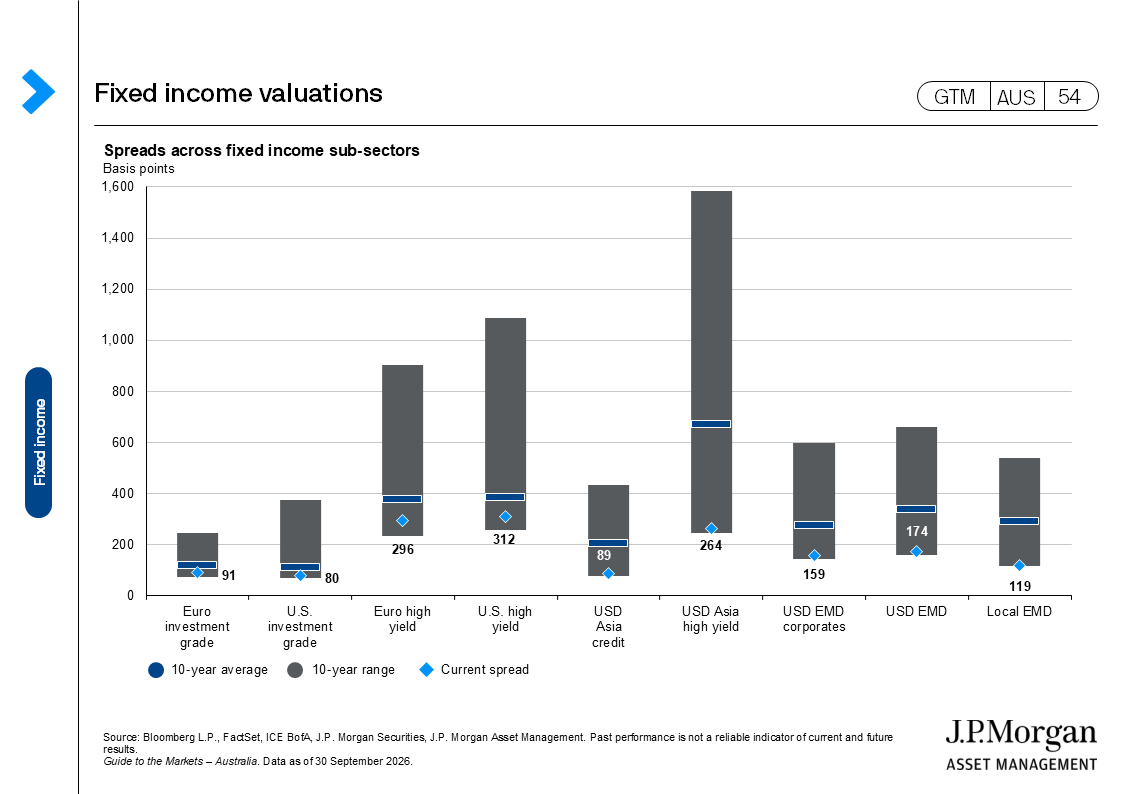
- Credit spreads remained resilient in September, despite some intra-month volatility due to geopolitical uncertainty and elevated corporate issuance. Global investment grade spreads were broadly unchanged at around 85bps, while high yield spreads widened to around 314bps as investors became more selective amid heavy supply from AI-related issuers. Nonetheless, corporate fundamentals remained supported by earnings, with spreads staying near the tighter end of their historical ranges.
Alternatives
- According to PitchBook data, the number of global private equity deals in 2Q26 is estimated to have increased to 5,672, up from 5,552 in the last quarter. Momentum on deal value stalled, however, with deal activity estimated to amount to USD 420billion in 2Q26, lower than USD 544billion in the last quarter. Exit activity in global private equity also slowed, with USD 275billion across 948 exits estimated in 2Q26, down from USD 343billion across 1,000 exits in the last quarter.
- As for the U.S. middle market, the J.P. Morgan Private Assets Index-Middle Market returned a total 11.1% on a trailing 12-month basis as of August, with revenue growth, net debt change and multiple expansion attributing to 10.5%, -2.4% and 3.1%, respectively.
- Based on the KBRA DLD Direct Lending index on a par-weighted basis, the trailing 12-month default rate excluding non-accruals rose 20 bps over August to 2.3%. Consequently, the trailing 12-month default rate including non-accruals rose to 4.1%. Yield to maturity rose by 3 bps to 9.30% as of August.
Other financial assets
- Oil prices spiked on escalating tensions in the Middle East, with Brent reaching over USD 130 per barrel mid-month. Prices later eased on the updates that Saudi Arabia is working on restoring East-West pipeline flows and markets also reraised expectations for a U.S.-Iran negotiation entering a “technical phase”, with Brent closing at USD 98 per barrel by end September. Despite volatile geopolitics, rising yields and a hawkish Fed pressured on gold, with prices declining to USD 4176 per troy ounce by month-end.
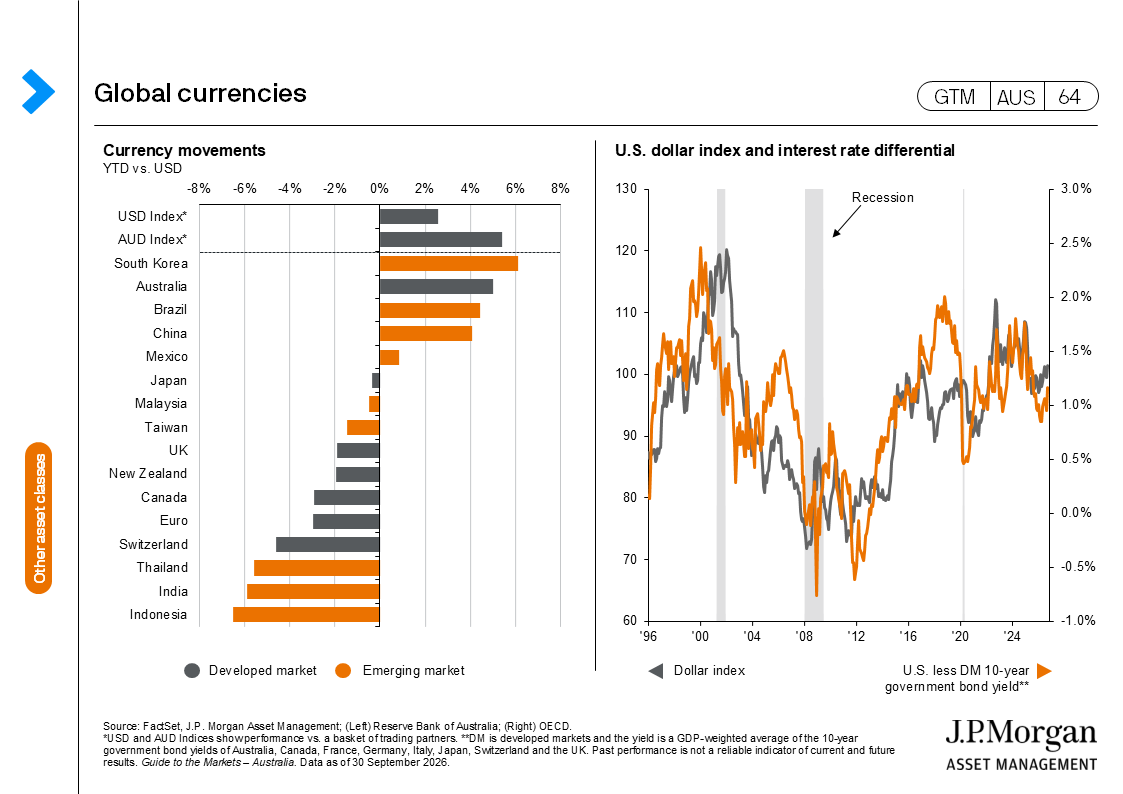
- The USD strengthened in September as markets reacted to a hawkish Fed meeting alongside elevated risk of sustained higher energy prices, with the USD index (DXY) up 2.0% over the month. OIS markets are now pricing in over three additional rate hikes by the summer of 2027. Most other DM currencies were broadly lower against the USD, with the AUD down 2.9%, the EUR down 2.2%, the GBP down 2.0%, and the CHF down 3.2%. The Japanese yen was a notable exception, which appreciated 1.6% relative to the USD as rate hikes from the Bank of Japan accelerated this month. The CNY also nudged higher by 0.2% vs the USD, as fixing continued in the direction of CNY appreciation.