Three phases update and assessment
16/08/2018
Andrew Norelli
A lot has happened since my last dispatch on the Three Phases Model. I’m asked frequently if it’s still in place and if I am still using this framework to guide positioning. In a word, yes, though unsurprisingly, markets are not evolving uniformly to one script, even a nuanced one. This week I’ll detail where I think we are in the evolution of the Three Phases, notwithstanding the continuous assault on it from the chaotic news flow.
As a quick reminder, so far this year I have characterized the shift from accommodative monetary policy to restrictive monetary policy as the single most important driver of markets for 2018, and that I envisioned this shift would unfold in three distinct phases over the course of the year. Below is a summary of how I anticipated it could happen (in a vacuum). The reality is much less clean and I’ll get to that, but in theory:
- In Phase 1, markets anticipate asset price inflation running in reverse as Quantitative Tightening (QT) takes hold in earnest, with stocks lower, credit spreads wider, rates higher in yield, volatility higher, and a stronger dollar. This is a painful period of wrong-way positive correlation between bonds and stocks, where diversification benefits disappear. Phase 1 is probably short-lived though because all five elements of financial conditions tightening simultaneously should affect (to slow down) underlying economic performance, which leads to Phase 2.
- In Phase 2, markets anticipate the impact on the economy of Phase 1’s tighter financial conditions, and begin to price in a dovish course correction from the Fed. In Phase 2, risk assets remain weak, but rates go lower in yield, resuming the traditional bond-stock correlation and accompanying diversification benefits. During Phase 2, economic data in the US ultimately shows the effects of tight financial conditions by failing to meet lofty expectations. The data isn’t weak, but it just begins to disappoint. Phase 2 price action should begin prior to the evidence showing up, and when it does show up, we’re actually closer to Phase 3.
- In Phase 3, the Fed responds to the data misses, and actively pursues some form of dovish course correction to their policy normalization framework. This is a response to the delayed impact of the actions they’ve already taken, and nothing more than a course correction. Risk rallies and Treasury rates go back higher in yield, both in relief.
- The Three Phases Model depends on three key assumptions which have been discussed at length in my blogs over the past several years. All of them are debatable in an honest way, but I believe: potential growth is slow in the US because productivity has not improved in a structural way; Quantitative Easing caused asset price inflation, so QT ought to run this process in reverse; and changes in financial conditions (the cost of raising financing of all kinds) do actually impact underlying economic performance. Cheapening funding speeds up economies, and vice versa.

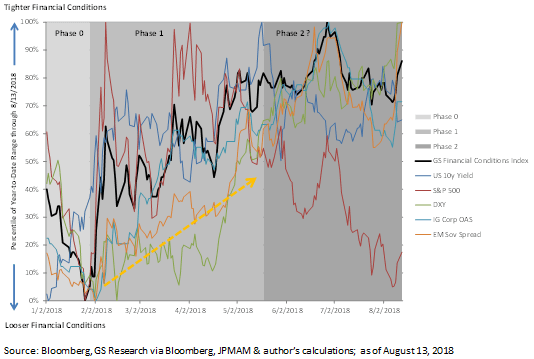
So then, in light of so many market developments which don’t appear to factor into the Three Phase Model, where are we? The chart below depicts several key variables as a percentage of their year-to-date high-low range, with the tighter financial conditions direction for each variable as higher on the chart. For the period between the peak in S&P 500 in late January (maximum looseness) until just prior to the Italy scare in late May, generally we had Phase 1-type price action across all components shaded in medium gray. It was a little noisy, but generally all lines trended higher, and the black line is the official GS Financial Conditions Index, scaled the same way. Then, when the Italy political scare happened, the correlation between bonds and stocks flipped back to what we would expect in Phase 2, right-way. So, rates went lower in yield during the acute bout of risk-off, and only when that risk-off abated did yields trend back higher, preserving Phase 2 correlation. Generally over the time period labeled as “Phase 2 ?” in dark gray, spreads and the dollar continue to trend higher while rates trend lower, and the broader Fin Con Index also trends higher/tighter. All of this is on-expectation for Phase 2. The outlier is, of course, US equities which have managed to escape my prescribed “weakness” during Phase 2. Earnings were just too good, and US economy’s intensifying outperformance versus all others globally has given strong support to US equities. Notwithstanding the equity strength, I still think we are in Phase 2, and we may be able to see further financial conditions tightening even without the participation of equity market weakness, especially if the dollar continues to strengthen. The DXY was at the year-to-date range top on August 13th, the final data point on the chart.

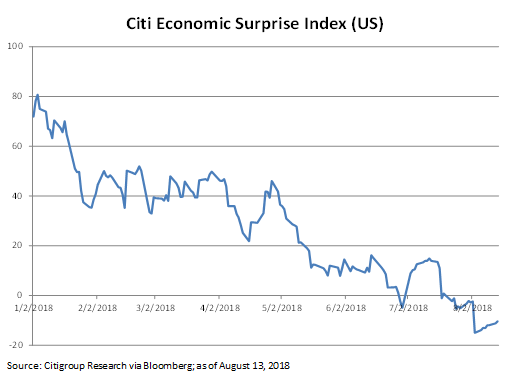
According to the way I laid out the transition from Phase 2 to Phase 3 in the model, it’s too soon to expect the broader relief rally of Phase 3, because pipeline financial conditions tightening is only modestly affecting the economic data quality. The Citi surprise index for the US recently turned negative, but only slightly:

Until it starts to affect the data materially, tighter financial conditions from here are still desirable from the Fed’s perspective, because the US economy continues to operate far above potential growth, and the economy is at or near full employment. So, I generally expect that we’ll remain in Phase 2 for some time longer.
There are some possibilities out there which could give us an early reprieve from the doldrums of Phase 2. None of them are good from a long term perspective, but again it would feel nice over the short term. First, if inflation pressure (and most importantly, the Fed’s expectation of imminent inflation pressure) is muted or weak, then that can still precipitate the dovish course correction even without further financial conditions tightening. Secondly and more provocatively, if the Trump administration via the Treasury were to take action to devalue the dollar through intervention, well that would do it. And thirdly (and most provocatively) if the president were to get more aggressive in his attempts to influence monetary policy which he’s done so far through a tweet and a CNBC interview, expect a rapid pivot to Phase 3.
Trade wars, sanctions, and the fraying of international security pacts, though they occupy a huge portion of the news flow bandwidth, are so far unrelated to the Three Phases, but I also think they are mostly unrelated to the price action I’ve described. Generally, and this is obvious by now, I believe that waning liquidity is the main cause of what we’re seeing, and it’s intentional on the part of the Fed. To the extent geopolitical noise exacerbates tightening of financial conditions, it would accelerate the move to Phase 3. The EM weakness is a separate issue, because as I suggested back in May, it’s likely a direct result of the financial conditions tightening in Phase 1 (and now Phase 2). Not so much the balance sheet unwind itself, but the combination of factors which led to tighter conditions onshore in the US, and then offshore for dollars, is especially painful for EM. Is it over? A move to Phase 3 would ease the pressure on EM. But between now and then, the factors at play which are headwinds to EM assets are still set to intensify.

