O ‘Greenium’, Where Art Thou?
The European green, social and sustainable (GSS) investment grade corporate bond market and a quantitative analysis of its ‘greenium’
18/01/2024
Bhupinder Bahra
Qiwei Zhu
The green, social and sustainable (GSS) bond market has increased rapidly over the last few years amid growing concerns about climate change and wider environmental and social issues.1 Green bond issuance continues to attract attention as a potential vehicle to help finance the transition to a low carbon economy.
GSS bonds are a type of debt instrument issued mostly by governments, supranationals, corporates and municipalities. Unlike traditional bonds, their proceeds are used by the issuer to fund a specific environmental or social project or to meet stated ESG-related goals or targets; hence the reason they are sometimes referred to as ‘use-of-proceeds’ bonds.2
GSS bonds have often traded at a premium, or a so-called ‘greenium’, to like-maturity conventional bonds, thereby providing their issuers with a cheaper source of funding for implementing GSS projects. Whether this greenium has been persistent and statistically significant through time, or if it even still exists today, is an open discussion in the literature.3 Are investors willing to accept lower bond returns from a GSS bond compared to a conventional counterpart bond from the same issuer? In this blog, we attempt to address this question by investigating if GSS bonds in the European investment grade corporate bond market actually trade at a lower spread to conventional bonds – that is, at a greenium – in the secondary markets.4
The growth of the European GSS investment grade corporate bond market
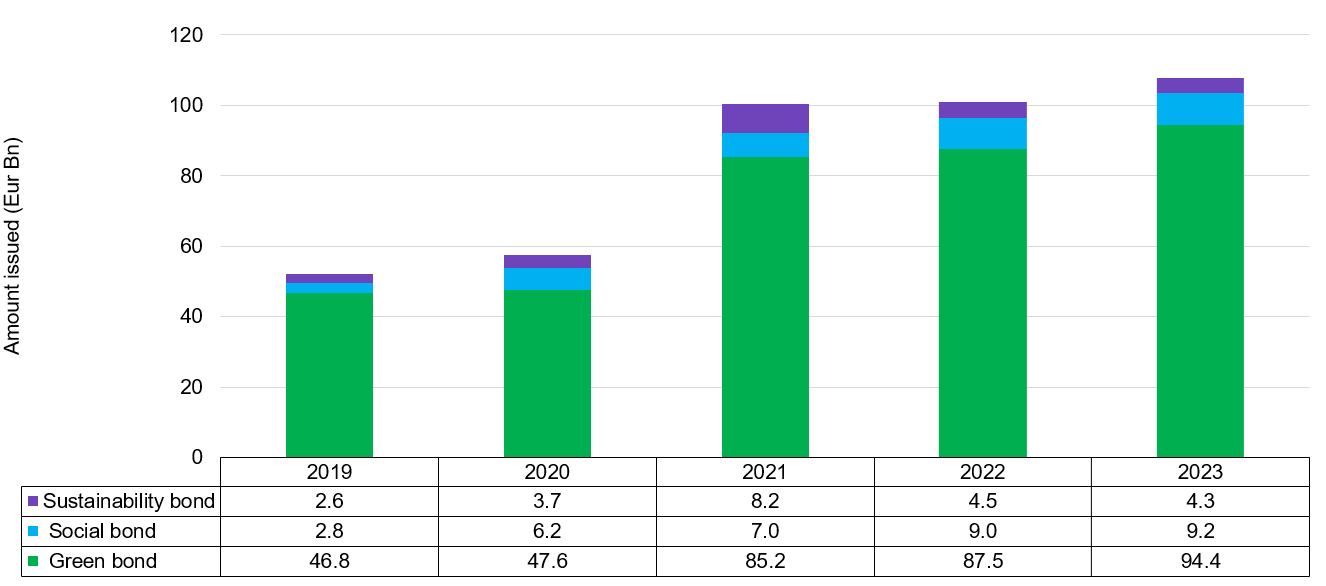
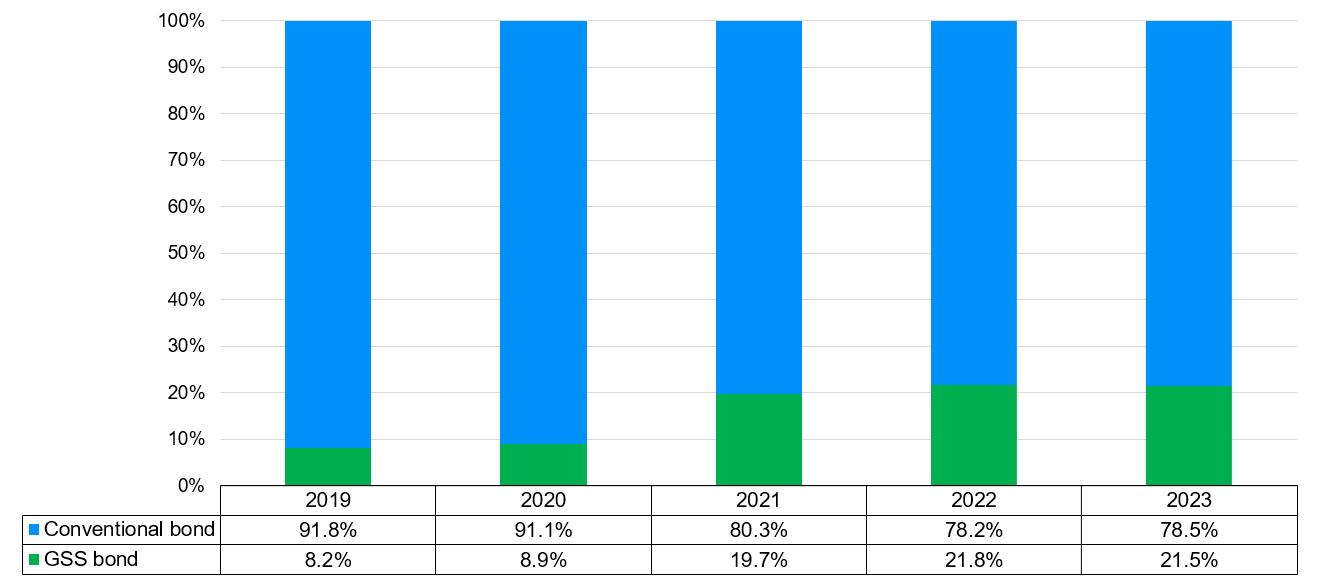
Figure 1 shows that in 2023 there was EUR 107.9 billion of GSS new issuance in the European investment grade corporate bond market – over 85% of this amount was via green bonds. In fact, GSS bonds constituted over 20% of all corporate bond new issuance in this market in 2023, representing a doubling since 2019 – see Figure 2.5
Figure 1: EUR investment grade: GSS corporate bond new issuance (Eur Bn)
Source: Bloomberg Fixed Income Indices, Bloomberg 'use-of-proceeds' flag. Data as of 29th December 2023 for historical constituents of the Bloomberg Euro-Aggregate Corporates index.
Figure 2: EUR investment grade corporate index: breakdown of new issuance
Source: Bloomberg Fixed Income Indices, Bloomberg 'use-of-proceeds' flag. Data as of 29th December 2023 for historical constituents of the Bloomberg Euro-Aggregate Corporates index.
A bottom-up method for isolating the greenium
One method for measuring and isolating the greenium is to directly compare the spreads of GSS and conventional bonds from the same issuer. We take the approach of fitting issuer curves to the spreads of all senior conventional bonds from the same issuer.6 More specifically, to account for embedded optionality in the bonds’ pricing, we use the bonds’ option-adjusted spreads (OAS) to model the issuer spread curves, applying the Nelson and Siegel parametric form to get sensible curve shapes.7
A representative fitted issuer spread curve on any given day would look like the one depicted in Figure 3, which is shown along with its +/-2 standard error regression bands.8 In this example, the issuer has three GSS bonds in issuance, represented by the green dots and all seemingly exhibiting a greenium to the fitted curve. However, only two of them have their spreads below the -2 standard error regression band. That is, only two of the three GSS bonds’ negative residuals (to the fitted issuer spread curve) are statistically significant at the 5% significance level.
Figure 3: A representative fitted issuer spread curve
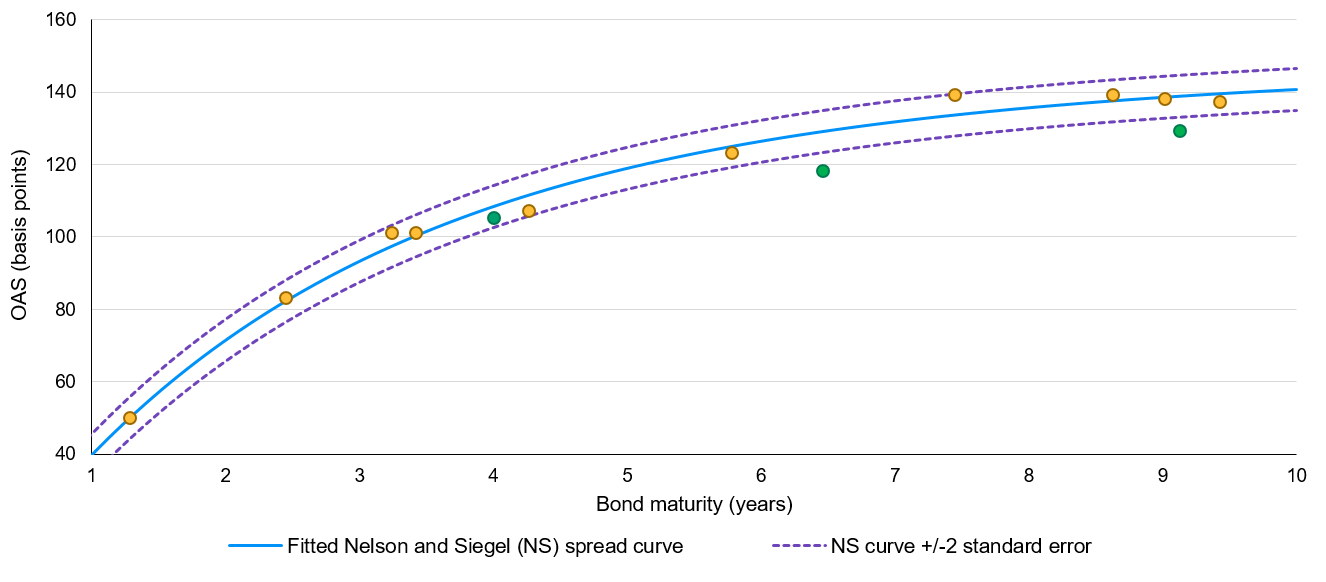
Source: Bloomberg option-adjusted spread (OAS) data as of 29th December 2023. JP Morgan Asset Management application of the Nelson and Siegel yield curve function to give a representative bond issuer spread curve. The measured greenium of each of the three green bonds shown, from left to right is 3.6, 11.2 and 9.9 basis points, respectively. Hence, the average greenium for this representative issuer is 8.2 basis points.
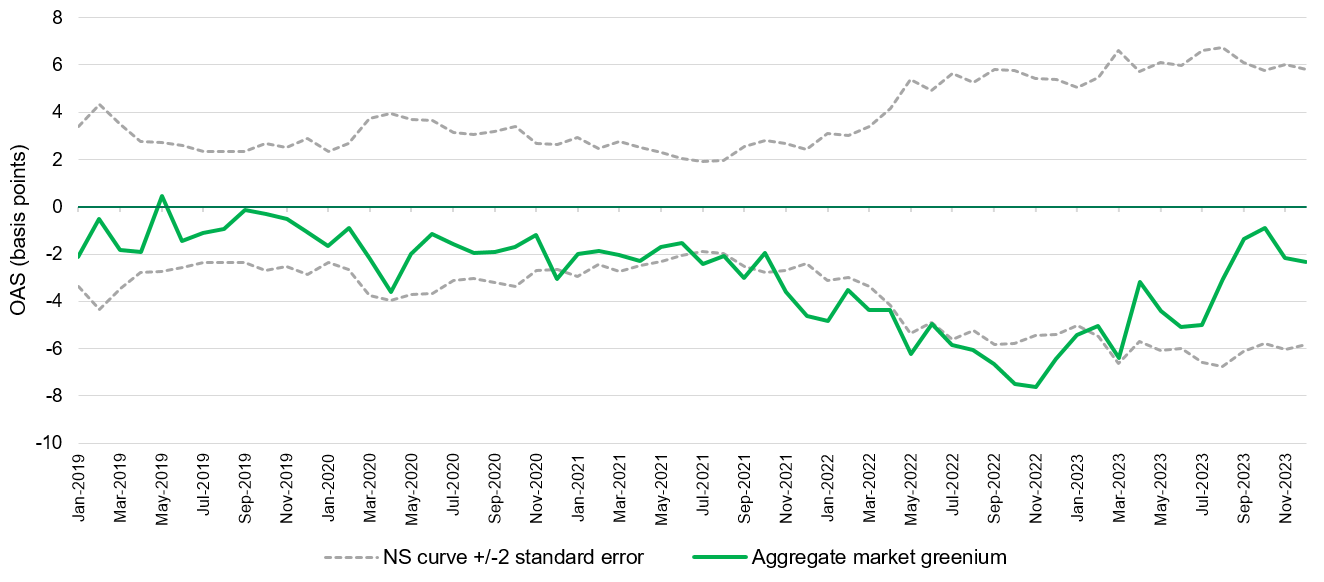
Each day, we summarise each issuer’s greenium by averaging its GSS bonds’ spreads to their respective fitted curves. We then derive an aggregate daily market greenium by further averaging the calculated issuer greeniums across all issuers. Figure 4 shows this through time, along with the average point-in-time +/-2 standard error regression bands.
Figure 4: EUR investment grade corporate index: aggregate monthly greenium
Source: Bloomberg Fixed Income Indices. Data as of 29th December 2023 for historical constituents of the Bloomberg Euro-Aggregate Corporates index. JP Morgan Asset Management application of the Nelson and Siegel yield curve function. Monthly point-in-time aggregation of the greenium to the market index level is achieved via a simple average of the underlying issuer-level calculated greeniums.
The biggest secondary market greenium was observed in 2022, ranging from 4 to 8 basis points and averaging 6 basis points over the year. By contrast, the average greenium during the last six months of 2023 was only 2.5 basis points. More importantly, over the five-year period studied, the observed secondary market greenium was statistically significant for just part of 2021 and all of 2022. More recently, not only has the secondary market greenium all but disappeared in the European investment grade corporate bond market, but it is well within its +/-2 standard error regression bands.9
Figure 5 gives a more granular snapshot of the above data, showing how the histogram of the greenium at the issuer level changed between 30th November 2022 and 29th December 2023 – the distribution has clearly shifted away from the more negative numbers.
Figure 5: Histogram of the greenium for EUR investment grade corporate bond issuers
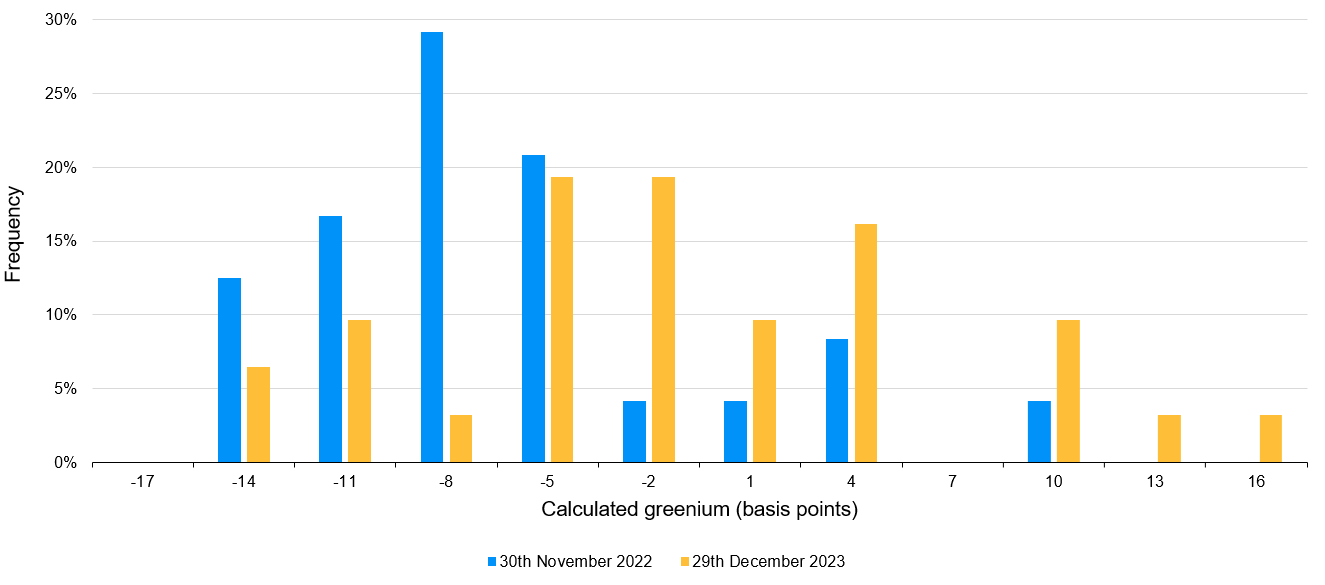
Source: Bloomberg Fixed Income Indices. Data as of 29th December 2023 for historical constituents of the Bloomberg Euro-Aggregate Corporates index. JP Morgan Asset Management application of the Nelson and Siegel yield curve function. Histogram of the calculated issuer-level greenium as at two historical dates.
Investment implications
The European corporate GSS bond market has grown rapidly over the last five years, thus attracting much attention as a potential vehicle to help finance the transition to a sustainable economy. The benefits of ‘use-of-proceeds’ bonds are clear: full transparency is available on the use of capital, with various international frameworks in place to guide reporting and disclosure by GSS issuers.10
Whilst a premium may have existed in the past for entering such investments – thereby discouraging some environmentally and socially conscious investors – this no longer seems to be the case, at least in the secondary European investment grade corporate bond market. As demonstrated in this study, the observed greenium seems to have diminished quite significantly since its peak in November 2022. Moreover, whatever greenium does currently exist in this market is no longer statistically significant. The good news for investors is that they don’t necessarily need to give up returns to make GSS investments, whilst at the same time being conducive to obtaining sustainable outcomes via targeted environmental and social projects.
1 Globally, the cumulative amount of GSS bonds issued reached USD 3.8 trillion at the end of 2022, with green and emerging market bond issuance representing 64% and 16% of the total amount, respectively – see ‘Green, social and sustainability (GSS) bonds.’ World Bank Market Update, January 2023.
2 Green bonds are bonds with proceeds earmarked for projects aimed at generating positive environmental impact, in particular across activities in renewable energy, green buildings, sustainable water or clean transport. Social bonds, on the other hand, are bonds whose proceeds are used to fund activities that achieve positive social outcomes or address a particular social issue, such as investment that targets poverty or provides access to essential services, affordable housing or healthcare. Sustainability bonds are bonds with proceeds earmarked for activities aimed at generating positive environmental and social impact, as described above.
3 On the face of it, there is no rational reason for the GSS label to influence the yield of a GSS bond. GSS bonds rank pari-passu with the conventional bonds of the same rank and issuer. The GSS bond holder does not own any additional rights on the underlying projects and is subject to the same market dynamics. So, in one sense, the existence of a greenium can be seen as somewhat of a market anomaly.
4 While the cost of funding for companies is defined by bids in the primary markets, secondary markets nevertheless have a pronounced effect on primary markets via the price and liquidity of bonds – see Bond, P., A. Edmans, and I. Goldstein (2012), ‘The real effects of financial markets.’ Annual Review of Financial Economics 4, 339-360.
5 To put these European figures into context, USD GSS investment grade corporate bond new issuance during 2023 was much lower at USD 33.9 billion, representing only 2.7% of new issuance in the US investment grade corporate bond market during the year.
6 Empirically, in order to get well-behaved issuer spread curves, we only apply the curve fitting process to bonds that have the following characteristics: (i) senior conventional EUR investment grade corporate bonds in the Bloomberg Barclays Global Aggregate Bond index, (ii) issued in the last five years, and (iii) have a maturity of under ten years. Furthermore, we only utilise issuers with at least four conventional bonds, and that have both conventional and GSS bonds in issuance.
7 The Nelson and Siegel (NS) yield curve factor model is frequently used by researchers for modelling bond yield curves. The model essentially uses three smoothing parameters to describe the shape of the yield curve. The parameters respectively describe the long-term level of interest rates, the slope and the curvature of the yield curve – see Nelson, C.R., and A.F. Siegel (1987), ‘Parsimonious modelling of yield curves.’ Journal of Business 60, 473–89.
8 The standard error of a regression measures the precision of the model’s fit – about 95% of the data points are within a range that extends from +/-2 standard errors of the regression from the fitted line. The observations outside of the +/-2 standard error band are deemed to be statistically significant at the 5% significance level.
9 This means that the greenium is no longer significant at the 5% significance level.
10 For example, refer to the GSS bond principles set out by the International Capital Markets Association (ICMA), which are designed to encourage clear alignment to sustainable projects and a full commitment to regular impact reporting by issuers.


