

Investment Grade (IG) Credit Strategy
As countries continue their vaccination rollouts and business activity rebounds further, companies have registered a gradual strengthening in corporate balance sheets in both the US and Europe.
27/01/2022
Lisa Coleman
In Brief
The steady vaccine rollout and rebound in economic growth has supported corporate fundamentals in both Europe and the US. However, there are tentative signs that the rate of improvement might slow in 2022.
The uncertainty about the new Covid variant has driven investment grade (IG) corporate spreads wider over the past weeks, as a resurgence in global infections could pose additional problems for supply chains which are already under strain from renewed pandemic-related restrictions.
Spread widening has created a greater buffer for subsequent tightening into a rate hiking cycle. So long as rates rise in a measured and orderly fashion, we see room for further spread compression as a result of improving corporate fundamentals and investors’ ongoing search for yield.
A deceleration in issuance from prior peaks will likely support US IG markets. However, European issuance is expected to be significant in 2022. This could create a technical headwind for the market particularly when the European Central Bank (ECB) begins to taper its corporate purchase programme.
Carry and security selection will remain key when it comes to adding value – we believe attractive opportunities lie in subordinated bank capital.
Corporate Fundamentals: Is the party over already?
As countries continue their vaccination rollouts and business activity rebounds further, companies have registered a gradual strengthening in corporate balance sheets in both the US and Europe. In the former, net leverage has fallen to 1.6x, its lowest level since December 2017. Meanwhile in Europe net leverage has tumbled from 2.2x in Q3 2020 to 1.7x in Q3 2021, its lowest level in nearly five years (Exhibit 1). While at first glance it might look like the party is still in full swing, there are tentative signs that it is slowing down. In the US, sectors that were only tangentially impacted by the pandemic are beginning to re-lever. In Europe, spiralling energy costs should impact company bottom lines more meaningfully in the fourth quarter. Moreover, the global acceleration of the Omicron variant poses a threat to supply chains in countries with lower vaccination rates, where governments may reinstitute short-term travel bans and shutdowns while waiting for further information about its virulence. As such, looking into 2022, investors should appreciate that the average company remains in excellent shape. However, they should temper their expectations for a rapid pace of further improvement as there are some signs that gains could be bottoming out here – the party is slowing down
Exhibit 1: Gross leverage improvement slowing down in Q3 2021
Net or gross leverage (x)
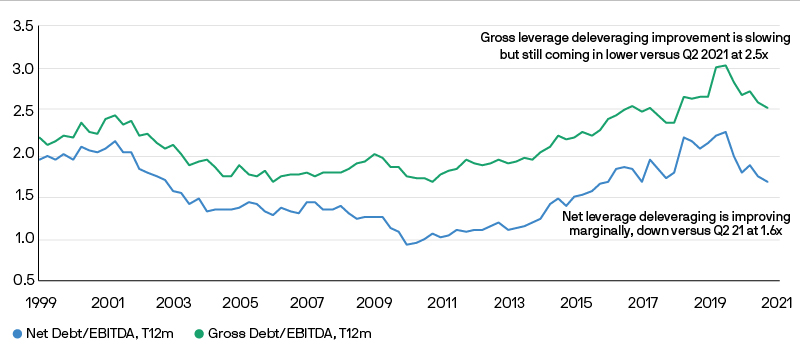
Source: JPMAM median IG industrial company, ex REITs, financials, utilities. Median data as of 9/30/2021. EBITDA = earnings before interest, taxes, depreciation and amortisation.
And what about the Fed?
We are mindful of accelerated asset purchase tapering by the Federal Reserve (the Fed), and that this opens the door for rate hikes from the second quarter of next year. What does this mean for credit spreads? The short answer is: it depends. When considering past rate hiking cycles, credit spreads and equities have tended to perform relatively well in the 12 months pre and post the first rate hike, implying that entering into a Fed hiking cycle in a steady growth environment has not been an originator of volatility in and of itself. In fact, of the seven distinct rate hiking cycles since the 1980s, spreads have tended to compress in the year before and year after the first hike (Exhibit 2). However, this does not hold true if recessionary risks rise, typically signalled by inversion of the US Treasury curve. So long as rates rise in a measured and orderly fashion, we anticipate room for some further spread compression due to solid corporate fundamentals and investors’ ongoing search for yield.
Exhibit 2: Corporate spread performance during US Investment rate hiking cycles
# of hiking cycles
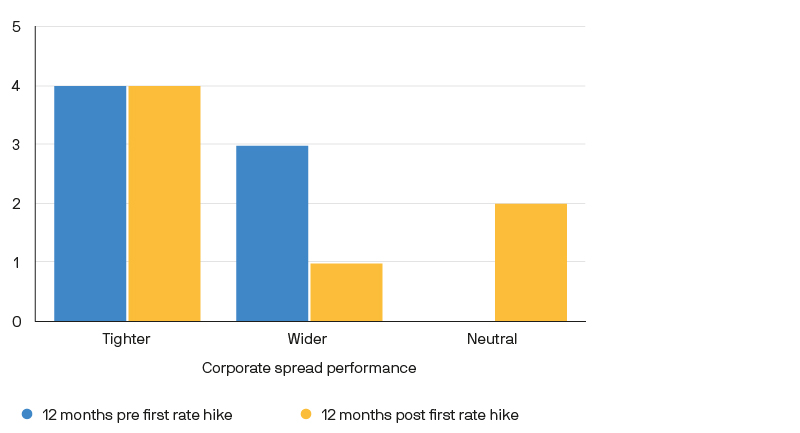
Source: JPMorgan, Barclays, Bloomberg 12/21. Spread changes are representative of the direction in points of time (i.e. 1 year before the first hike and 1yr after).
Technicals remain a mixed bag
US IG technicals have provided robust support throughout 2021. Despite the dramatic fall in bond yields witnessed since March 2020, inflows have continued into the asset class particularly from retail investors. On issuance, estimates for 2022 suggests that net supply dynamics are likely to be more favourable compared to the past two years, a potential supporting factor for the asset class. In Europe, the balance between supply and demand hangs in a delicate balance. From a supply standpoint, issuance is likely to accelerate in 2022, especially with anticipated regional M&A activity, as well as a pick-up in sustainable financing which is becoming increasingly embedded within the European IG market. Expectations are for total net supply to reach $180bn in 2022, exceeding issuance in the US, a concerning statistic considering the European IG market is approximately a third of the size of the US. The key to absorbing this elevated supply will be the ongoing asset purchase programs from the ECB. In 2021, the ECB purchased approximately 50% of overall net supply. However, monetary policy support will not be in place forever, as evidenced by the pending end to the pandemic emergency purchase programme (PEPP) next year.
Carry and security selection remain key in IG
Ongoing improvements in the economic backdrop mean that most IG sectors have recovered to their pre-pandemic level. There remains some opportunity in sectors that have lagged behind, albeit investors should be mindful of the impact of future Covid variants. Looking along the curve, we are being selective when participating in long-dated issuance. The 30-year part of the curve has been supported by strong pension flows but may be threatened in 2022 by continued Treasury curve flattening. In addition to opportunities within IG credit, there are trends developing further down the credit rating spectrum. Improving economic growth and strengthening corporate fundamentals are likely to see a number of ‘rising stars’ being upgraded from high yield to investment grade in the coming quarters. These cross-over opportunities present a valuable source of alpha for active managers who can position ahead of passive benchmarks.
A second opportunity lies in subordinated bank capital, particularly high-reset AT1 bonds i.e. those bonds with a greater coupon increase at the first call date. This continues to be one of our top trades, in spite of some underperformance over the past few months with the volatility witnessed across risk assets. Our preference for high-reset bonds is two-fold: first, extension risk is more favourable for higher back-end bonds; second, reasonable spread levels (390 basis points at the time of writing) creates cushion for spread volatility over the next six months, and indeed from any sell-off in duration. The widening that we have witnessed since the late summer created an attractive opportunity to enter the market however, since then market spreads have rallied and issuers have been able to re-finance at more attractive levels. As a result, the pool of bonds with relatively attractive structures (i.e. excluding emerging market issuers and “low reset” bonds) is now 10-15% of the market. This scarcity can make it a difficult trade to scale. Keep calm, and carry on!
09wx221201075935