Dragon soars
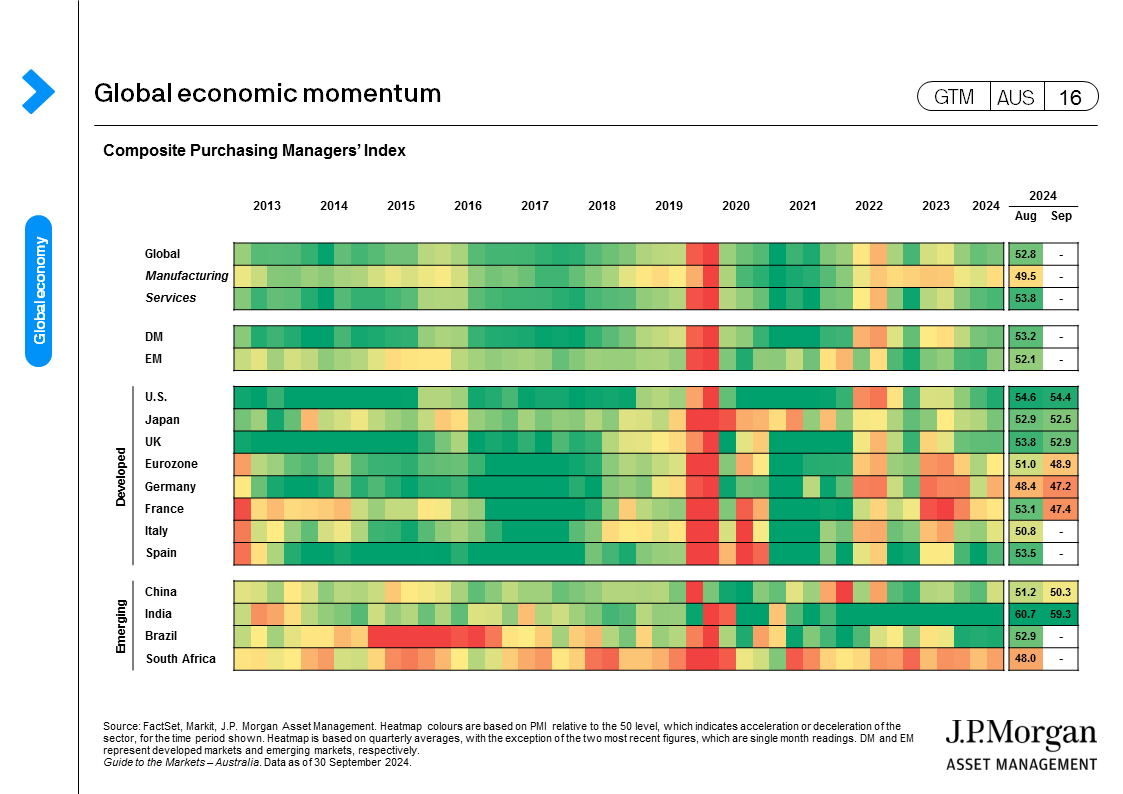
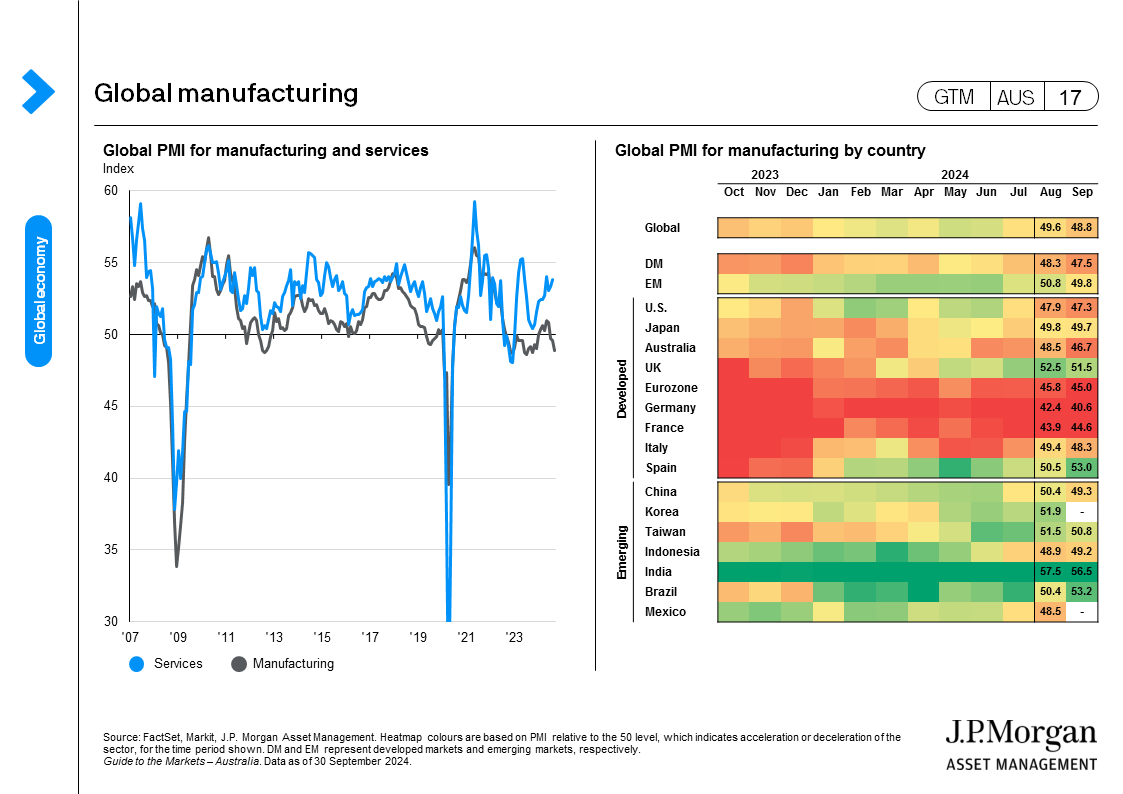
Global equities reached new all-time highs in September as the global central banks’ rate cutting cycle gained speed, and coordinated policy announcements in China generated a surge in Chinese equities. Both the U.S. and China have shifted decisively towards supporting growth. The MSCI AC World rose 2.0% on the month. Developed market stocks gained 1.5%, lagging the 5.6% return in emerging markets and the 21% from China’s CSI 300. Easing policy led to falling yields and a positive return in bond markets. The Bloomberg Global Aggregate was 1.7% higher over the month.
September was not all plain sailing as firmer inflation data and moderating labor data in the U.S. challenged the view on the U.S. Federal Reserve (Fed) policy easing. However, the Fed delivered a larger cut at its September meeting and signalled 250 basis points (bps) of rate cuts through 2026. The debate is now around the pace and magnitude of these cuts rather than the overall policy stance. The Fed dot plot should be taken with a grain of salt given the uncertainty in the longer-term prospects of the global and U.S. economies. The Fed's short-term focus is hard to argue against given the rapidly changing economic landscape. However, this could also be a source of volatility as investors constantly adjust their expectations of the Fed’s reaction to growth and inflation.
Treasury yields had already declined well ahead of the start of the rate cuts in the U.S., but the yield curve continues to steepen. Longer dated bond yields may be relatively range bound given the supportive growth outlook, while the short-end reacts to further policy easing. As such, duration positioning remains neutral. Given the well-known geopolitical risks, bond markets could provide a cushion against potential growth shocks.
The coordinated action from Chinese policy makers surprised the market late in the month and fuelled a substantial rally in the equity market. While the policy announcements were not dissimilar to those made in the past two years, the breadth of the announcement and the expected accompanying fiscal support demonstrated a renewed sense of urgency to counter deflationary pressures in the economy. More importantly, the measures see a shift from supply-side policy support to demand-driven growth. The longevity of the rally will depend on the forthcoming fiscal package meeting market expectations, as well as a turn in the economy that supports improving earnings outlook.
The global policy easing cycle should underpin risk sentiment, creating an opportunity to broaden global equity allocations and into the extended sectors of the bond market. Nonetheless, core developed market government bonds could help provide additional portfolio stability in case of unexpected deterioration in economic growth momentum.
Australian economy:
- There was nothing new from the Reserve Bank of Australia (RBA) at its September meeting, as the cash rate was left at 4.35%. Compared to other central banks, the RBA is viewed as hawkish and continues to push back against market pricing of rate cuts in 2024. However, unlike in past meetings, the RBA did not discuss the need for a rate hike, which suggests the mood may be changing.
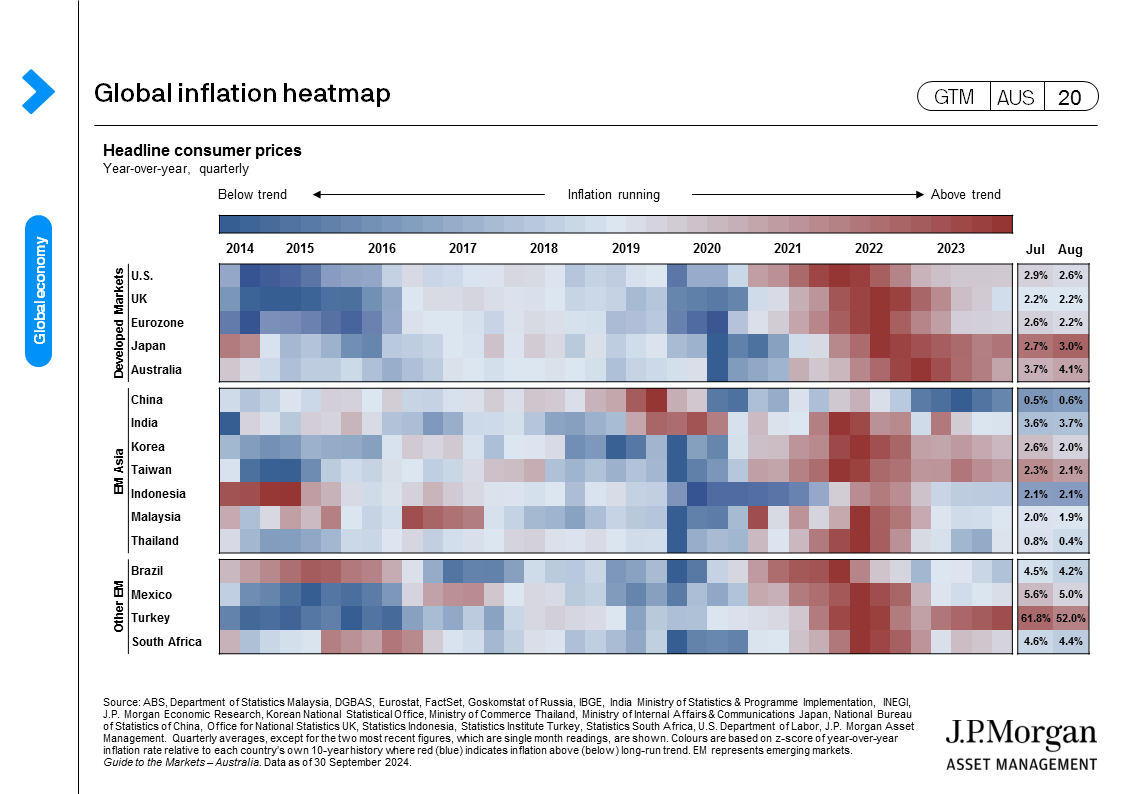
- The August monthly consumer price index (CPI) report was in line with expectations, and the headline rate fell from 3.5% year-over-year (y/y) to 2.7% y/y, illustrating the impact of government subsidies on lowering energy costs. However, these are distorting effects to the overall still slow-moving inflation trend, which is keeping the RBA on hold.
(GTM AUS page 5) - It was more of the same from the August labor market report, given the still strong employment gains (48,000 jobs) was matched with high participation rate, leaving the unemployment rate unchanged at 4.2.
(GTM AUS page 9) - Consumer and business surveys for August continued the weak trend. The relationship between consumer confidence and economic activity can be tenuous at times, but weakness highlights the pessimism across the household sector. Both measures of confidence and conditions slipped in August, suggesting soft economic activity and a bias towards softer jobs growth.
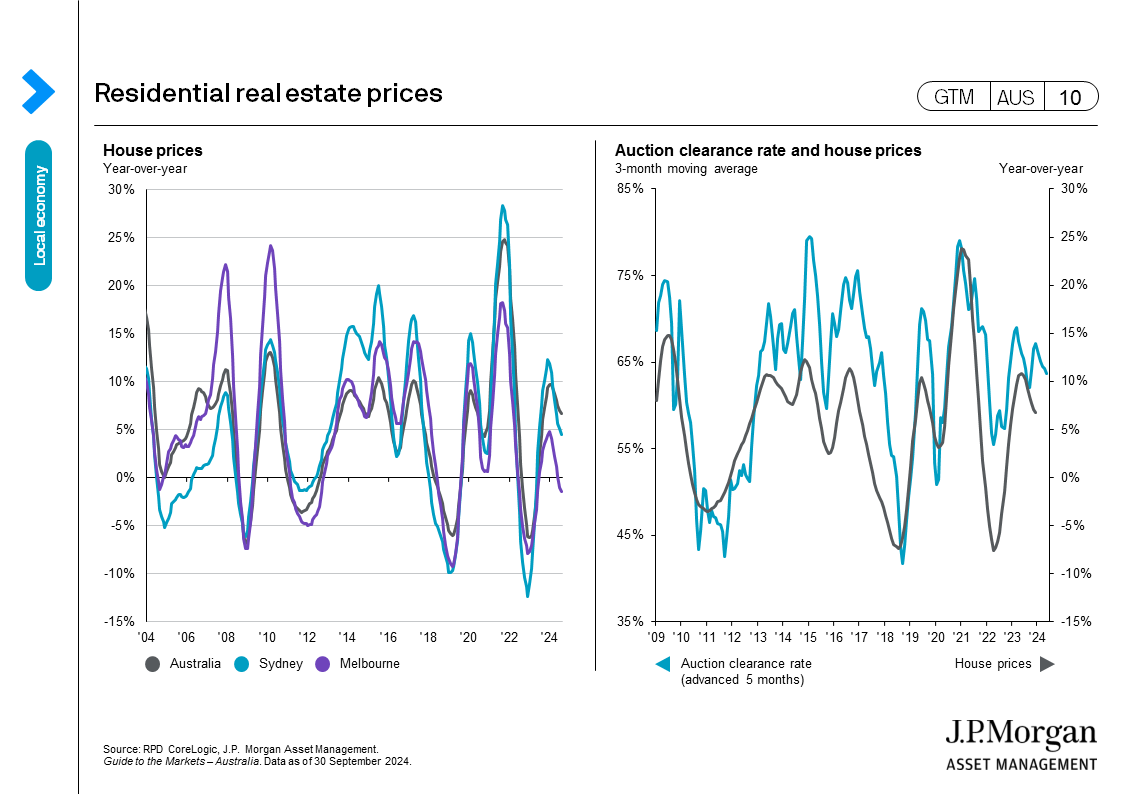
(GTM AUS page 6) - Capital city house prices increased 0.5% month-over-month (m/m), and y/y price growth eased to 6.7%. The monthly price growth was driven by Perth (1.6%), Brisbane (0.9%) and Adelaide (1.3%), given the softness in Sydney (0.2%) and Melbourne (-0.1%). Auction clearance rates are in the mid-60% range and have been falling since the start of the year.
(GTM AUS page 10)
Equities:
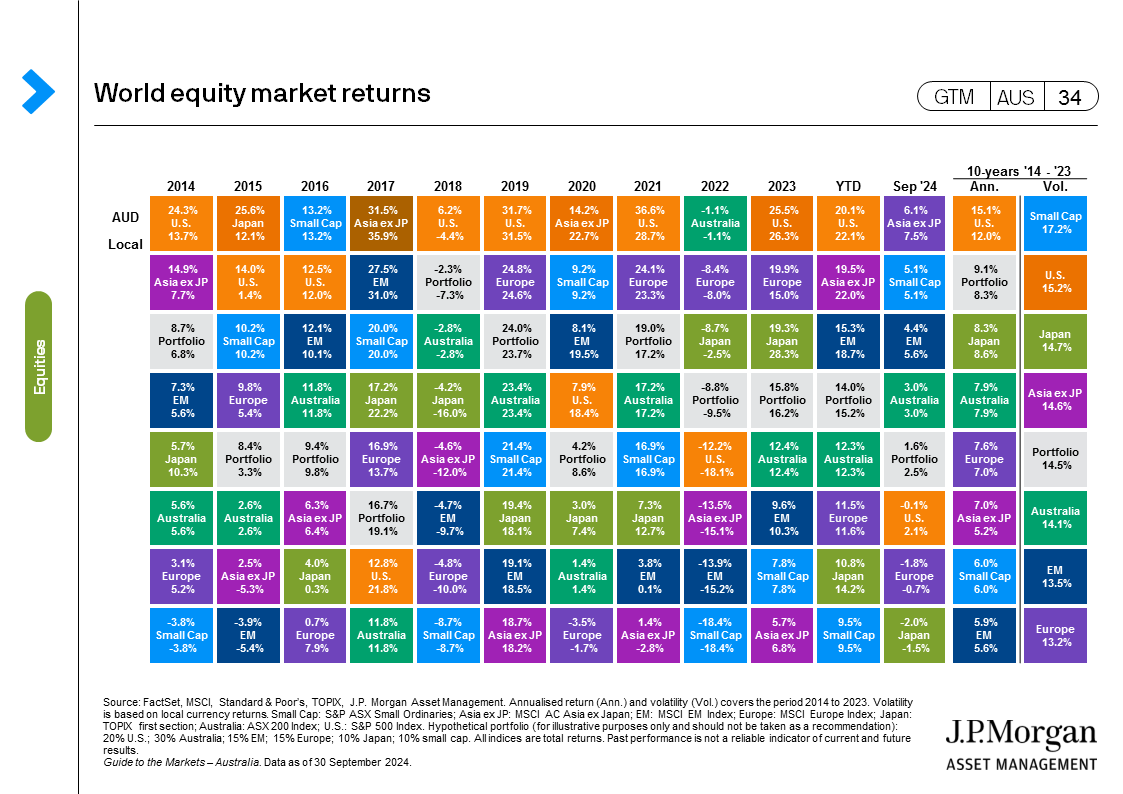
- The ASX 200 gained 3.0% in September, beating many major developed markets, as the U.S. gained 2.1%, while Europe fell 0.7% and Japan lost 1.5% over the month. Australia was an indirect beneficiary of the late month stimulus package from China. Meanwhile, economic data in the Eurozone continues to be soft, and rising rate expectations and a stronger Japanese yen (JPY) created a headwind to Japanese equity returns.
(GTM AUS page 34) - The implications of fiscal support in China showed up in the 13% return in the materials sector over September. However, real estate (6.6%) and information technology (7.4%) also recorded strong monthly performance. The rotation towards more cyclical sectors came at the expense of health care (-3.2%) and consumer staples (-1.7%) (all total returns in local currency).
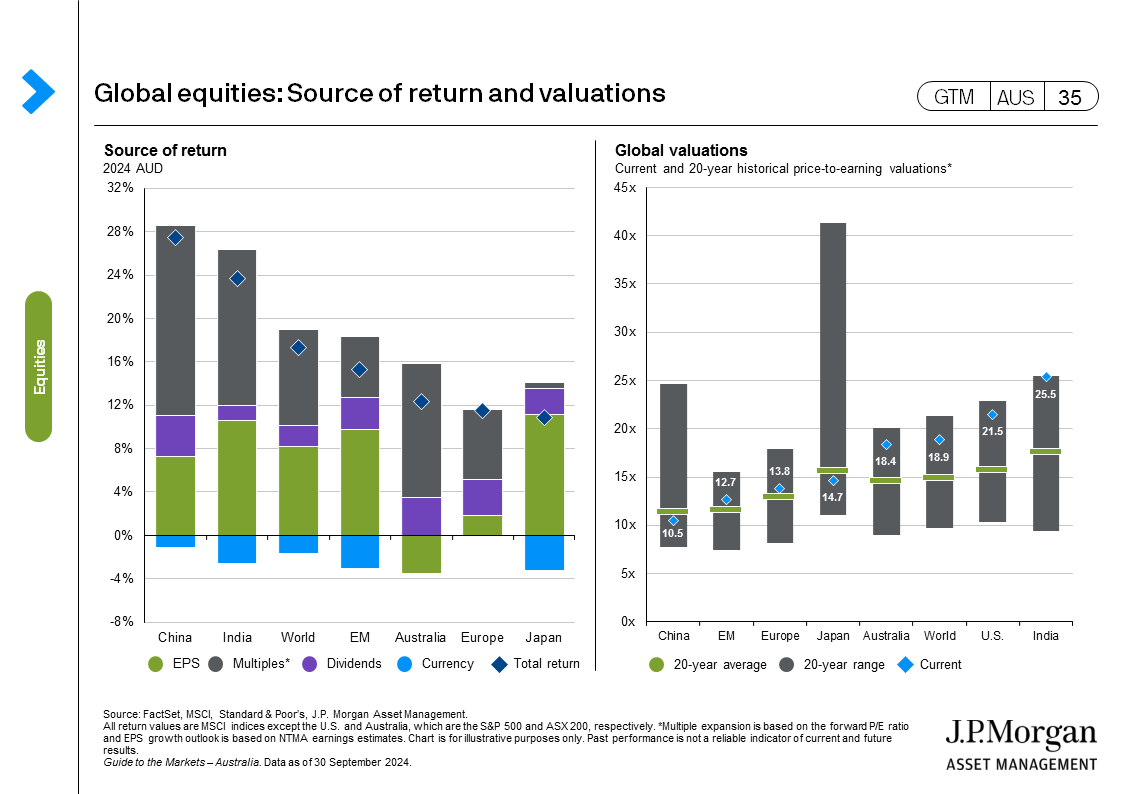
- Valuations grind here and the 18.4x forward price-to-earnings (P/E ratio) on the ASX 200 is nearing two standard deviations from its long-run average. The index valuation is fueled by the rise in bank valuations and expectations for a rebound in 2025 earnings growth. The U.S. is also looking fully valued at 21.6x, but in a soft-landing environment, there is little to suggest a de-rating of equities, but rather an onus on earnings growth to live up to expectations.
(GTM AUS page 35)
Fixed income:
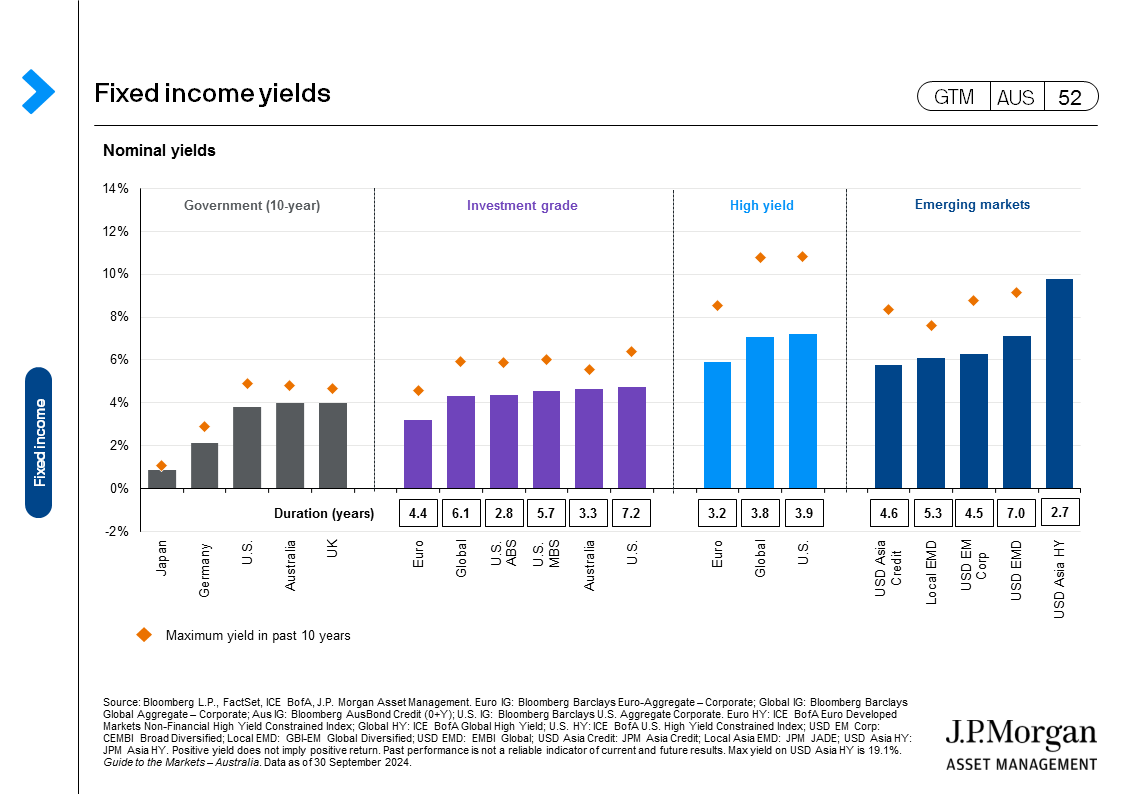
- Australian government bond yields round tripped on the month ending September, and the 10-year bond yield was 3.97%, 1 bps from where it started the month. There were bigger moves in the U.S. as the 2-year U.S. Treasury yield fell 28 bps to 3.64% and the 10-year fell 13 bps to 3.79%, leading to a 14 bps steepening in the yield curve.
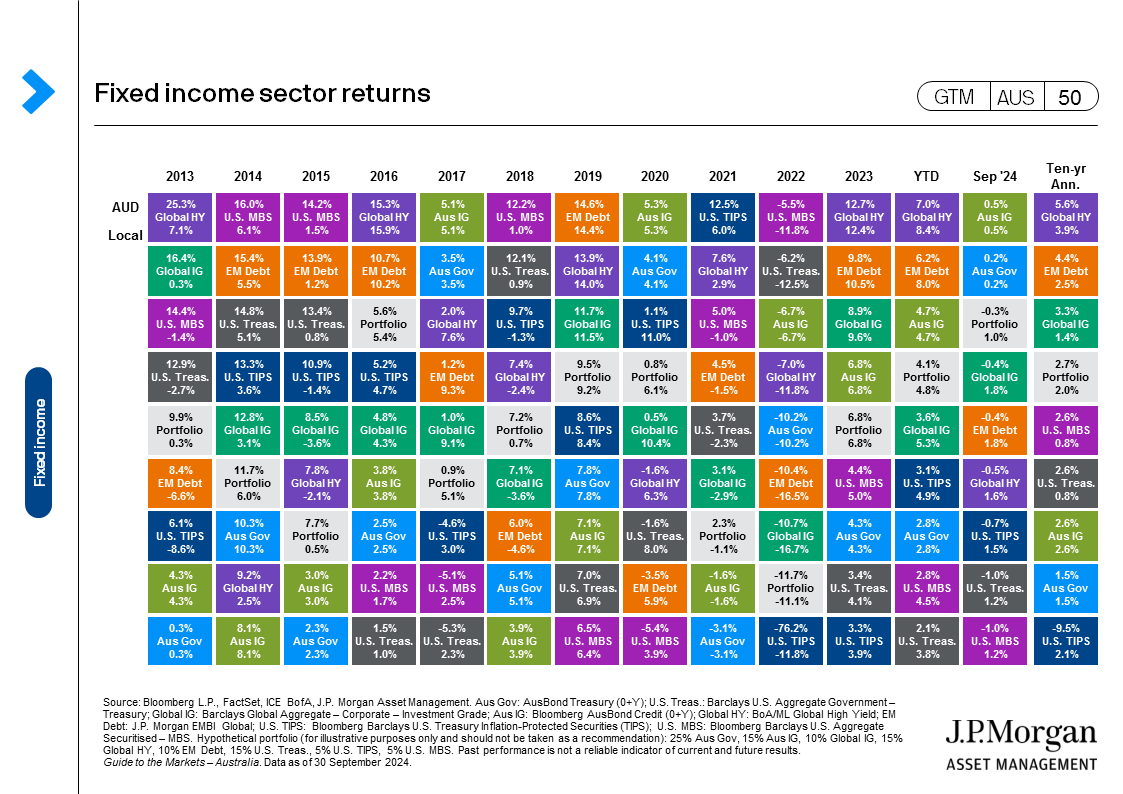
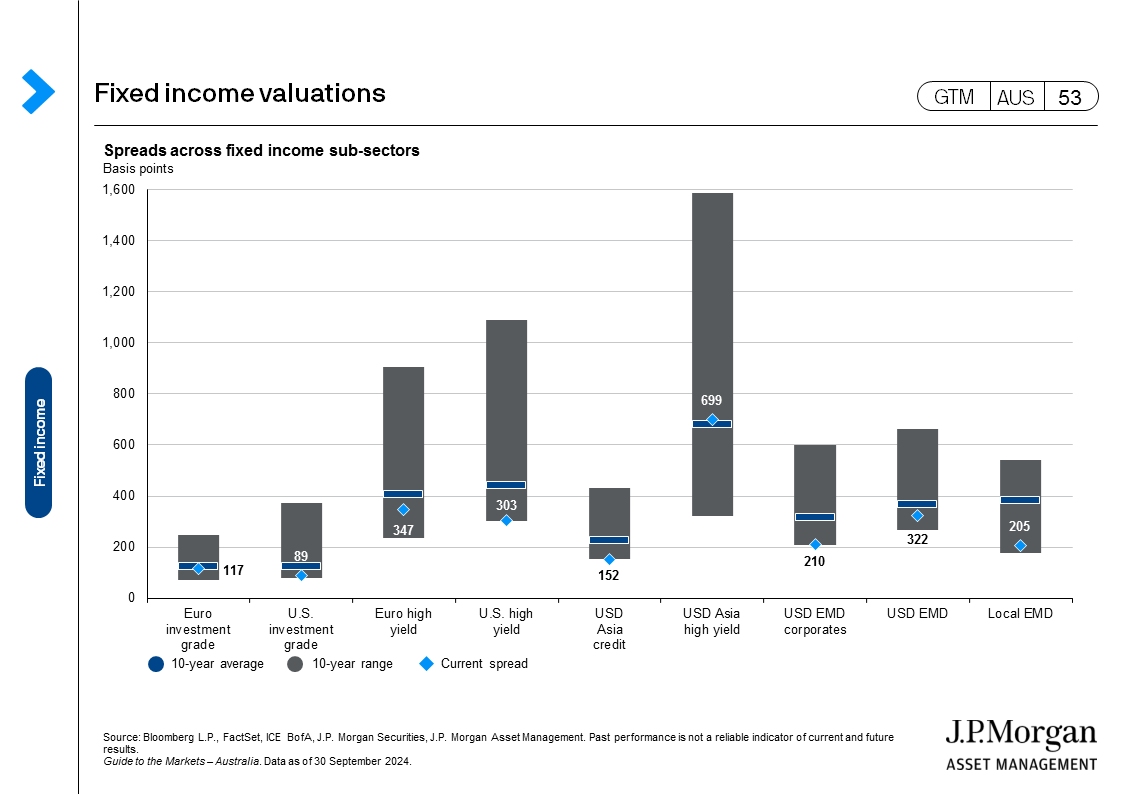
(GTM AUS page 50) - Credit market returns remain in positive territory as the U.S. HY delivered a 1.6% return and the IG 1.8%, as spreads tightened further. The combination of policy cuts in the U.S. and a weaker U.S. dollar is easing financial conditions in the emerging world, creating a better performance in emerging market (EM) debt. EM dollar denominated sovereign bonds are 8% higher this year as are EM corporate bonds.
(GTM AUS page 52)
Other assets:
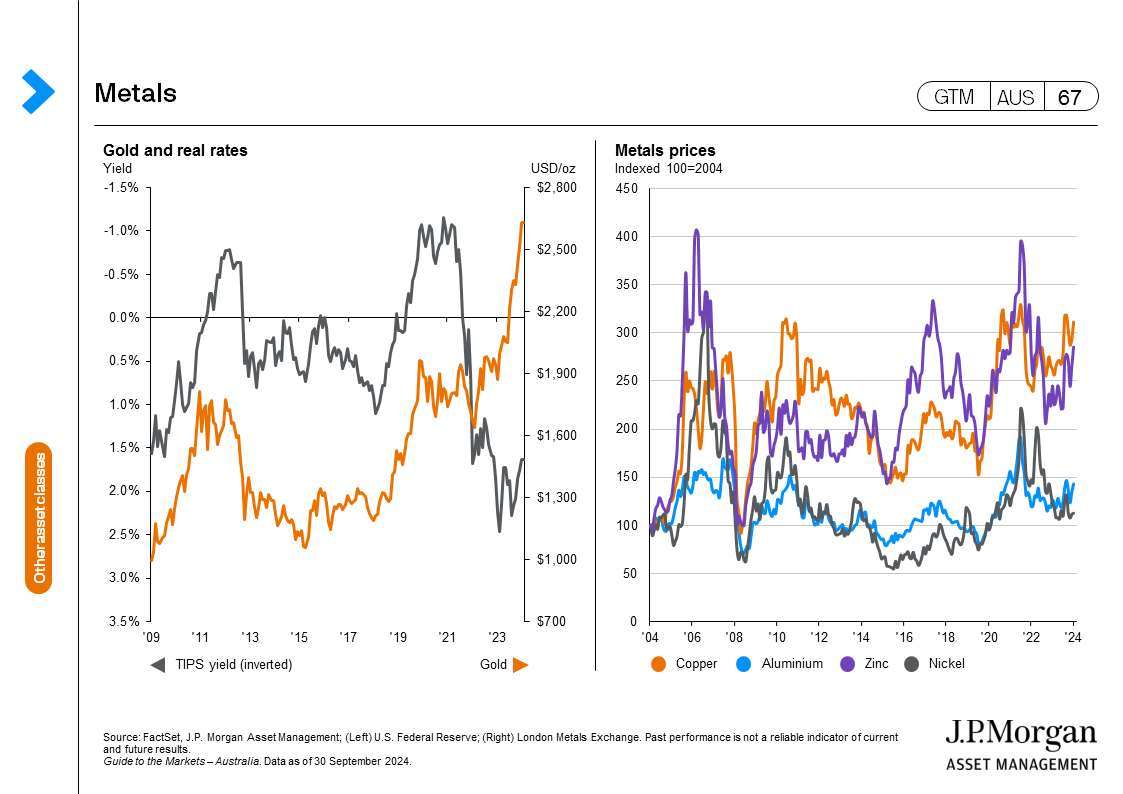
- The Bloomberg Commodities index was 1.3% higher over the month, supported by rising natural gas and metal prices. Natural gas prices were 37% higher in September, rising on expectations of both increased demand and weather disrupted supply in the U.S.
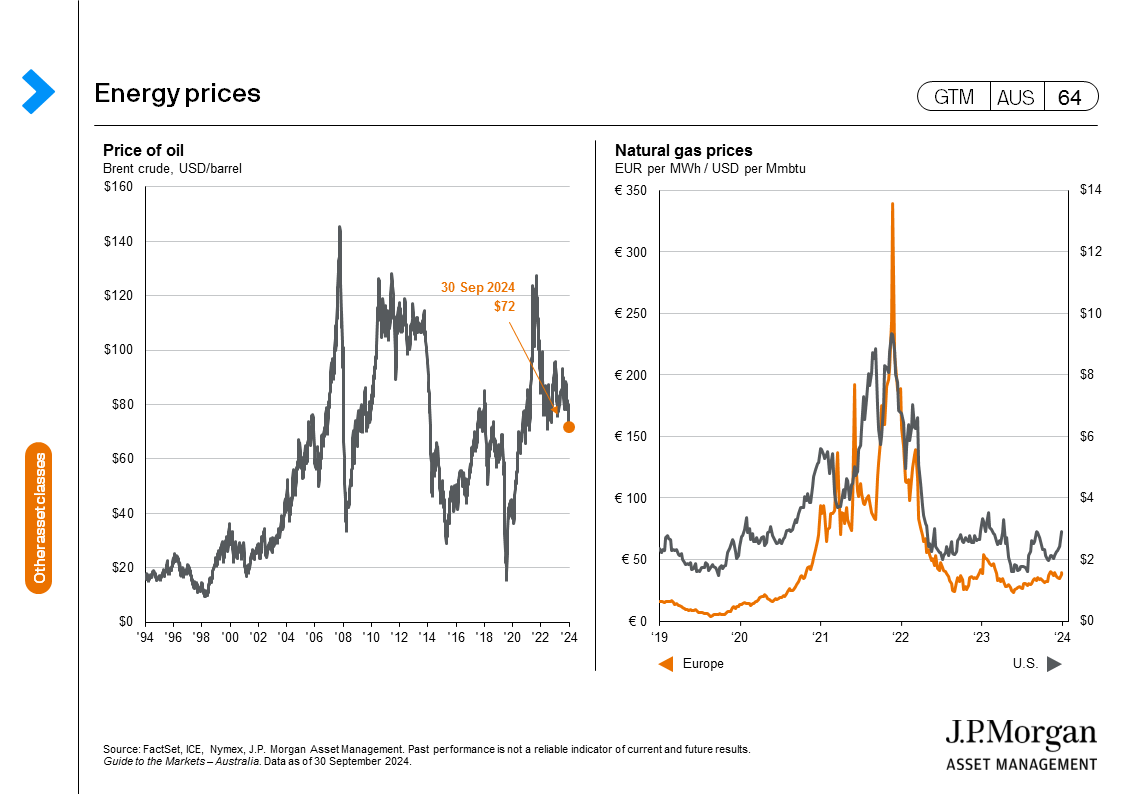
- The oil price was meaningfully lower over September and Brent crude ended the month down 9.8% to USD 72 a barrel. Expectations of soft global demand and possibly increased supply from Saudi Arabia weighed on prices. The conflict in the Middle East could see a risk premium creep back into oil prices, but the ample supply should mitigate very large price rises.
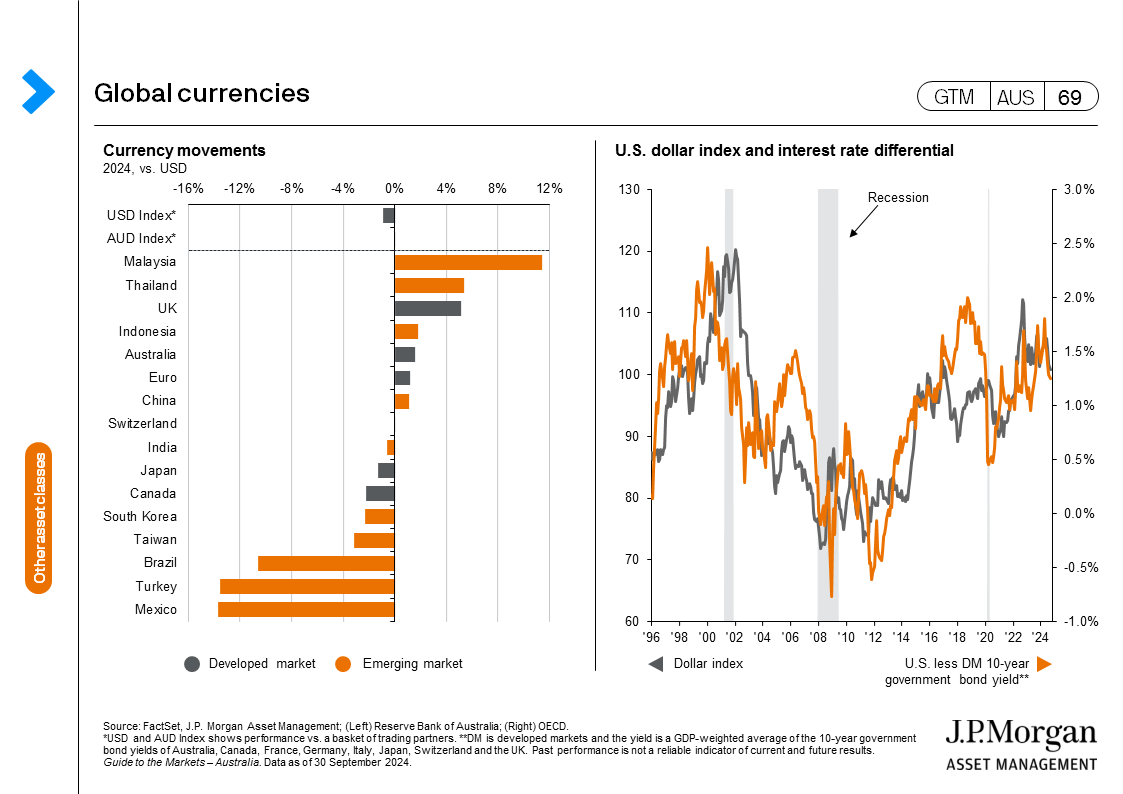
(GTM AUS page 64) - The larger rate cut by the Fed and expectations of another 50 bps of cuts this year led to a 0.9% fall in the broad US dollar index. The softer USD and firm stance of the RBA supported the Australian dollar to the tune of 1.3%. The JPY strengthened over the month by 1.8% against the greenback and appreciated by 11.1% for the quarter.
(GTM AUS page 69)
 |
0903c02a82674e7f


