


Despite the many challenges in 2025, the S&P 500 index still notched multiple all-time highs. While uncertainty remains elevated, earnings beat, fiscal stimulus and rate cuts may keep US stocks attractive. However, active management will be crucial to navigate the changing outlook and tap into quality opportunities amid elevated valuations.
Highway or headwind?
US stock market resilience was in full view in 2025, with the S&P 500 index sidestepping concerns such as tariffs, geopolitical tensions and a slowing economy, to notch multiple record highs. In the first seven months of 2025, the S&P 500 rose 7.8%, with the index surpassing the peak set before “Liberation Day,” when the Trump administration announced sweeping tariffs1. In the year ending 31.07.2025, the index recorded 15 all-time highs, accounting for 10.4% of the total number of trading days, 10 of which occurred in July alone1.
In the face of market peaks, investors who stayed on the sidelines may be regretting the missed opportunity, while others may question if the rally can be sustained or if a significant pullback is in the cards.
Managing the fear of heights
From the outset, all-time highs or market peaks may not present meaningful information as it relates to the optimal timing of investments. As illustrated below, there is no significant difference between investing at all-time highs and investing on any given day.
Indeed, historical data seem to challenge conventional wisdom that has typically persuaded investors to avoid investing in US stocks at record highs. Over the long run, there may be no apparent advantage or disadvantage from investing at all-time highs versus any other time.
Challenging conventional wisdom, investing at all-time highs has historically led to higher relative performance, not lower.
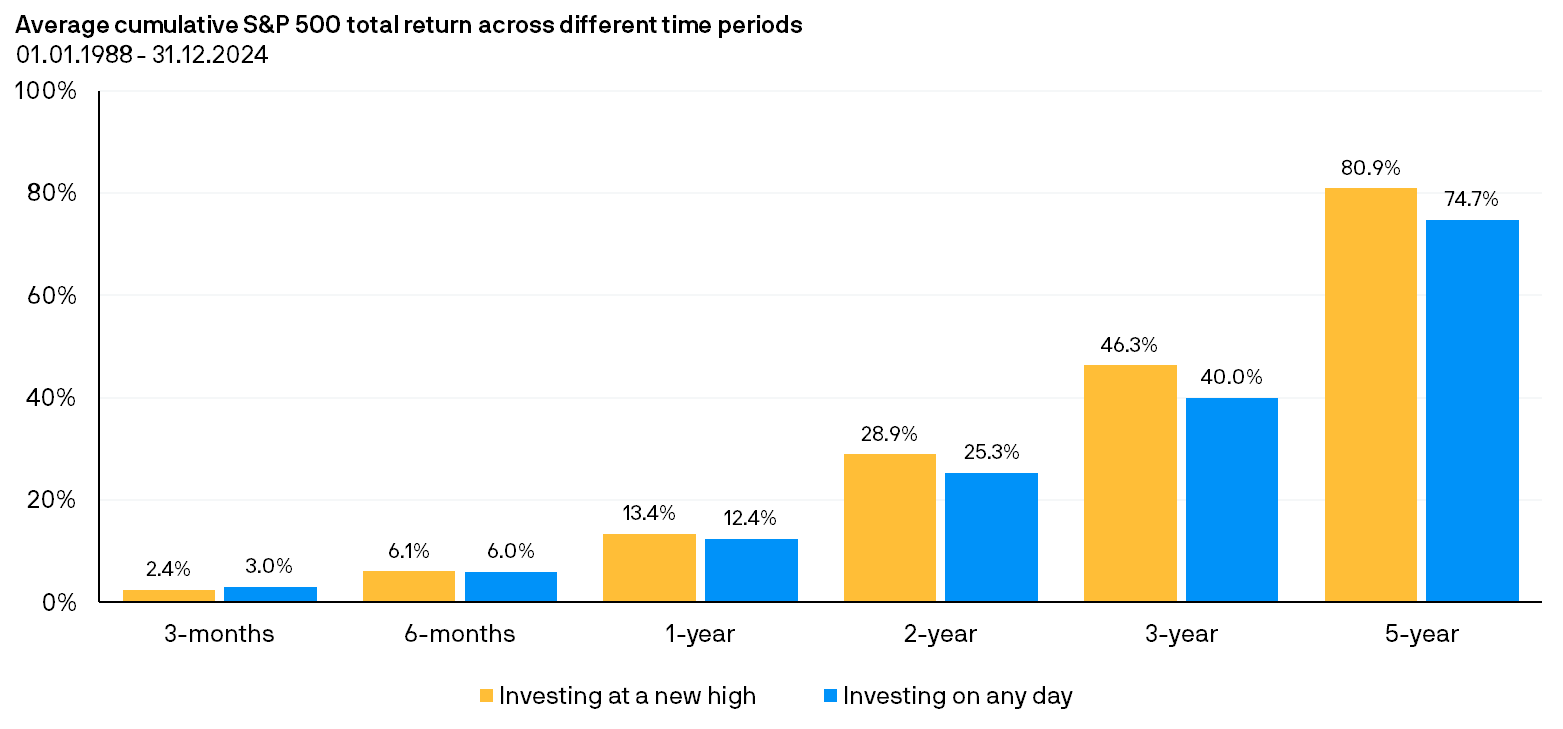
Source: FactSet, Standard & Poor’s, J.P. Morgan Asset Management. Data are as of 30.06.2025. “Investing on any day” represents average of forward returns for the entire time period whereas “Investing at a new high” represents average of rolling forward returns calculated from each new S&P 500 high for the subsequent 3-month, 6-month, 1-year, 2-year, 3-year and 5-year intervals, with data starting 01.01.1988 through 31.12.2024. Indices do not include fees or operating expenses and are not available for actual investment. Past performance is not a reliable indicator of current and future results.
Furthermore, all-time highs are not a ceiling, in the sense that they do not necessarily portend a potentially significant correction later. Put differently, stocks may still rise after hitting record highs. As illustrated below, since 1950 to June 2025, the S&P 500 index had recorded all-time highs in about 6.7% of trading days, and around 29.2% of these peaks had turned into new market “floors,” becoming a launchpad for the future growth of the index.
Over the long-run, strength tends to beget more market strength.
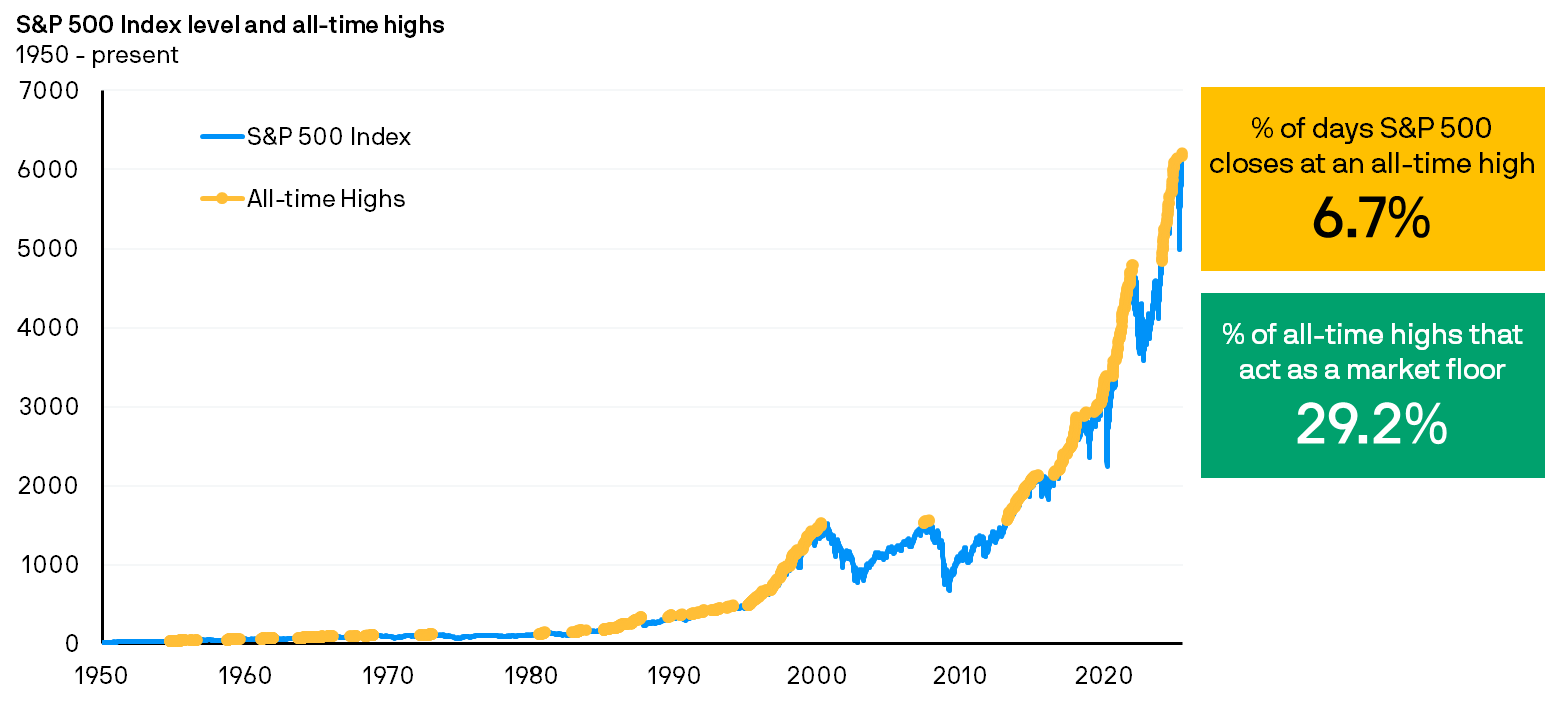
Source: Bloomberg, J.P. Morgan Asset Management. Data are as of 30.06.2025. Market floor is defined as an all-time high from which the market never fell more than 5%. Indices do not include fees or operating expenses and are not available for actual investment.
Taken together, these observations suggest that all-time highs are an imperfect signal or barometer for the optimal timing of one’s market entry. More generally, it implies that the level of the index alone may not present much useful information about the ideal timing of investments or asset allocation. In which case, it would be more prudent to assess other factors such as earnings and valuations that tend to significantly drive market performance.
Earnings are supportive but valuations call for selectivity
So far, earnings continue to paint a relatively resilient picture for US equities. Of the S&P 500 companies that reported second quarter earnings, 81% and 79% had exceeded earnings and revenue estimates respectively2. While this was after consensus estimates were cut post the “Liberation Day” tariffs, the magnitude of positive earnings and revenue surprises were still above the past 10-year averages2.
This trend is expected to continue. As illustrated below, the 2025 consensus analyst projections for year-on-year earnings-per-share (EPS) growth for the S&P 500 index stands at 9.0%, exceeding the past two-decade average of 7.6%3. Analysts are also pencilling in double digit growth in 2026 and 2027, with earnings projected to broaden thereby narrowing the gap between the 10 largest companies and the remaining 490 names within the index4. In addition, year-to-date (as of 31.07.2025) sector performance has extended well beyond mega-cap tech names, with industrials, utilities and financials posting meaningful gains5.
Earnings continue to paint a constructive picture for US stocks, with consensus expectations pencilling in double-digit growth in 2026 and 2027.
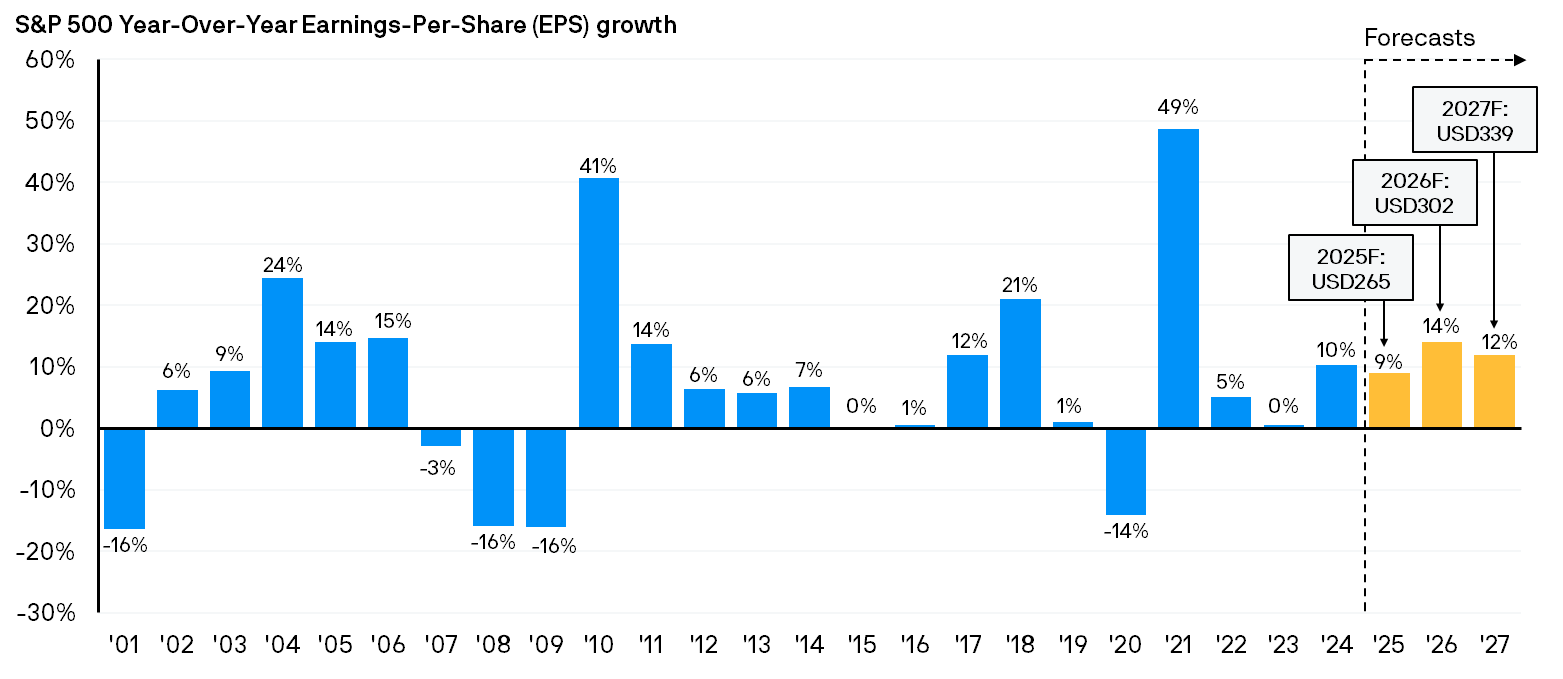
Source: Compustat, FactSet, Standard & Poor’s, J.P. Morgan Asset Management. Data as of 31.07.2025. Historical EPS values are based on annual earnings per share. F: Forecast. Forecasts for 2025, 2026 and 2027 reflect consensus analyst expectations, provided by FactSet. Forecasts/ Estimates may or may not come to pass. Past performance is not indicative of future returns.
Nevertheless, with price-to-earnings valuations of the S&P 500 index close to its past 15-year peaks6, active stock selection remains crucial to seek exposure to attractively valued or mispriced opportunities in the US market.
The glass half full
Looking forward, the macro backdrop continues to remain uncertain. As it stands, the true impacts of tariffs on the economy and profit margins are yet unclear. Volatility is likely par for the course with sentiment swinging between optimism about artificial intelligence (AI) and concerns about tariffs. Relatively elevated valuations also implies a narrower margin for error, with short-term pullbacks likely should policy risks emerge or if earnings miss expectations.
Yet, against this backdrop, it is still important for long-term investors to keep a few potential tailwinds in perspective:
- First, US trade policy uncertainty have eased meaningfully post “Liberation Day,” following several trade deals that have been established with major trading partners. That’s not to say we are in the clear, but at least some of the worst-case scenarios have largely been avoided in our view, with the final tariff rates down to more moderate or manageable levels, while others are still being negotiated.
- Second, on a micro level, the passage of the “One Big Beautiful Bill Act” (OBBBA) in Congress presents a potential tailwind for earnings, as tax reliefs and other deregulatory and pro-business policies could shore-up the bottom line and drive earnings upgrades7. On a macro level, the bill could moderately boost economic activity going into 2026, when these lagged effects take root8. Taken together, these impacts may somewhat partially offset the negative effects from tariffs, while supporting risk assets like US equities.
- Third, while slowing growth and weakness in the US labour market are notable concerns, renewed policy easing by the Federal Reserve could alleviate some pressure. Alongside the moderate growth impulse from the OBBBA, a combination of fiscal stimulus and monetary easing could help the economy avert an outright recession. A potential soft-landing scenario and renewed Fed policy easing cycle could be constructive for US equities overall.
- Fourth, a weaker US Dollar could be a tailwind for earnings, especially for US companies that derive substantial revenues from international markets2.
The time for active
Ultimately, these tailwinds do not impact all sectors and companies equally. Bottom-up stock selection remains crucial to ensure exposure to sectors and companies poised to benefit from these constructive factors and/or demonstrate resilience to potential policy and macroeconomic pressures.
Furthermore, elevated market concentration and stretched valuations suggest the need to rebalance exposure between value and growth investment styles, as well as across sectors, to counterbalance these risks.
With greater performance dispersion observed across and within sectors, an active and selective approach may help investors potentially gain exposure to high-quality and attractively valued companies that exhibit resilient demand, healthier margins and are better positioned to adapt to the post-tariff environment.