Real world catching up to the virtual world
International markets
Gabriela Santos
Like the economy, global earnings began a tentative and uneven recovery in the third quarter of 2020. Earnings growth has been strong in technology, communication services and e-commerce — all companies benefiting from the shift to the virtual world. On the other hand, cyclical sectors like energy, financials, industrials and materials have seen the biggest earnings contractions. As the global recovery gains steam throughout 2021, it is precisely the “real world”-geared sectors that should see the biggest bounce-back in earnings growth.
These nuances between sectors help to explain regional differences in equity performance shown in Exhibit 1. Cyclical sectors have the largest representation in EMEA, Latin America, Japan and Europe, which are precisely the regions that have only recovered part of their COVID-19-related losses. EM Asia has significantly outperformed, given its faster domestic recovery, as well as its heavier weighting toward technology, which has generally benefited from the pandemic and which accounts for 21% of the EM Asia equity index.
Exhibit 1: Cyclical regions have lagged in the pandemic year, but are likely to lead in the recovery
CYCLICALS AS % OF INDEX MARKET CAPITALIZATION, RETURNS ARE TOTAL RETURNS IN USD
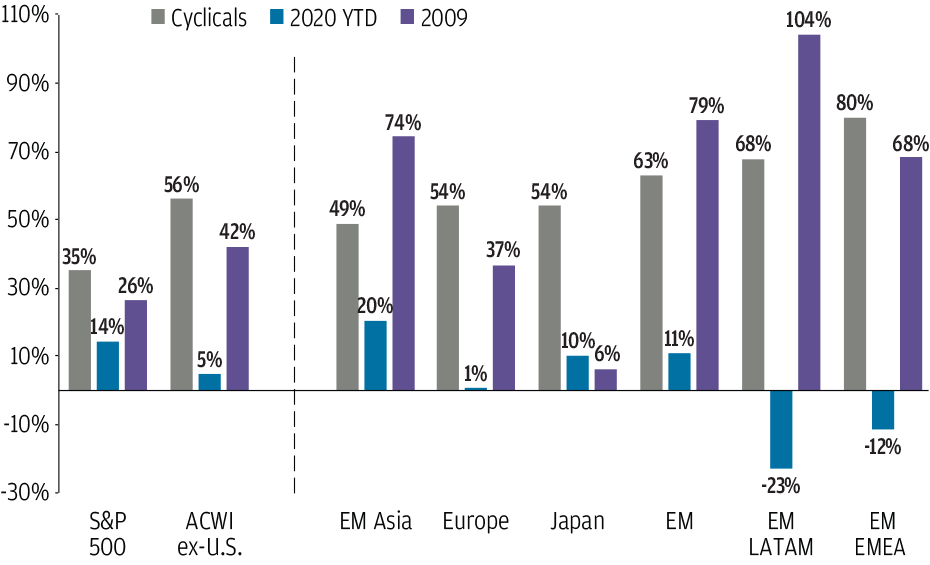
Source: FactSet, MSCI, Standard & Poor’s, J.P. Morgan Asset Management. All return values are MSCI Gross Index (official) data, except the U.S., which is the S&P 500. Cyclicals include the following sectors: Consumer Discretionary, Financials, Industrials, Energy and Materials. Data are as of November 30, 2020
Going forward, investors should ask themselves: 1) Which markets will be more geared toward 2021’s global recovery? and 2) Which markets may be more geared toward the next cycle’s themes?
Once investors feel more confident about the global recovery, cyclical regions should outperform more defensive ones. This suggests strong performance ahead for Europe, Japan and non-North Asia emerging markets. This catch-up began in November as investors digested the very first vaccine trial results, but has much further room to run once a timeline for global vaccine distribution becomes clearer. Thinking beyond the COVID-19 aftermath, international equity markets also offer exposure to the next decade’s big growth stories. This includes the emergence of the EM middle class, which benefits a broad swath of sectors that can take advantage of shifting consumption patterns, as well as EM technological innovation, both of which benefit markets in EM Asia in particular. Companies in Europe also offer access to the EM consumer theme through leading consumer discretionary companies. In addition, European markets can offer investors access to growing themes like a focus on climate change policy and health care innovation.
The COVID-19 shock has created a better entry point for investing in the global recovery and positioning for the next cycle’s global themes. The MSCI ACWI ex-U.S. discount to the U.S. now sits at 23% versus the 20-year average discount of 13% (measured by the forward price-to earnings ratio) and provides a 2.8% dividend yield compared to 1.7% for the S&P 500. In addition, the expected depreciation of the U.S. dollar should provide an additional currency boost to total returns.


