Rates in reflation
Fixed income
Jordan Jackson
As market volatility spiked due to the pandemic-induced social distancing recession, the Federal Reserve (Fed) provided extensive monetary support through interest rate cuts, new liquidity facilities and large-scale asset purchases. Equally effective, fiscal relief in the form of the CARES Act provided much needed financial support to millions of Americans and businesses experiencing financial hardship. Together, monetary and fiscal policy helped deliver substantial aid to a very weak economy in the first half of 2020 and sustain the early stages of the recovery through the second half of the year.
Looking to 2021, we believe that fiscal policy will need to do the heavy lifting in supporting growth given the limited scope of further monetary policy action. It should be emphasized, however, that asset purchases provide Congress with meaningful room to provide further stimulus. As shown in Exhibit 1, the Federal Reserve increased its Treasury holdings by $2.3 trillion in fiscal year 2020, effectively absorbing 55% of the total growth in public debt outstanding last year. Moreover, steady Treasury purchases of roughly $80 billion per month could lead to close to another $1 trillion in Treasury financing in 2021, footing some of the bill for additional stimulus early next year.
Exhibit 1: Change in federal debt held by the public and Federal Reserve holdings of U.S. Treasury debt
USD BILLIONS, FISCAL YEARS
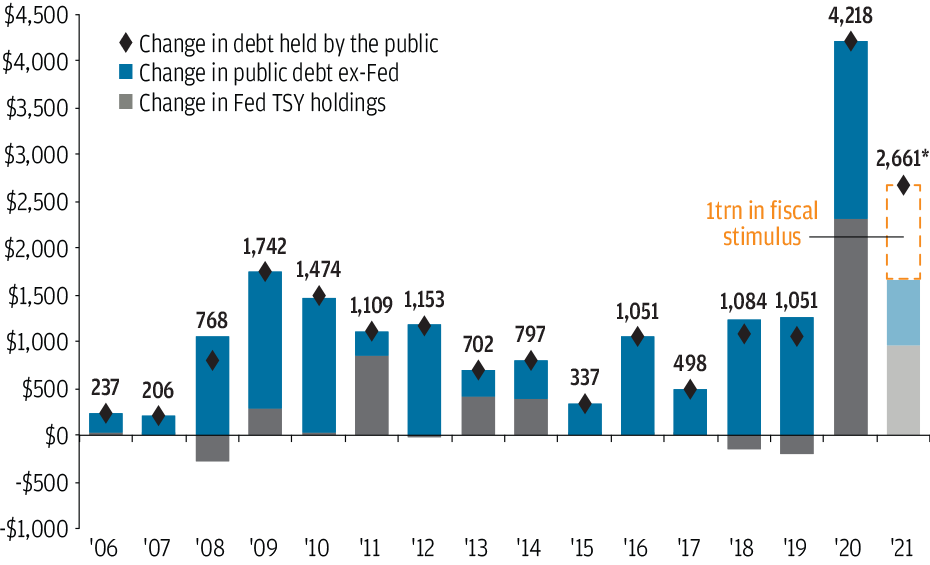
Source: Congressional Budget Office (CBO), Federal Reserve, U.S. Treasury, J.P. Morgan Asset Management. Fiscal years begin October 1 and end September 30. *FY2021 estimate includes an additional estimate of $1 trillion in fiscal stimulus. Baseline forecasts are from CBO and project change in debt held by the public of $1.6 trillion in FY2021. Federal Reserve U.S. Treasury holdings are as of September 30 of each year and include bills. Data are as of November 30, 2020.
However, the Fed will have to adapt its strategy both to the degree of further fiscal support and the possibility of a successful vaccine rollout in the first half of 2021, as these forces combined could prove both more stimulative and more inflationary than expected, complicating Fed policy decisions.
In August, the Fed adopted a new “average inflation targeting” strategy, stating an intention to allow inflation to run above 2% (as measured by the personal consumption deflator) for some time to compensate for recent undershoots. In the forward guidance delivered at the September meeting, the Fed stated that it expected to maintain a near-zero federal funds rate until such time as inflation had reached 2% and the economy had attained “maximum employment.”
While the Fed has not explicitly said what “maximum employment” entails, it is reasonable to infer that it encompasses its 4.1% long-term expectation for the unemployment rate. Since we do not expect this to be achieved until early in 2023, the Fed appears to have tied its own hands with regard to short-term interest rates. However, if inflation does run hotter than expected, it could well taper its Treasury purchases, steepening the yield curve by pushing long-term yields higher.
For fixed income investors, very low bond yields in the short run will make it difficult to generate income, while rising long-term rates are likely to inflict capital losses. Given this, investors will need to consider greater exposure to spread products like credit, particularly upper tier high yield, and emerging market debt (EMD) in order to minimize duration risk while maximizing portfolio yield. As shown in Exhibit 2, while spreads have narrowed to near historical tights across core sectors, yields remain attractive across emerging markets and high yield, and further room for spread compression can help bolster price returns in these sectors next year.
Exhibit 2: Spread to worst across fixed income sectors
BASIS POINTS, PAST 15 YEARS, WEEKLY
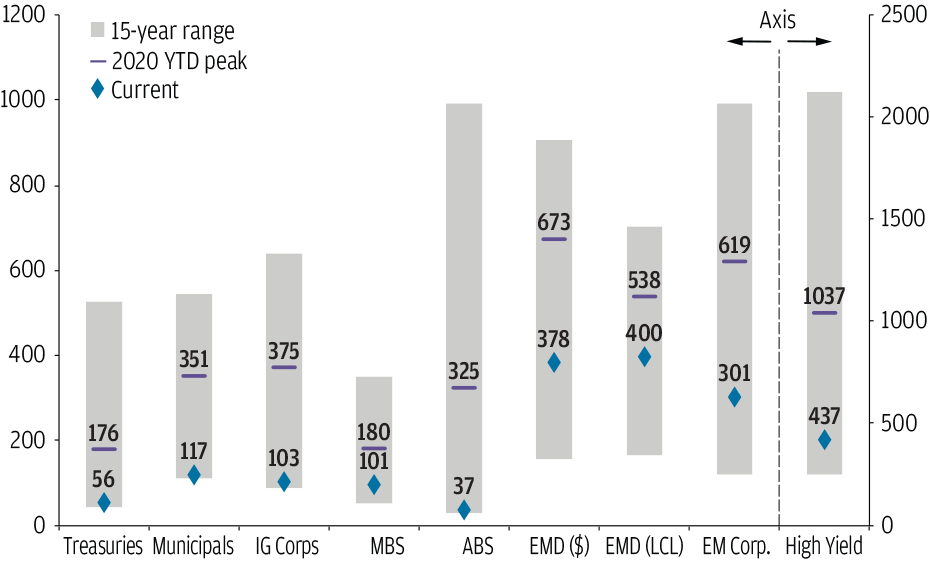
Source: Bloomberg Barclay’s, FactSet, J.P. Morgan Credit Research, J.P. Morgan Asset Management. Indices used are Barclay’s except for emerging market debt: EMD ($): J.P. Morgan EMIGLOBAL Diversified Index; EMD (LCL): J.P. Morgan GBI-EM Global Diversified Index; EM Corp.: J.P. Morgan CEMBI Broad Diversified. Spread to worst indicated is the difference between the yield-to-worst of a bond and yield-to-worst of a U.S. Treasury security with a similar duration. All sectors shown are spread to worst except for Treasuries and Municipals, which are based on yield-to-worst. EMD (LCL) spread to worst is calculated using the index yield less the YTM on the 5-year U.S. Treasury bellwether index. Data are as of November 30, 2020.
Broadly, we still think core bonds provide a degree of equity diversification and therefore should remain a core allocation within portfolios. As a complement to that core position, investors should look to gradually shorten portfolio duration while identifying companies and countries with strong credit fundamentals, balancing a gradual improvement in the economy and inflation while still generating income.


