Investors’ use of closed-end private funds is grounded in the belief that the highest returns can only be accessed by investing in illiquid strategies with long lockups of capital. Investors manage around this lack of liquidity by limiting the share of the portfolio that is allocated to such strategies – a constraint that ultimately caps potential portfolio returns.
But this may be a false choice. Evidence suggests that perpetual-life, open-end core/core-plus strategies can deliver returns of a similar magnitude to closed-end funds while offering materially better access to capital and lower risk. As a result, investors may wish to diversify the mix of private funds in which they invest, while also considering if the improved liquidity allows for a larger overall allocation to private assets. A larger and more diverse pool of closed-end and open-end private strategies is likely to improve returns over the long run.
This month we explore how the performance of closed-end and open-end funds is more similar than many investors may realize, and the resulting implications for asset allocation.
Rate of return and magnitude of return are not the same
The most commonly cited metric of return for closed-end funds is the internal rate of return (IRR). Though seemingly simple, IRR calculations are highly sensitive to the timing of cash flows, which can make them challenging to use as a basis of comparison for strategies that both invest and return capital over extended periods of time. For many closed-end vehicles, subscription credit facilities (SCF) and long investment periods allow a fund to delay the deployment of investor capital well past the commitment date (Exhibit 1). This shortens the time between the actual investment of capital and the monetization of the assets, which increases the IRR, all else equal. While delayed capital calls and higher IRRs may sound appealing, investors may not realize any actual benefit. First, they are usually forced to maintain liquidity elsewhere in anticipation of these capital calls, preventing them from earning returns close to what they budget from a private strategy. Second, while delayed capital calls and shorter investment horizons technically boost the stated IRR, they have no real impact on the total growth of capital in the fund, measured by the multiple on invested capital (MOIC).
Open-end vehicles deploy capital efficiently by speeding the initial investment and allowing capital to remain fully invested
Exhibit 1: Illustration of the timeline for capital deployment in open-end and closed-end funds
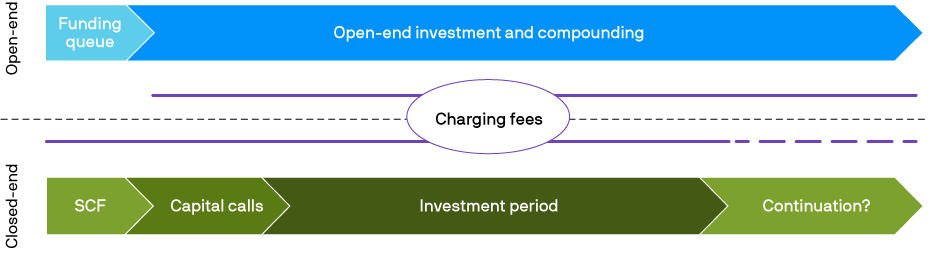
Source: J.P. Morgan Asset Management.
Open-end funds often use a different calculation known as time-weighted return (TWR), which captures an investor’s annualized rate of return in the fund over the period of time between investment and redemption. Generally, the TWR on an open-end core fund is significantly lower than the IRR on a non-core fund (Exhibit 2A). But importantly, these metrics are apples and oranges. The best way to resolve the mismatch and get some clarity on actual investment performance is to look at the investment multiple earned by each strategy over a consistent time horizon. When compared on this basis, core open-end funds achieved total multiples that were similar to or higher than many closed-end strategies (Exhibit 2B) – and did so with better relative liquidity, improved diversification, reduced manager dispersion and lower overall risk.
Despite lower rates of return, open-end Core/Core-plus strategies have similar net multiples to single-vintage, long-lockup non-core alternatives
Exhibit 2A: TWR of open-end core funds vs. IRR of closed-end funds
Exhibit 2B: MOIC of open-end and closed-end funds
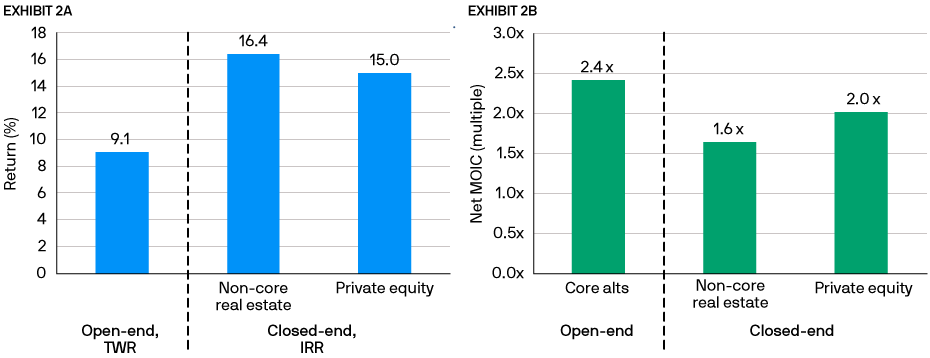
Source: Preqin, J.P. Morgan Asset Management. For illustrative purpose only. Historical TWRs and MOICs for core alternatives funds are based on realized J.P. Morgan fund performance data from 2011 to 2020, net of management and performance fees. Historical MOIC and IRR for long-lockup, non-core alternatives funds are average performances weighted by final close size of funds, the vintages of which are between 2009 and 2011 and represents the industry average. Some of the funds may have a life cycle that is longer or shorter than 10 years while most of the funds should have a life cycle that is close to 10 years.
This analysis uses a blend of open-end core alternative strategies across the real estate, infrastructure and transportation sectors. The common thread across these various approaches is a combination of long-lived assets with stable cash flows and moderate leverage. The results show that while the TWR for open-end funds is often about half the level of the IRR for closed-end funds,1 the multiples for both over a ten-year horizon are roughly the same.
Keeping capital invested and compounding
How can a core open-end strategy investing in higher quality assets generate returns equivalent to those of a closed-end fund investing in riskier assets? The answer lies in two very basic elements of finance: the importance of staying invested and the power of compounding.
An open-end strategy can accept investor inflows as needed, deploy them relatively quickly and, critically, keep them fully invested across time. Conversely, a more opportunistic closed-end fund will deploy capital slowly and return capital piecemeal during the later stages of its life cycle. As a result, the amount of capital fully invested across the entire span of time between the initial commitment and the final redemption is smaller and the resulting multiple is lower (Exhibits 3A and 3B).
Open-end funds deploy capital faster and are more fully invested across time
Exhibit 3A: Core and core-plus alternatives solution (open-end fund, TWR)
Exhibit 3B: Non-core alternatives solution (closed-end, single-vintage fund, IRR)
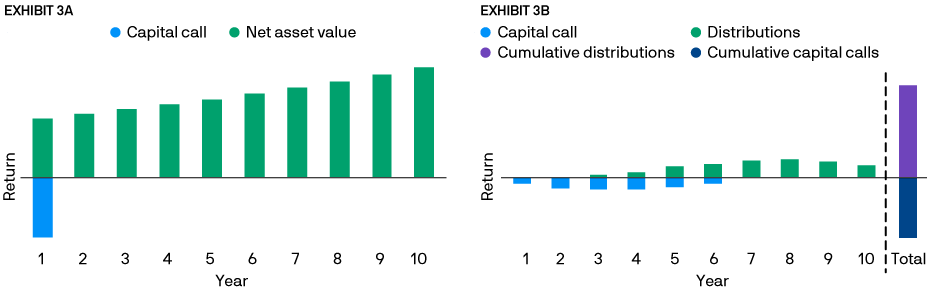
Source: Burgiss, J.P. Morgan Global Alternatives. Data is based on availability as of December 2020. DISCLAIMER: Past performance is not a reliable indicator of current and future results. The IRR shown above is calculated based upon internal J.P. Morgan Asset Managment data. There can be no guarantee the IRR will be achieved. Diversification does not guarantee investment returns and does not eliminate the risk of loss.
Closed-end investors may be able to achieve higher returns by minimizing the drag from uninvested capital through a portfolio of funds diversified across multiple vintage years, such that new investments are waiting to be made with capital that is being returned from older investments. However, this approach is challenging to implement from an operational standpoint and it also increases the importance of manager selection – no small matter in the private funds world. While it is widely understood that returns in private markets accrue mostly to top-quartile managers, it is less well known that the top quartile is historically biased to small and mid-size managers (Exhibit 4). This poses a challenge for investors with limited resources to seek out and access a sufficiently deep pool of high quality managers.
The top quartile of closed-end funds is historically biased to small and mid-size managers
Exhibit 4: Private equity industry performance dispersion by fund vintage year and size
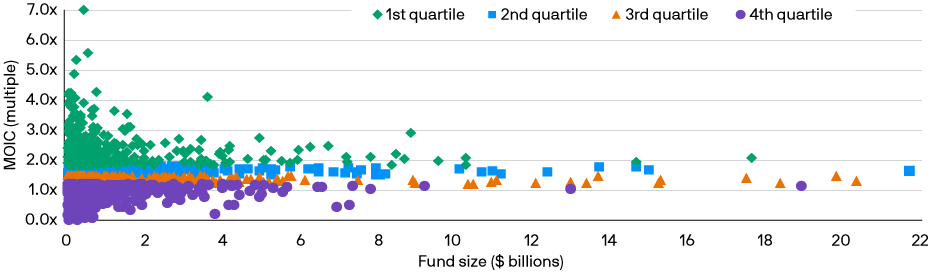
Source: PitchBook, as of May 30, 3021. Fund performance is as of December 30, 2020 or latest available date.
For many investors, this challenge of building a diversified pool of closed-end funds is a primary argument for using professional multi-manager platforms that can maximize vintage-year diversification across many underlying funds while keeping cash-flow drag to a minimum. If done successfully, the potential of the closed-end model can be fully realized and investors can earn the returns they expect (Exhibit 5).
Maximizing vintage-year diversification while keeping cash-flow drag to a minimum can help investors realize the full potential of closed-end fund returns
Exhibit 5: Expected 10-year net MOIC for open-end core alternatives funds and multi-vintage long-lockup strategies
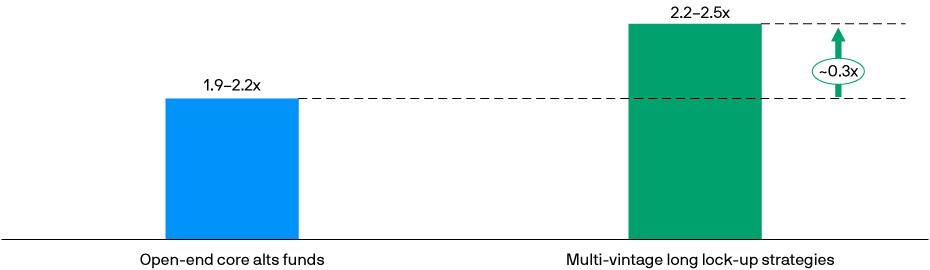
Source: J.P. Morgan Asset Management. For illustrative purpose only. Expected MOICs are based on J.P. Morgan Asset Management 2022 Long-Term Capital Market Assumptions (LTCMA) and other internal assumptions. According to Cambridge Associates, 10-year horizon IRR for global private equity funds ending in 1Q 2021 has a median of ~12%. The expected MOIC is calculated based on J.P. Morgan Asset Management internal cash flow assumptions with a 16-18% IRR for each vintage within the multi-vintage construct. Expected portfolio metrics are based on J.P. Morgan Asset Management 2022 LTCMA. Expected downside risk is measured by expected Value at Risk at 95% confidence level.
The power of combining closed-end and open-end vehicles
A combination of closed-end and open-end vehicles should ultimately allow investors to maximize the higher return potential of private investing across the broadest possible opportunity set of underlying illiquid assets. Both types of vehicles deliver attractive returns in different ways, with little overlap across underlying assets. Long-term investors should reconsider using IRR as the primary basis for evaluating private strategies, as it may lead them to believe – erroneously – that open—end core vehicles deliver less compelling performance.
1 In mostly multi-vintage constructs.
09df241306151405