-
Tariffs and Trade
-
Fiscal Policy
-
Taxes
-
Deregulation
-
Immigration
-
Energy
-
Investing through the policy fog
Policy progress
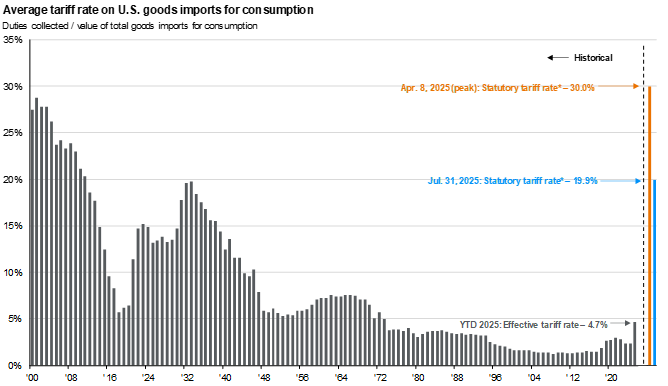
This table summarizes the key country and product-level tariffs, trade agreements, ongoing negotiations and pending court decisions on tariffs and trade.

Economic implications
- The short-term economic impacts of tariffs tend to be stagflationary. Some of the one-time increase in tariffs may hit U.S. businesses’ bottom line, while some may be passed on to the end-consumer, raising prices. Important business decisions (investment and hiring) may be postponed or canceled, and consumers may pull back on bigger purchases.
- The odds favor a mild recession this year.
Investment implications
- The extent to which global companies and economies are hit will depend on their policy responses and the external vs domestic focus of specific companies. Large multinationals could face headwinds, particularly in sectors with the highest share of foreign revenue, such as technology and materials.
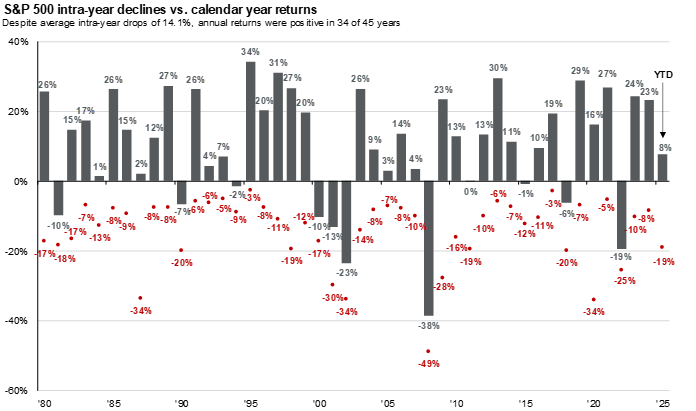
- Uncertainty has fomented market volatility, with the markets already digesting a double-digit correction. In 2018, a tit-for-tat trade war weighed on equity multiples despite solid earnings across major global equity markets, producing negative returns.
- "Safe haven" currencies like the Japanese Yen, Swiss Franc, and even the Euro can strengthen further, while some EM Asia countries (like China) may decide to devalue their currencies. Initial expectations were for a stronger U.S. dollar, but instead the dollar has weakened since Inauguration Day.
Policy progress
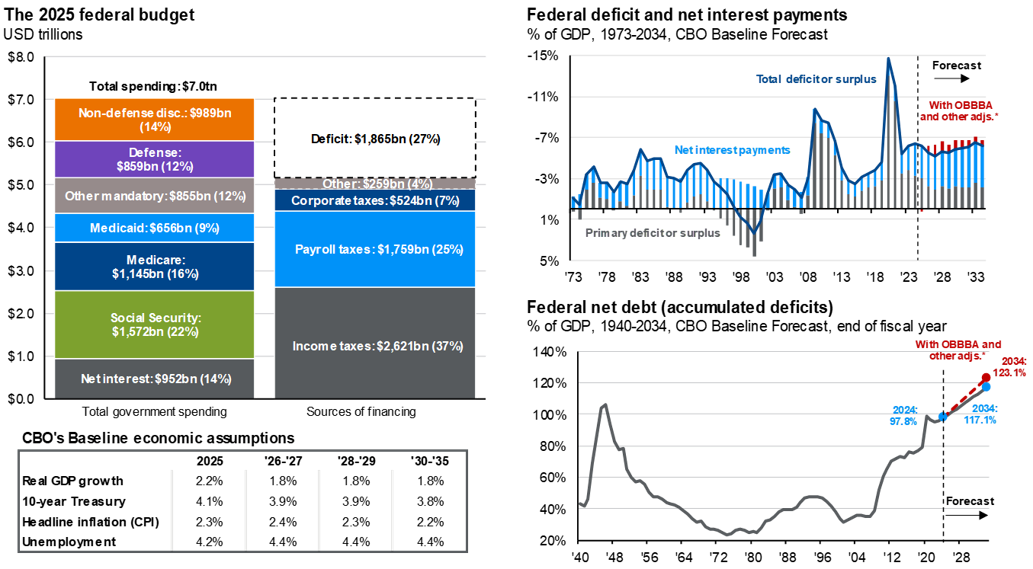
The One Big Beautiful Bill Act (OBBBA) was signed into law on July 4, 2025. This bill contains $4.5 trillion in tax cuts and $1.2 trillion in spending cuts.
According to the Congressional Budget Office, the Senate version of the bill could add $3.3 trillion to deficits over the next decade. Including additional interest costs, accumulated deficits could rise by $4.0 trillion. Moreover, many tax cuts in the reconciliation bill are set to expire at the end of 2028. Extending them could potentially add another $1.5 trillion to accumulated deficits over the next decade. In this case, even with additional revenue from tariffs, annual deficits would likely exceed 6% of GDP, boosting our debt/GDP ratio from 98% last fiscal year to close to 130% in ten years.
Specifically, the OBBBA includes:
Individual tax cuts
- Extension of 2017 Tax Cuts and Jobs Act
- Deductions on tips, overtime, auto loan interest (up to $10,000 on American-made cars)
- Raising SALT deduction from $10,000 to $40,000
- Higher standard deduction
- Higher child tax credit
- Trump accounts for newborn savings
- Estate tax exemption rises to $15 million
Corporate tax cuts
- 100% first-year bonus depreciation
- Domestic R&D expensing
- Expand interest deduction
- Lower international rates
- Expand Opportunity Zones
Spending
- $170 billion Border security (border enforcement and deportations)
- $150 billion Defense spending (Golden Dome missile defense, shipbuilding, military innovation, nuclear deterrence)
Spending cuts
- $1.2 trillion in cuts to Medicaid and additional work requirements for SNAP (Supplemental Nutrition Assistance Program) benefits
- Phase out renewables and electric vehicle (EV) credits from Inflation Reduction Act
- Student loan reform
Debt ceiling
- Raises debt ceiling by $5 trillion
Economic implications
- Excessive deficits and debt could slow economic growth and push up inflation.
- Many of these new tax cuts take effect as of January 1st, 2025, so taxpayers could see income tax refunds early in 2026.
- Based on calculations from the Joint Committee on Taxation, short-term tax cuts could boost consumer disposable income by $6 billion per quarter in the second half of 2025, $51 billion per quarter in the first half of 2026, and then $19 billion per quarter in the second half of 2026.
- If new tariff revenue equals roughly $75 billion per quarter from the fourth quarter on, and consumers end up paying 60% of that, or $45 billion per quarter, then the drag on consumers from higher tariffs will exceed the value of new tax breaks in 2H25 and 2H26, but not 1H26.
Investment implications
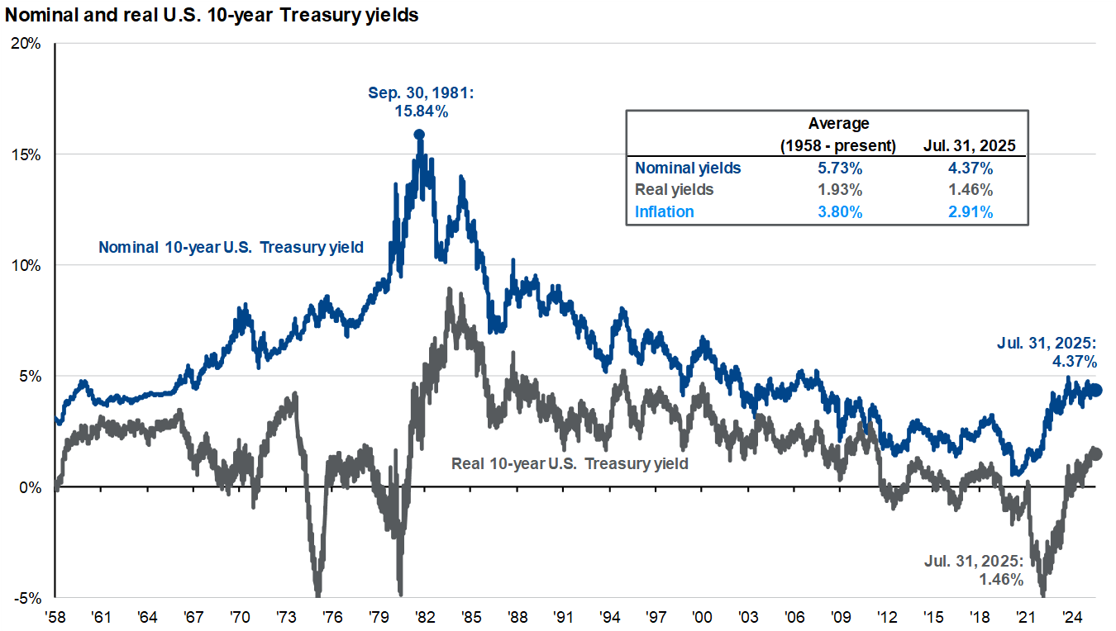
- Treasury yields could rise further as investors demand more compensation for holding U.S. government debt, which could be perceived to carry more risk given the state of federal finances.
Federal deficit and net interest payments
% of GDP, 1973-2034, CBO Baseline Forecast

Federal net debt (accumulated deficits)
% of GDP, 1940-2034, CBO Baseline Forecast, end of fiscal year
Source: CBO, J.P. Morgan Asset Management; BEA, Treasury Department. Estimates are from the Congressional Budget Office (CBO) January 2025 An Update to the Budget Outlook: 2025 to 2035. OBBB refers to the “One Big Beautiful Bill Act." *Adjusted by JPMAM to include estimates from the CBO July 2025 report “Estimated Budgetary Effects of Public Law 119-21, to Provide for Reconciliation Pursuant to Title II of H. Con. Res. 14, Relative to CBO’s January 2025 Baseline.” Figures are also adjusted to include JPMAM estimates of tariff revenues and the estimated cost of extending expiring tax cuts beyond 2028, based on CBO estimates prepared for the version of the OBBB proposed by the House of Representatives on May 22, 2025. Guide to the Markets – U.S. Data are as of July 31, 2025.
Policy progress
The One Big Beautiful Bill Act of 2025 contains the following tax cuts:
Individual tax cuts
- Extension of 2017 Tax Cuts and Jobs Act
- No taxes on tips, overtime, auto loan interest (up to $10,000)
- Raising SALT deduction from $10,000 to $40,000
- Higher standard deduction
- Higher Child Tax Credit
- Trump accounts for newborn savings
- Estate tax exemption rises to $15 million
Corporate tax cuts
- 100% first-year bonus depreciation
- Domestic R&D expensing
- Expand interest deduction
- Lower international rates
- Expand Opportunity Zones
Many of the tax provisions are set to expire at the end of 2028, although will likely be extended at that time, raising the overall cost of the bill (see Fiscal Policy tab).
These tax cuts are going to be applied retroactively, taking effect January 1, 2025.
Economic implications
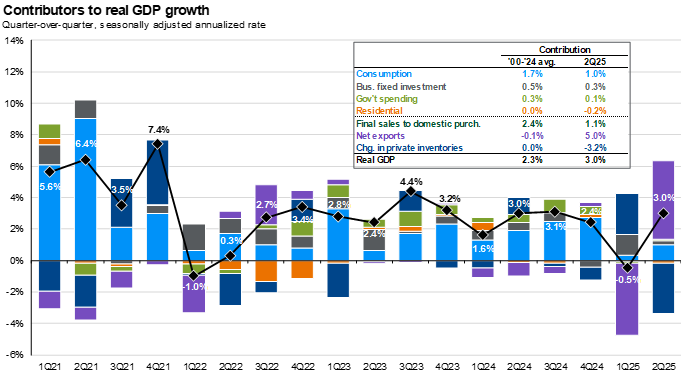
- Growth: Real GDP would be largely unaffected in 2025, but fiscal stimulus from tax cuts kicking in at the start of 2026 could boost growth for the first half of next year.
Investment implications
- Although there is not specific corporate tax rate cut, the revived business provisions from the Tax Cuts and Jobs Act would likely have an impact on effective taxes paid by companies, reducing their overall tax bills in some cases.
- Greater consumer spending power could boost revenues and support overall profits.
Policy progress
The Biden administration passed nearly 80% more financially significant rules (estimated to have $100 million or more impact to the economy; threshold raised to $200 million in 2023) throughout its term than the Trump administration did during its first term, according to George Washington University. The Trump administration is likely to attempt meaningful deregulation this time around. During his first term, the President directed agencies to eliminate two rules for each new one created. He has proposed to increase that to eliminate 10 rules for each new one.
Thus far deregulation has not been the primary focus, although key targets of potential deregulation include:
- Finance: Post-financial crisis era regulations, Basel III and crypto assets could face some deregulation.
- Energy: The administration will likely remove restrictions on leases and permitting for oil and gas drilling. It has also proposed to rescind unspent funds from the Inflation Reduction Act, remove subsidies on renewables and electric vehicles, and roll back environmental protections.
- Health care: A long-standing goal of the President was the repeal the Affordable Care Act.
- Technology: Technology may continue to come under intense scrutiny, but focus may shift towards issues like free speech and competitiveness rather than wholesale breakups of tech companies. Influential tech leaders may emphasize an open environment for AI development that enables the U.S. to maintain its competitive edge. The Administration could expand the semiconductor export restrictions introduced during the Biden administration and increase incentives for domestic chip manufacturing.
The realities of deregulation, however, may be more sobering. It is easier not to add new regulation than to eliminate it. Not only does proposed deregulation need to go through a formal review process but it is also subject to judicial review, which has a mixed success rate.
Economic implications
- Productivity: Deregulation should boost productivity and support growth; however, any such gains are very hard to estimate.
- There could be long-term impacts to environmental and climate sustainability, as well as consumer protections.
Investment implications
- Mega cap technology companies may continue to face anti-trust litigation, although the strategic importance of many of these businesses may also protect them and limit the scope of legal action, somewhat diminishing the regulatory headwind.
- Financials stand to benefit from a rollback of post-financial crisis era regulations and Basel III.
- Energy could also benefit, although with oil production already at high capacity, this may not result in a meaningful increase in oil supply in the short run. On the other hand, renewables and EV subsidies enacted in the Inflation Reduction Act could be at risk.
- Thus far, markets have not rewarded health care for any prospects of regulatory regime change, and the Administration’s cabinet appointee has not been well-received by the markets at this stage.
- Crypto guardrails could diminish through less SEC enforcement and a relaxed regulatory framework for digital assets.
- Streamlined regulation and greater clarity could revive IPOs and M&A, creating much needed exit activity in private equity, and supporting lending and financing activity in private credit.
Source: George Washington University's Regulatory Studies Center, Office of the Federal Register for Biden administration, Office of Information and Regulatory Affairs for all prior administrations, J.P. Morgan Asset Management. Data are as of September 6, 2024.
Economically significant rules published by administration in first year
Cumulative number of rules

Source: George Washington University's Regulatory Studies Center, Office of the Federal Register for Biden administration, Office of Information and Regulatory Affairs for all prior administrations, J.P. Morgan Asset Management. Data are as of September 6, 2024.
Policy progress
Immigration efforts have prioritized increasing border security, deporting undocumented immigrants with criminal convictions and final deportation orders, and slowing or restricting legal avenues to immigrate.
The latest data show:
- An average of 8,000 encounters on the southern border in July, down very sharply from roughly 100,000 per month in 4Q24 and 250,000 per month in 4Q23.
- Government data on detentions and involuntary deportations remains spotty, but media reports suggest a running rate of just over 30,000 involuntary deportations per month.
- The State Department has suspended or delayed a monthly report on immigration visas issued. However, the latest data we have show average issuance in April and May 2025 of 47,000 – down 18% from the same months in 2024.
Economic implications
- Jobs: Lower labor force growth due to less immigration could limit the labor supply. Wages could face upward pressure as native born workers’ median wages are higher than foreign born workers.
- Growth: Over time, economic growth could be limited by constrained labor force growth.
Investment implications
- Companies could continue struggle to find enough qualified workers, a longstanding challenge.
- Higher wages could weigh on profit margins.
Labor force growth, native and immigrant contribution
Year-over-year difference, end of year, aged 16+, millions

Median weekly wages
2023

Source: BLS, FactSet, J.P. Morgan Asset Management. Labor force data are sourced from the Current Population Survey, also known as the household survey, conducted by the BLS. *Year-over-year change in the labor force calculated from January of each year. For example, the 2024 figures are calculated by subtracting the size of the labor force as of 1/31/2024 from the size of the labor force as of 1/31/2025. Guide to the Markets – U.S. Data are as of July 31, 2025.
Policy progress
President Trump signed a slew of executive orders to boost U.S. energy production and lower energy prices. His national energy emergency declaration will give the president broad authority to remove environmental restrictions and expedite approvals for energy infrastructure projects. In addition, notable executive orders were aimed at deregulating oil drilling in the Arctic and lifting the hold on new LNG export permit applications to help alleviate a backlog of new LNG projects, including large ones in Texas and Louisiana that have been on pause while the Biden Administration reviewed their environmental and economic impacts.
During his inaugural address, President Trump also reiterated his intentions to refill the Strategic Petroleum Reserve. The Biden Administration released 180 million barrels of crude oil from the Strategic Petroleum Reserve (SPR) to stabilize oil prices during the Russia/Ukraine war, bringing the SPR to 40-year lows in June 2023. President Trump has now pledged to refill the SPR from its current inventory of 395 million barrels to the maximum capacity of 714 million barrels; however, he will first need $24bn in funds authorized from Congress to do this.
Economic implications
Despite these changes, energy supply may not see a marked increase:
- The U.S. is already the largest producer of crude oil in the world, pumping out roughly 13.4 million barrels per day, per the EIA.
- The difference between U.S. primary energy production and consumption have reached the highest levels in history.
- Weather, geography, specialized equipment requirements and the cost to extract oil in the Arctic has historically been costly and financially unviable for many oil and gas companies.
- OPEC+ already has planned 2025 and 2026 production increases, and the world’s oil supply is expected to continue increasing in the coming years.
- The U.S. was already expected to significantly increase its world-leading LNG production in 2025 and 2026 from 90M tonnes per annum to over 140M tonnes per annum due to previously approved LNG projects to supply Europe and Asia with LNG as the regions continue cope with supply issues from the Russia/Ukraine war.
Investment implications
- Energy companies may not want to significantly ramp up supply because it could weigh on oil prices and reduce profitability. U.S. oil exploration and production firms need oil prices above $64 on average to profitably drill a new well, leaving little room for current prices to decline.
U.S. net oil imports
% of nominal GDP, quarterly

Source: BEA, FactSet, J.P. Morgan Asset Management. Net oil imports as a share of nominal GDP calculated using seasonally adjusted data reported at annual rates. Guide to the Markets – U.S. Data are as of July 31, 2025.
Political opinions are best expressed at the polls, not in a portfolio. One cardinal rule investors ought to follow: Don’t let how you feel about politics overrule how you think about investing.
The chart below shows a survey from the Pew Research Center asking Americans how they feel about economic conditions. The results show that Republicans often feel better about the economy under a Republican president, while similarly Democrats often feel better about the economy under a Democratic president. Investors often make portfolio decisions based on their economic outlook.
Yet, average annual returns on the S&P 500 during the Obama administration of 16.3% and during the Trump administration of 16.0% were almost identical and higher than the average return over the last 30 years of 10.9%. It is likely the macro conditions, like ultra-low interest rates enjoyed during both Obama and Trump administrations, were a more influential driver of above-average returns during those periods, rather than the policy prescriptions each president espoused.
Consumer confidence by political affiliation
Percentage of Republicans and Democrats who rate national economic conditions as excellent or good

Source: Pew Research Center, J.P. Morgan Asset Management. The survey was last conducted in April 2025. Pew Research Center asks the question: “Thinking about the nation’s economy, How would you rate economic conditions in this country today… as excellent, good, only fair, or poor?” S&P 500 returns are average annualized total returns between presidential inauguration dates and are updated monthly. Guide to the Markets – U.S. Data are as of June 30, 2025.
Key Policy Slides

Deep dive: Tariffs and Trade
Latest Insights
cdd91226-b6f2-11ee-9fbc-ef91c8fe40eb
The information presented is not intended to be making value judgments on the preferred outcome of any government decision or political election.