Select a Role

Terms and Conditions

Table of Contents
  • For Institutional/ Wholesale/ Professional Clients
  • Terms of Use
  • Privacy Policy
  • Accessibility
For Institutional/ Wholesale/ Professional Clients

In order to enter the page please read the information below and affirm by clicking the accept button that you have read and understood the information provided.


THE MATERIAL ON THIS SITE IS INTENDED FOR INSTITUTIONAL USE ONLY - NOT FOR RETAIL DISTRIBUTION

You must read the following information before proceeding. The following important information, in conjunction with the separate Terms of Use, governs your use of this website. Your use of this website and Content (defined below) constitutes your acceptance of those terms of use. If you do not agree with the terms of use, you should immediately cease use of this website and review of Content. When used herein, “we” and “our” means J.P. Morgan Asset Management [JPMAM] and its affiliates worldwide and “you” and “your” refers to any individual, company, or legal entity that accesses or otherwise uses this website. All of the information and content on this website, including, but not limited to, all text, analyses, reports, articles, graphics, software applications, video and audio files and photos, trademarks, service marks and trade dress (“Content”) is owned or licensed by JPMAM. J.P. Morgan Asset Management may offer advisory services in jurisdictions where it has received appropriate licenses to offer such services. This website is not directed to any person in any jurisdiction where the publication or availability of the website is prohibited. Persons in respect of whom such prohibitions apply must not access the website.


The information contained in this website is intended for use by Institutional Investors in the United States only. It is not intended for use by non-U.S. entities or for retail investors.  “Institutional Investor” would include pension funds, investment company registered under the investment Company Act of 1940, Financial Intermediaries, Consultants, Endowments & Foundations and investment advisors registered under the investment Advisors Act of 1940,    After you have read the information herein, you  will be instructed to click to: 1) acknowledge that you are an “institutional investor” 2) that you accept the information herein, as well as  the Terms of Use , the Privacy/Security and Cookie policies set out below and,  3) accept the delivery of this website in English.


Certain content has been obtained from sources that JPMAM believes to be reliable as of the date presented; however, JPMAM cannot guarantee the accuracy of such content, assure its completeness, or warrant that such information will not be changed. The content contained herein is current as of the date of issuance (or such earlier date as referenced herein) and is subject to change without notice. JPMAM has no obligation to update any or all such Content; nor do we make any express or implied warranties or representations as to its completeness or accuracy. Any Content presented regarding the affiliates of JPMAM is presented purely to facilitate an organizational overview and is not a solicitation on behalf of any affiliate. The content is not intended as an offer or solicitation with respect to the purchase or sale of any security or other financial instrument or any investment management services. The content does not constitute investment advice and should not be used as the basis for any investment decision.


The content does not take into account individual Institutional Investor circumstances, objectives or needs. No determination has been made regarding the suitability of any securities, financial instruments or strategies for any Institutional Investor. The content is provided on the basis and subject to the explanations, caveats and warnings set out in this notice and elsewhere herein. The Content does not purport to provide any legal, tax or accounting advice. Any discussion of risk management is intended to describe JPMAM’s efforts to monitor and manage risk but does not imply low risk.


RISKS ASSOCIATED WITH INVESTING. The price of equity securities may rise or fall because of changes in the broad market or changes in a company’s financial condition, sometimes rapidly or unpredictably. These price movements may result from factors affecting individual companies, sectors or industries selected for the portfolio or the securities market as a whole, such as changes in economic or political conditions. Equity securities are subject to “stock market risk” meaning that stock prices in general (or in particular, the prices of the types of securities in which a portfolio invests) may decline over short or extended periods of time. When the value of a portfolio’s securities goes down, an investment in a fund decreases in value. There is no guarantee that the use of long and short positions will succeed in limiting a strategy’s exposure to domestic stock market movements, capitalization, sector-swings or other risk factors. Investing in emerging markets carry additional risk relative to investments in developed markets. Investment in a portfolio involved in long and short selling may have higher portfolio turnover rates. This will likely result in additional tax consequences. Short selling involves certain risks, including additional costs associated with covering short positions and a possibility of unlimited loss on certain short sale positions. Fixed income investing is subject to the risk that a counterparty will fail to make payments when due or default completely. If an issuer’s financial condition worsens, the credit quality of the issuer may deteriorate making it difficult for an investor to sell such investments. Changes in foreign currency exchange rates will affect the value of fixed income securities .For example, when the value of the U.S. dollar rises in value relative to a foreign currency, an investment in that country loses value because that currency is worth fewer U.S. dollars. Devaluation of a currency by a country’s government or banking authority also will have a significant impact on the value of any investments denominated in that currency. Currency markets generally are not as regulated as securities markets. High yield fixed income securities are considered to be speculative and are subject to greater risk of loss, greater sensitivity to economic changes, valuation difficulties and potential illiquidity. Loans are subject to additional risks including subordination to other creditors, no collateral or limited rights in collateral, lack of a regular trading market, extended settlement periods, liquidity risks, prepayment risks, and lack of publicly available information.  Derivatives, including futures contracts, options, swaps, credit default swaps, forward contracts and currency forwards, may be riskier than other types of investments and may increase the volatility of a portfolio. Derivatives may be sensitive to changes in economic and market conditions and may create leverage, which could result in losses that significantly exceed the original investment. Derivatives create exposure to counterparty risk, which is the risk that the derivative counterparty will not fulfill its contractual obligations (and includes credit risk associated with the counterparty). Certain derivatives are synthetic instruments that attempt to replicate the performance of certain reference assets. With regard to such derivatives, an investor does not have a claim on the reference assets and is subject to enhanced counterparty risk. Derivatives may not perform as expected, so an investor may not realize the intended benefits. When used for hedging, the change in value of a derivative may not correlate as expected with the currency, security or other risk being hedged. In addition, given their complexity, derivatives can be mispriced or improperly valued.


Conflict of interest: JPMAM and its affiliates may make investment decisions that are inconsistent with the recommendations or views expressed herein, including for proprietary accounts of JPMAM or its affiliates. JPMAM and its affiliates may have investment advisory or other business relationships with the issuers of securities referenced herein. JPMAM and its affiliates, officers, directors and employees may from time to time have long or short positions in and buy or sell securities or financial instruments referenced herein. JPMAM affiliates may develop and publish research that is independent of, and different than, the recommendations contained herein. JPMAM personnel other than those involved in the creation of the website or Content, such as sales, marketing and trading personnel, may provide oral or written market commentary or ideas to JPMAM’s clients or prospects or proprietary investment ideas that differ from the views expressed herein. 


Attestation: You further expressly acknowledge that you have checked and confirm that you; (i) are legally entitled to view this website; (ii) a legal entity and not an individual; and (iii) understand that the information on the website is not a promotion and that you will not treat it as such. In no event shall JPMAM or any other party be liable for any direct, incidental, special, consequential, indirect, lost profits, loss of business or data, or punitive damages arising out of your use of this website. 


Distribution: J.P. Morgan Funds are distributed by JPMorgan Distribution Services, Inc., which is an affiliate of JPMorgan Chase & Co. Affiliates of JPMorgan Chase & Co. receive fees for providing various services to the funds. JPMorgan Distribution Services, Inc. is a member of FINRA.


Confirmation: You must read the information included under legal “Terms of Use” and “Privacy/Security and Cookie” policies before accessing the website. The links below provide information on some of the laws and regulations applicable to this website. After you have read the information, you must 1) confirm that you are an institutional investor 2) that you accept the information herein, as well as the Terms of Use, the Privacy/Security and Cookie policies that you have read the information and accept the terms of use and the Privacy/Security and Cookie policies and;  3 ) accept the delivery of this website in English. Otherwise click Decline to leave the website.


Thank you.

Terms of Use

PLEASE READ THESE TERMS AND CONDITIONS CAREFULLY. BY ACCESSING THIS WEBSITE YOU AGREE TO BE BOUND BY THE TERMS AND CONDITIONS SET FORTH ON THIS WEBSITE. THESE TERMS AND CONDITIONS ARE SUBJECT TO CHANGE. WE WILL NOTIFY YOU OF AMENDMENTS TO THESE TERMS AND CONDITIONS BY POSTING THEM TO THE WEBSITE AND YOU AGREE TO BE BOUND BY SUCH AMENDMENTS AS WELL. IF YOU DO NOT AGREE WITH THESE TERMS AND CONDITIONS, PLEASE DO NOT ACCESS THIS WEBSITE.


Unauthorized use of J.P. Morgan's websites and systems including but not limited to unauthorized entry into J.P. Morgan's systems, misuse of passwords, or misuse of any information posted to a site, is strictly prohibited.


You acknowledge that J.P. Morgan may disclose and transfer any information that you provide through this website to (i) any company within the J.P. Morgan group, its affiliates agents or information providers; (ii) to any other person or entity with your consent; or (iii) if we have a right or duty to disclose or are permitted or compelled to so disclose such information by law. You consent to the transmission, transfer or processing of such information to, or through, any country in the world, as we deem necessary or appropriate, and by using and providing information through this website you agree to such transfers. Any information about you that we provide through this website to third parties will comply with applicable law within the various regions.


Use of this website may be monitored, tracked and recorded. Anyone using this website expressly consents to such monitoring, tracking and recording. You are responsible for being familiar with the current version of these Terms and Conditions posted on the Website during each session


Authorized Users and, Authorized

The information on this website is intended to be accessed exclusively by Institutional Investors, as defined in each region. This website is not directed to any person in any jurisdiction where (by reason of that person's nationality, residence or otherwise) the publication or availability of this website is prohibited. Persons in respect of whom such prohibitions apply must not access this website. It is the responsibility of any persons who access the information contained herein to observe all applicable laws and regulations of their relevant jurisdiction. By proceeding, you are representing and warranting that the applicable laws and regulations of your jurisdiction allow you to access the information.


Authorized Use - No solicitations

The information contained in this website does not constitute a distribution, an offer to sell or the solicitation of an offer to buy any securities, nor is the information directed at any jurisdiction in which such offer, sale or recommendation is not authorized.


Authorized Use - No investment recommendations or professional advice

The information contained in this website does not constitute investment advice. An investment in strategies mentioned in this website may not be suitable for all investors and if you are unclear about any of the information on this website, please consult a J.P. Morgan Asset Management representative.


Content and Downloading Disclaimers

We believe that the information contained on the website is accurate as at the date of publication, however no warranty is made as to the accuracy, suitability, usefulness, reliability or completeness of any such information and no liability in respect of any errors or omissions (including any third party liability) is accepted by us or any of our directors or employees. The use of this website and the delivery ("Delivery") of information or documents by us or our agents through this website or via electronic mail or other modes of delivery, is at your own risk. No warranty is given that the content of this website and the Delivery (including any such information) will be error free or that this website or any servers that operate it or the Delivery are free of computer viruses or other harmful components.


Reasonable precautions have been taken to ensure that website content, including account information and pricing data, are complete and accurate. However, due to the nature of information delivery technology and the necessity of using multiple data sources, including third party content, we are unable to assure the accuracy of the data you access through this website. Website content is presented only as of the date published or indicated and may be superseded by subsequent market events or other reasons. We have no duty to update this website or any website content. We shall not be liable to you or any third party for any damages arising from any actions or investment decisions taken by you based on the accuracy (or otherwise) of the data presented through this website. We (including our directors and employees) may or may not have a position in or with respect to the securities mentioned herein.


Third Party Content Providers, Sites, Referrals, Hyperlink Policy and Disclaimers

For informational or educational purposes, or as a service and convenience to you, this website may provide referral information, third party content or live links to an unaffiliated third party and their websites, including companies that have a relationship with us.


Our decision to provide referral information to a third party or to pass on an offer made by a third party vendor or to provide a link from our website to a third party website is not an endorsement of the third party, their products or services, or their website accessed through any such links. We are not responsible for the opinions, ideas, products, information, or services offered at such sites. We make no representations or warranties, express or implied, as to third party products, services, content, tools, information and website, and do not guarantee their accuracy, timeliness, completeness, reliability, suitability or usefulness for any particular purpose as we have no control over the content on such non proprietary websites. We advise and encourage you to do your own research and make your own assessment. We do not warrant that such site or content is free from any claims of copyright, trademark, or other infringement of the rights of third parties or that such site or content is devoid of viruses or other contamination. Your access, use and reliance upon such content, products or services is at your own risk.


Links to non-J.P. Morgan Websites are provided solely as pointers to information on topics that may be useful to users of the J.P. Morgan Websites, and J.P. Morgan has no control over the content on such non-J.P. Morgan Websites. If you choose to link to a Website not controlled by J.P. Morgan, J.P. Morgan makes no warranties, either express or implied, concerning the content of such site, including the accuracy, completeness, reliability, or suitability thereof for any particular purpose, nor does J.P. Morgan warrant that such site or content is free from any claims of copyright, trademark, or other infringement of the rights of third parties or that such site or content is devoid of viruses or other contamination. J.P. Morgan does not guarantee the authenticity of documents on the Internet. Links to non-J.P. Morgan sites do not imply any endorsement of or responsibility for the opinions, ideas, products, information, or services offered at such sites, or any representation regarding the content at such sites.


Copyright notices

The works of authorship contained in the jpmorganfleming.com/am website (the "Website"), including but not limited to all design, text, sound recordings, and images, are owned, except as otherwise expressly stated, by JPMorgan Chase & Co. or one of its subsidiaries, ("JPMorgan"). Except as otherwise expressly stated herein, they may not be copied, transmitted, displayed, performed, distributed (for compensation or otherwise), licensed, altered, framed, stored for subsequent use, or otherwise used in whole or in part in any manner without J.P. Morgan's prior written consent.


Trademark notices

"J.P. Morgan," "JPMorgan Chase," "J.P. Morgan Asset Management," the JPMorgan Chase logo and the Octagon Symbol are trademarks of JPMorgan Chase & Co. Other featured words or symbols, used to identify the source of goods and services, may be the trademarks of their respective owners.


Web content and materials

The information on this Website is for information purposes only. It is believed to be reliable, but J.P. Morgan does not warrant its completeness, timeliness or accuracy. The information on the Website is not intended as an offer or solicitation for the purchase of JPMorgan Chase stock, any other security or any financial instrument.


The information and materials contained in this Website - and the terms and conditions of the access to and use of such information and materials - are subject to change without notice. Products and services described, as well as associated fees, charges, interest rates, and balance requirements may differ among geographic locations. Not all products and services are offered at all locations.


The chase.com website, the jpmorganchase.com website or other J.P. Morgan websites contain separate terms and conditions, which are in addition to these terms and conditions. In the event of a conflict, the additional terms and conditions will govern for those sections or pages. In addition, certain portions or pages of this Website are subject to additional disclosures and disclaimers. In the event of a conflict between those disclosures and disclaimers and these terms and conditions, the additional disclosures and disclaimers will govern for those portions or pages.


You agree that (i) you will not engage in any activities related to the Website that are contrary to applicable law, regulation or the terms of any agreements you have with J.P. Morgan and (ii) in circumstances where locations of the Website require identification for access, you will establish commercially reasonable security procedures and controls to limit access to your password or other identifying information to authorized individuals.


J.P. Morgan or its suppliers may discontinue or make changes in the information, products, or services described herein at any time without prior notice to you and without any liability to you. Any dated information is published as of its date only, and J.P. Morgan does not undertake any obligation or responsibility to update or amend any such information. J.P. Morgan reserves the right to terminate any or all Website information, offerings or transmissions without prior notice to the user. Furthermore, by offering this Website and information, products, or services via the Website, no distribution or solicitation is made by J.P. Morgan to any Website or such information, products, or services in jurisdictions where the provision of the Website and such information, products, services is prohibited by law.


Suitability and Appropriateness

Securities or financial instruments mentioned in the Website may not be suitable or appropriate for all investors or in all geographical areas. Your particular needs, investment objectives and financial situation were not taken into account in the preparation of this Website and the materials contained herein. You must make your own independent decisions regarding any securities or financial instruments mentioned herein. The fact that JPMorgan has made available to you through the Website, investment opinions and other information constitutes neither a recommendation that you enter into a particular transaction nor a representation that any financial instrument is suitable or appropriate for you. You should consider whether an investment strategy or the purchase or sale of any product is appropriate for you in the light of your particular investment needs, objectives and financial circumstances.


Potential disruption of service

  • Access to the Website may from time to time be unavailable, delayed, limited or slowed due to, among other things:
  • hardware failure, including among other things failures of computers (including your own computer), servers, networks, telecommunication lines and connections, and other electronic and mechanical equipment;
  • software failure, including among other things, bugs, errors, viruses, configuration problems, incompatibility of systems, utilities or applications, the operation of firewalls or screening programs, unreadable codes, or irregularities within particular documents or other content;
  • overload of system capacities;
  • damage caused by severe weather, earthquakes, wars, insurrection, riots, civil commotion, act of God, accident, fire, water damage, explosion, mechanical breakdown or natural disasters;
  • interruption (whether partial or total) of power supplies or other utility of service;
  • strike or other stoppage (whether partial or total) of labor;
  • governmental or regulatory restrictions, exchange rulings, court or tribunal orders or other human intervention; or
  • any other cause (whether similar or dissimilar to any of the foregoing) whatsoever beyond the control of J.P. Morgan.

If access to this Website is unavailable, delayed or limited, or if this Website does not operate quickly and efficiently, you may be unable to transmit your instructions for transactions and other matters, or such instructions may not be promptly executed or you may be unable to retrieve information on a timely basis. If your operations are dependent on such communications with J.P. Morgan, and such communications are disrupted or delayed, you may suffer losses.


Limitation of Liability

BECAUSE OF THE POSSIBILITY OF HUMAN AND MECHANICAL ERROR AS WELL AS OTHER FACTORS, THE WEBSITE (INCLUDING ALL INFORMATION AND MATERIALS CONTAINED ON THE WEBSITE) IS PROVIDED "AS IS" AND "AS AVAILABLE". WE, OUR AFFILIATES, AND ANY THIRD PARTY DATA PROVIDERS:

  • ARE NOT PROVIDING ANY WARRANTIES AND REPRESENTATIONS REGARDING THE WEBSITE;
  • DISCLAIM ALL WARRANTIES AND REPRESENTATIONS OF ANY KIND WITH REGARD TO THE WEBSITE, INCLUDING ANY IMPLIED WARRANTIES OF MERCHANTABILITY, NON-INFRINGEMENT OF THIRD PARTY RIGHTS, FREEDOM FROM VIRUSES OR OTHER HARMFUL CODE, OR FITNESS FOR A PARTICULAR PURPOSE;
  • DO NOT WARRANT THE ACCURACY, ADEQUACY, OR COMPLETENESS OF THE INFORMATION AND MATERIALS CONTAINED ON THE WEBSITE AND EXPRESSLY DISCLAIMS LIABILITY FOR ERRORS OR OMISSIONS IN THE MATERIALS AND INFORMATION; AND
  • WILL NOT BE LIABLE FOR ANY DELAY, DIFFICULTY IN USE, COMPUTER VIRUSES, MALICIOUS CODE OR OTHER DEFECT IN THIS WEBSITE, ANY INCOMPATIBILITY BETWEEN THE WEBSITE AND THE USER'S FILES AND THE USER'S BROWSER OR OTHER SITE ACCESSING PROGRAM, OR ANY OTHER PROBLEMS EXPERIENCED BY THE USER DUE TO CAUSES BEYOND OUR CONTROL.

NO LICENSE TO THE USER IS IMPLIED IN THESE DISCLAIMERS. NOTHING HEREIN SHALL BE CONSTRUED AS LIMITING OR REDUCING OUR RESPONSIBILITIES AND OBLIGATIONS TO CLIENTS IN ACCORDANCE WITH APPLICABLE LAWS AND REGULATIONS.


UNDER NO CIRCUMSTANCES WILL WE BE LIABLE FOR ANY LOST PROFITS, LOST OPPORTUNITY OR ANY INDIRECT, CONSEQUENTIAL, INCIDENTAL, SPECIAL, PUNITIVE, OR EXEMPLARY DAMAGES ARISING OUT OF ANY USE OF OR INABILITY TO USE THE WEBSITE OR ANY PORTION THEREOF, REGARDLESS OF WHETHER WE HAVE BEEN APPRISED OF THE LIKELIHOOD OF SUCH DAMAGES OCCURRING AND REGARDLESS OF THE FORM OF ACTION, WHETHER IN CONTRACT, WARRANTY, TORT (INCLUDING NEGLIGENCE), STRICT LIABILITY, OR OTHERWISE.


Legal entity disclosure

J.P. Morgan Asset Management is the marketing name for the asset management business of JPMorgan Chase & Co. and its subsidiaries and affiliates worldwide. This website is issued in the United States, by J.P. Morgan Investment Management Inc. or J.P. Morgan Alternative Asset Management, Inc., both regulated by the Securities and Exchange Commission; in Latin America, for intended recipients’ use only, by local J.P. Morgan entities, as the case may be; in Canada, for institutional clients’ use only, by JPMorgan Asset Management (Canada) Inc., which is a registered Portfolio Manager and Exempt Market Dealer in all Canadian provinces and territories except the Yukon and is also registered as an Investment Fund Manager in British Columbia, Ontario, Quebec and Newfoundland and Labrador. In the United Kingdom, by JPMorgan Asset Management (UK) Limited, which is authorized and regulated by the Financial Conduct Authority; in other European jurisdictions, by JPMorgan Asset Management (Europe) S.à r.l. In Asia Pacific (“APAC”), by the following issuing entities and in the respective jurisdictions in which they are primarily regulated: JPMorgan Asset Management (Asia Pacific) Limited, or JPMorgan Funds (Asia) Limited, or JPMorgan Asset Management Real Assets (Asia) Limited, each of which is regulated by the Securities and Futures Commission of Hong Kong; JPMorgan Asset Management (Singapore) Limited (Co. Reg. No. 197601586K), which this advertisement or publication has not been reviewed by the Monetary Authority of Singapore; JPMorgan Asset Management (Taiwan) Limited; JPMorgan Asset Management (Japan) Limited, which is a member of the Investment Trusts Association, Japan, the Japan Investment Advisers Association, Type II Financial Instruments Firms Association and the Japan Securities Dealers Association and is regulated by the Financial Services Agency (registration number “Kanto Local Finance Bureau (Financial Instruments Firm) No. 330”); in Australia, to wholesale clients only as defined in section 761A and 761G of the Corporations Act 2001 (Commonwealth), by JPMorgan Asset Management (Australia) Limited (ABN 55143832080) (AFSL 376919).


Governing law

In the event any of the terms or provisions of these Terms and Conditions shall be held to be unenforceable, the remaining terms and provisions shall be unimpaired and the unenforceable term or provision shall be replaced by such enforceable term or provision as comes closest to the intention underlying the unenforceable term or provision. These Terms and Conditions shall be subject to any other agreements you have entered into with J.P. Morgan.


The user's access to and use of the Website, and the terms of this disclaimer are governed by the laws of the various jurisdictions listed above.

Privacy Policy

Your privacy is important to us. Different privacy principles may apply depending on how you interact with us, the financial products or services you may ultimately obtain from us or the jurisdiction in which we are doing business with you. You can access these Privacy Notices by going to this page: https://am.jpmorgan.com/global/privacy

Click the "Accept" button below if you have read, understood and agree to abide by the contents of this page; otherwise, please click "Decline" to leave the website.

Accessibility

If you are a person with a disability and need additional support in viewing the material, please call us at 1-800-343-1113 for assistance.


Click the "Accept" button below if you have read, understood and agree to abide by the contents of this page; otherwise, please click "Decline" to leave the website.

Please read through the disclaimer before entering the site
AcceptDecline
Skip to main content
JP Morgan Asset Management - Home
Log in
Log in
Hello
  • Accounts & Documents
    Digital servicing offering for active investors
  • My Collections
    View saved content and presentation slides
  • Log out
  • Products
    Overview

    Investment Vehicles

    • ETFs
    • Commingled Funds
    • Mutual Funds
  • Investment Strategies
    Overview

    Investment Options

    • Alternatives
    • Beta Strategies
    • Equities
    • Fixed Income
    • Global Liquidity
    • Multi-Asset Solutions
    • Commingled Funds

    Capabilities & Solutions

    • ETFs
    • Global Insurance Solutions
    • Liability-Driven Investing
    • Pension Strategy & Analytics
    • Outsourced CIO
    • Retirement Plan Solutions
    • Target Date Strategies
    • Retirement Income
    • Sustainable investing
  • Insights
    Overview

    Market Insights

    • Market Insights Overview
    • Eye on the Market
    • Guide to the Markets
    • Guide to Investing in Asia
    • Guide to Alternatives
    • Market Updates

    Portfolio Insights

    • Portfolio Insights Overview
    • Alternatives
    • Asset Class Views
    • DB Insights
    • Equity
    • Fixed Income
    • Long-Term Capital Market Assumptions
    • Portfolio Strategy
    • Strategic Investment Advisory Group

    Retirement Insights

    • Retirement Insights Overview
    • Guide to Retirement
    • Retirement Hot Topics

    ETF Insights

    • ETF Insights Overview
    • Guide to ETFs
    • Monthly Active ETF Monitor
  • Resources
    Overview
    • Center for Investment Excellence Podcasts
    • Insights App
    • Library
    • Public Pension Plans
    • Endowments, Foundations, and Healthcare
    • Taft-Hartley
    • Market Response Center
    • Morgan Institutional
    • Artificial Intelligence
    • Webcasts
  • About Us
    Overview
    • Diversity, Opportunity & Inclusion
    • Spectrum: Our Investment Platform
    • Media Resources
    • Our Leadership Team
  • Contact us
  • Institutional Investors
  • United States
Hello
  • Accounts & Documents
    Digital servicing offering for active investors
  • My Collections
    View saved content and presentation slides
  • Log out
Log in
Search
Menu
Search
You are about to leave the site Close
J.P. Morgan Asset Management’s website and/or mobile terms, privacy and security policies don't apply to the site or app you're about to visit. Please review its terms, privacy and security policies to see how they apply to you. J.P. Morgan Asset Management isn’t responsible for (and doesn't provide) any products, services or content at this third-party site or app, except for products and services that explicitly carry the J.P. Morgan Asset Management name.
CONTINUE Go Back
  1. Dude, Where’s My Stuff?

  • LinkedIn Twitter Facebook Line WhatsApp
prod-0821-684585-eotm-supply-chain-mess-am-hero-2800x900

Dude, Where’s My Stuff

September 27, 2021

Michael Cembalest, Chairman of Market and Investment Strategy

LISTEN TO THE PODCAST

The global supply chain mess will require increased global vaccination and acquired immunity, semiconductor capacity expansion and the end of extraordinary housing/labor supports to resolve. We expect all three to occur over the next few months, leading to a global growth bounce in 2022

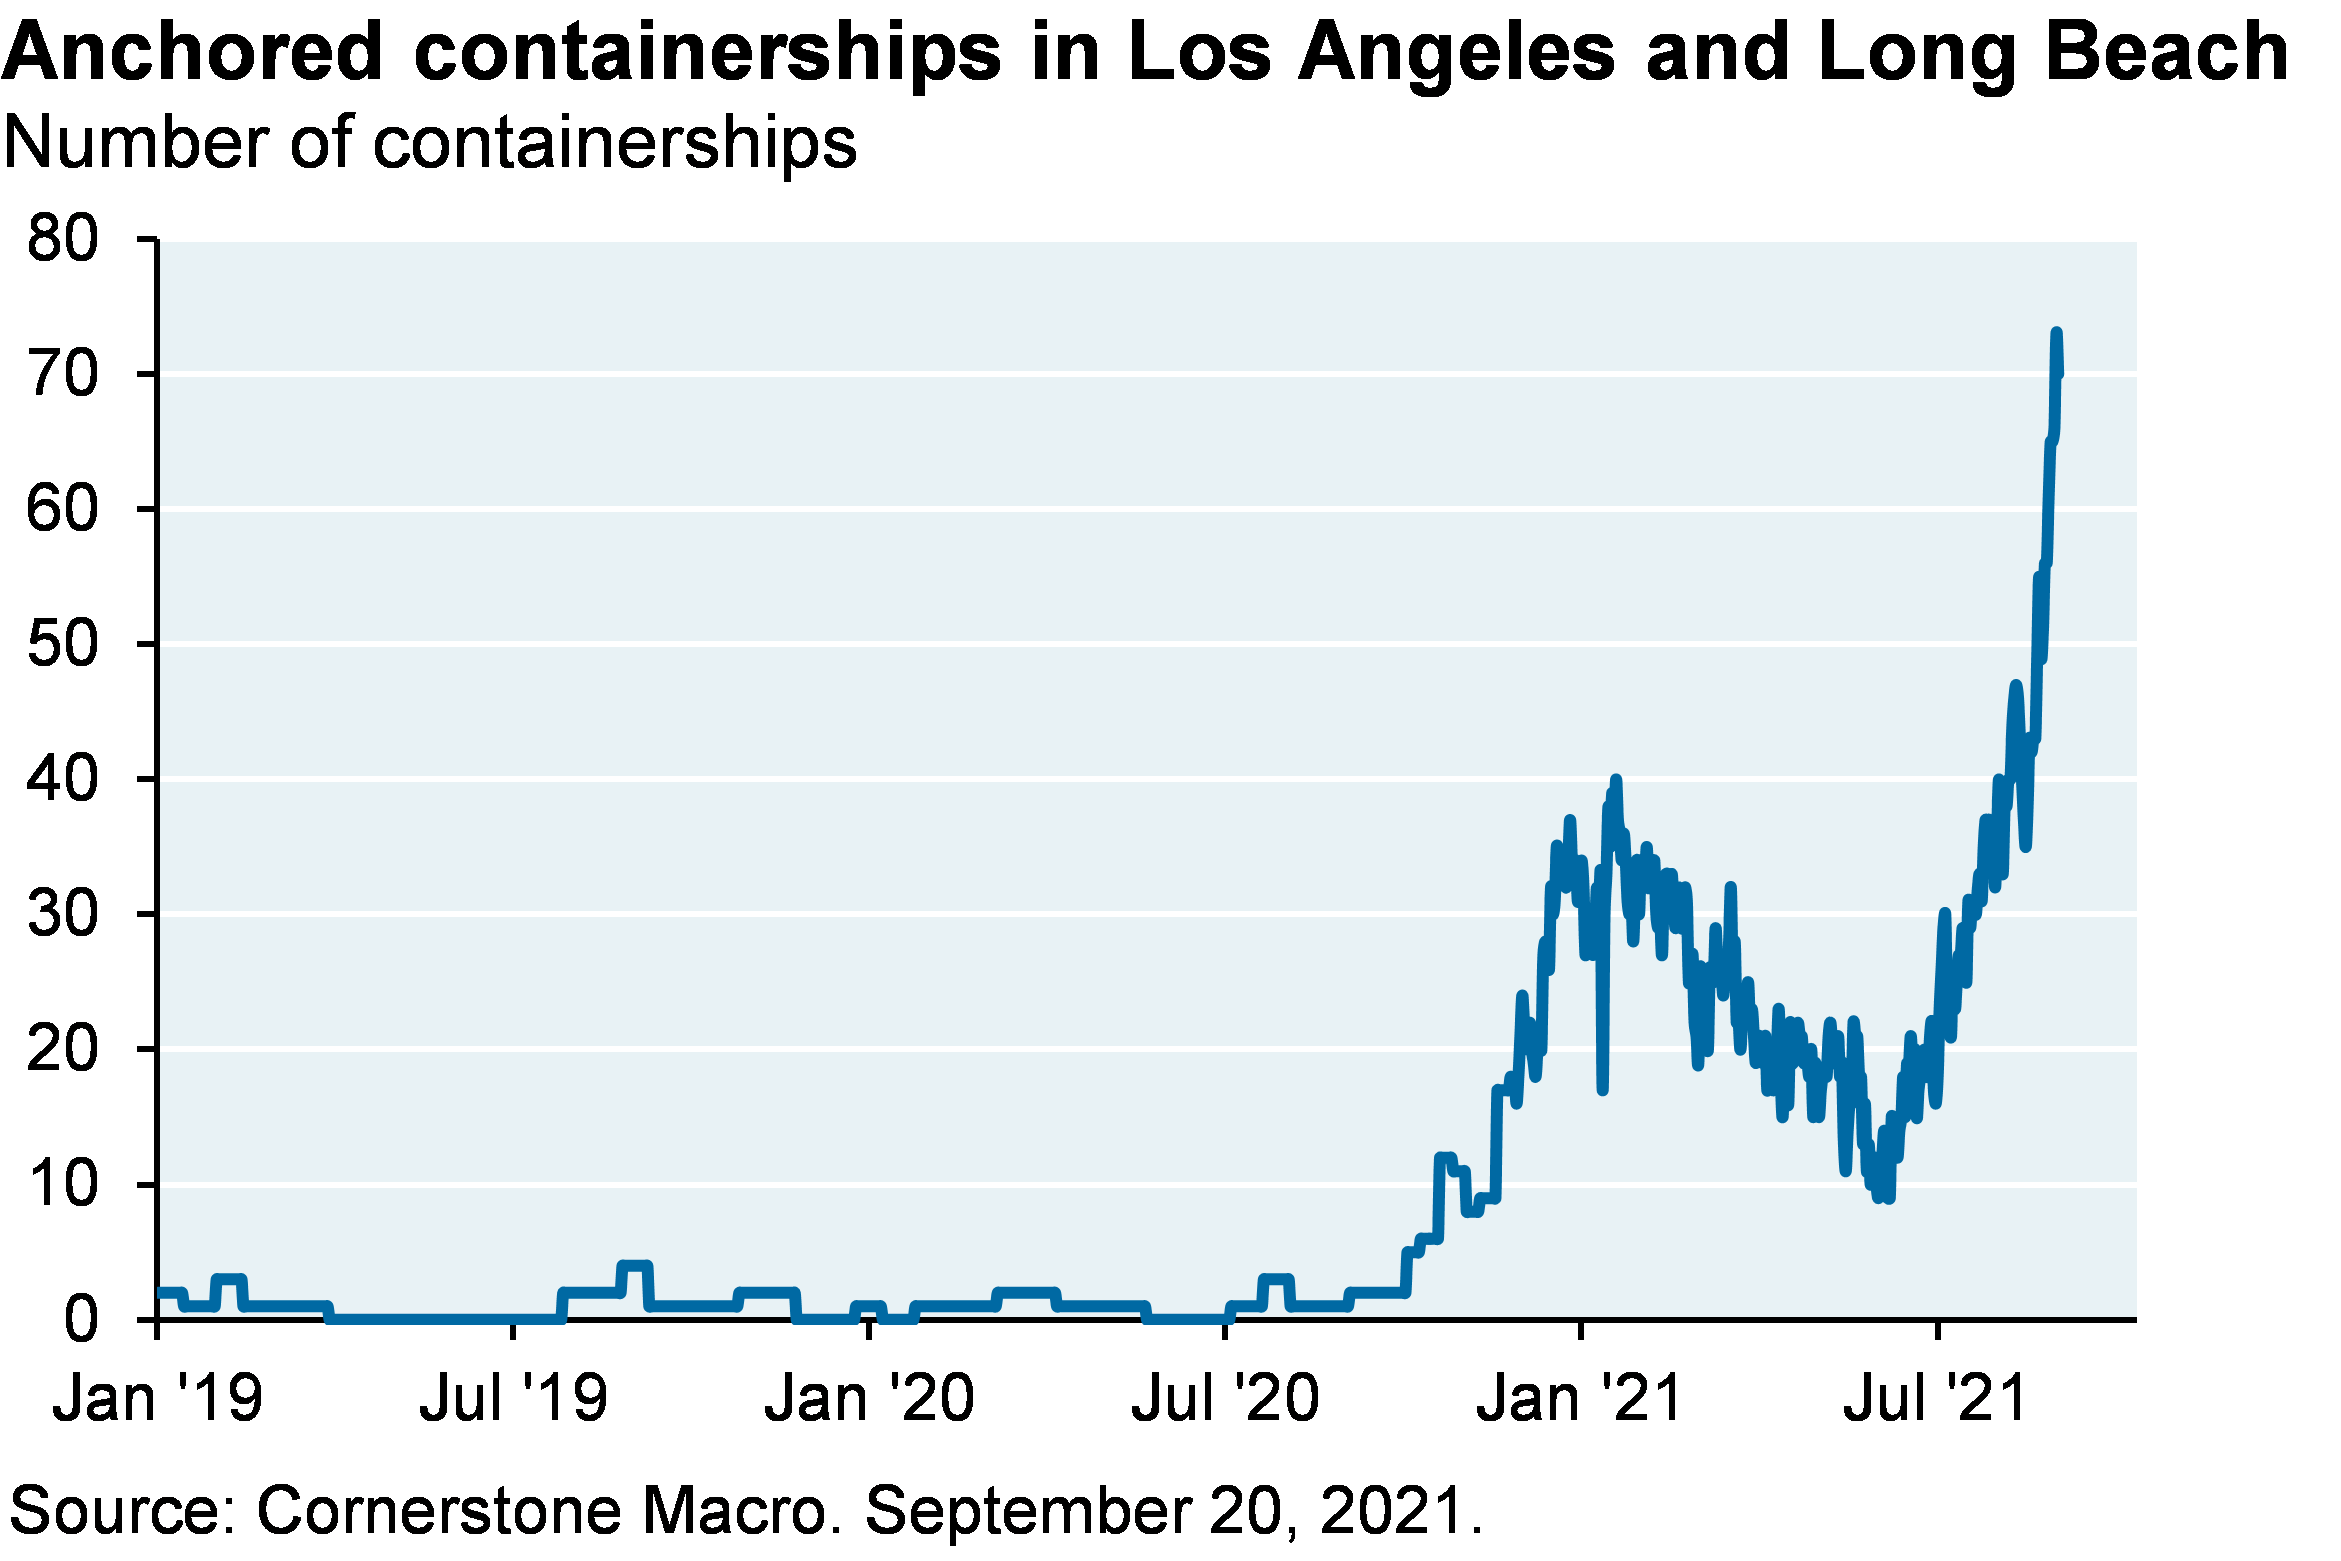
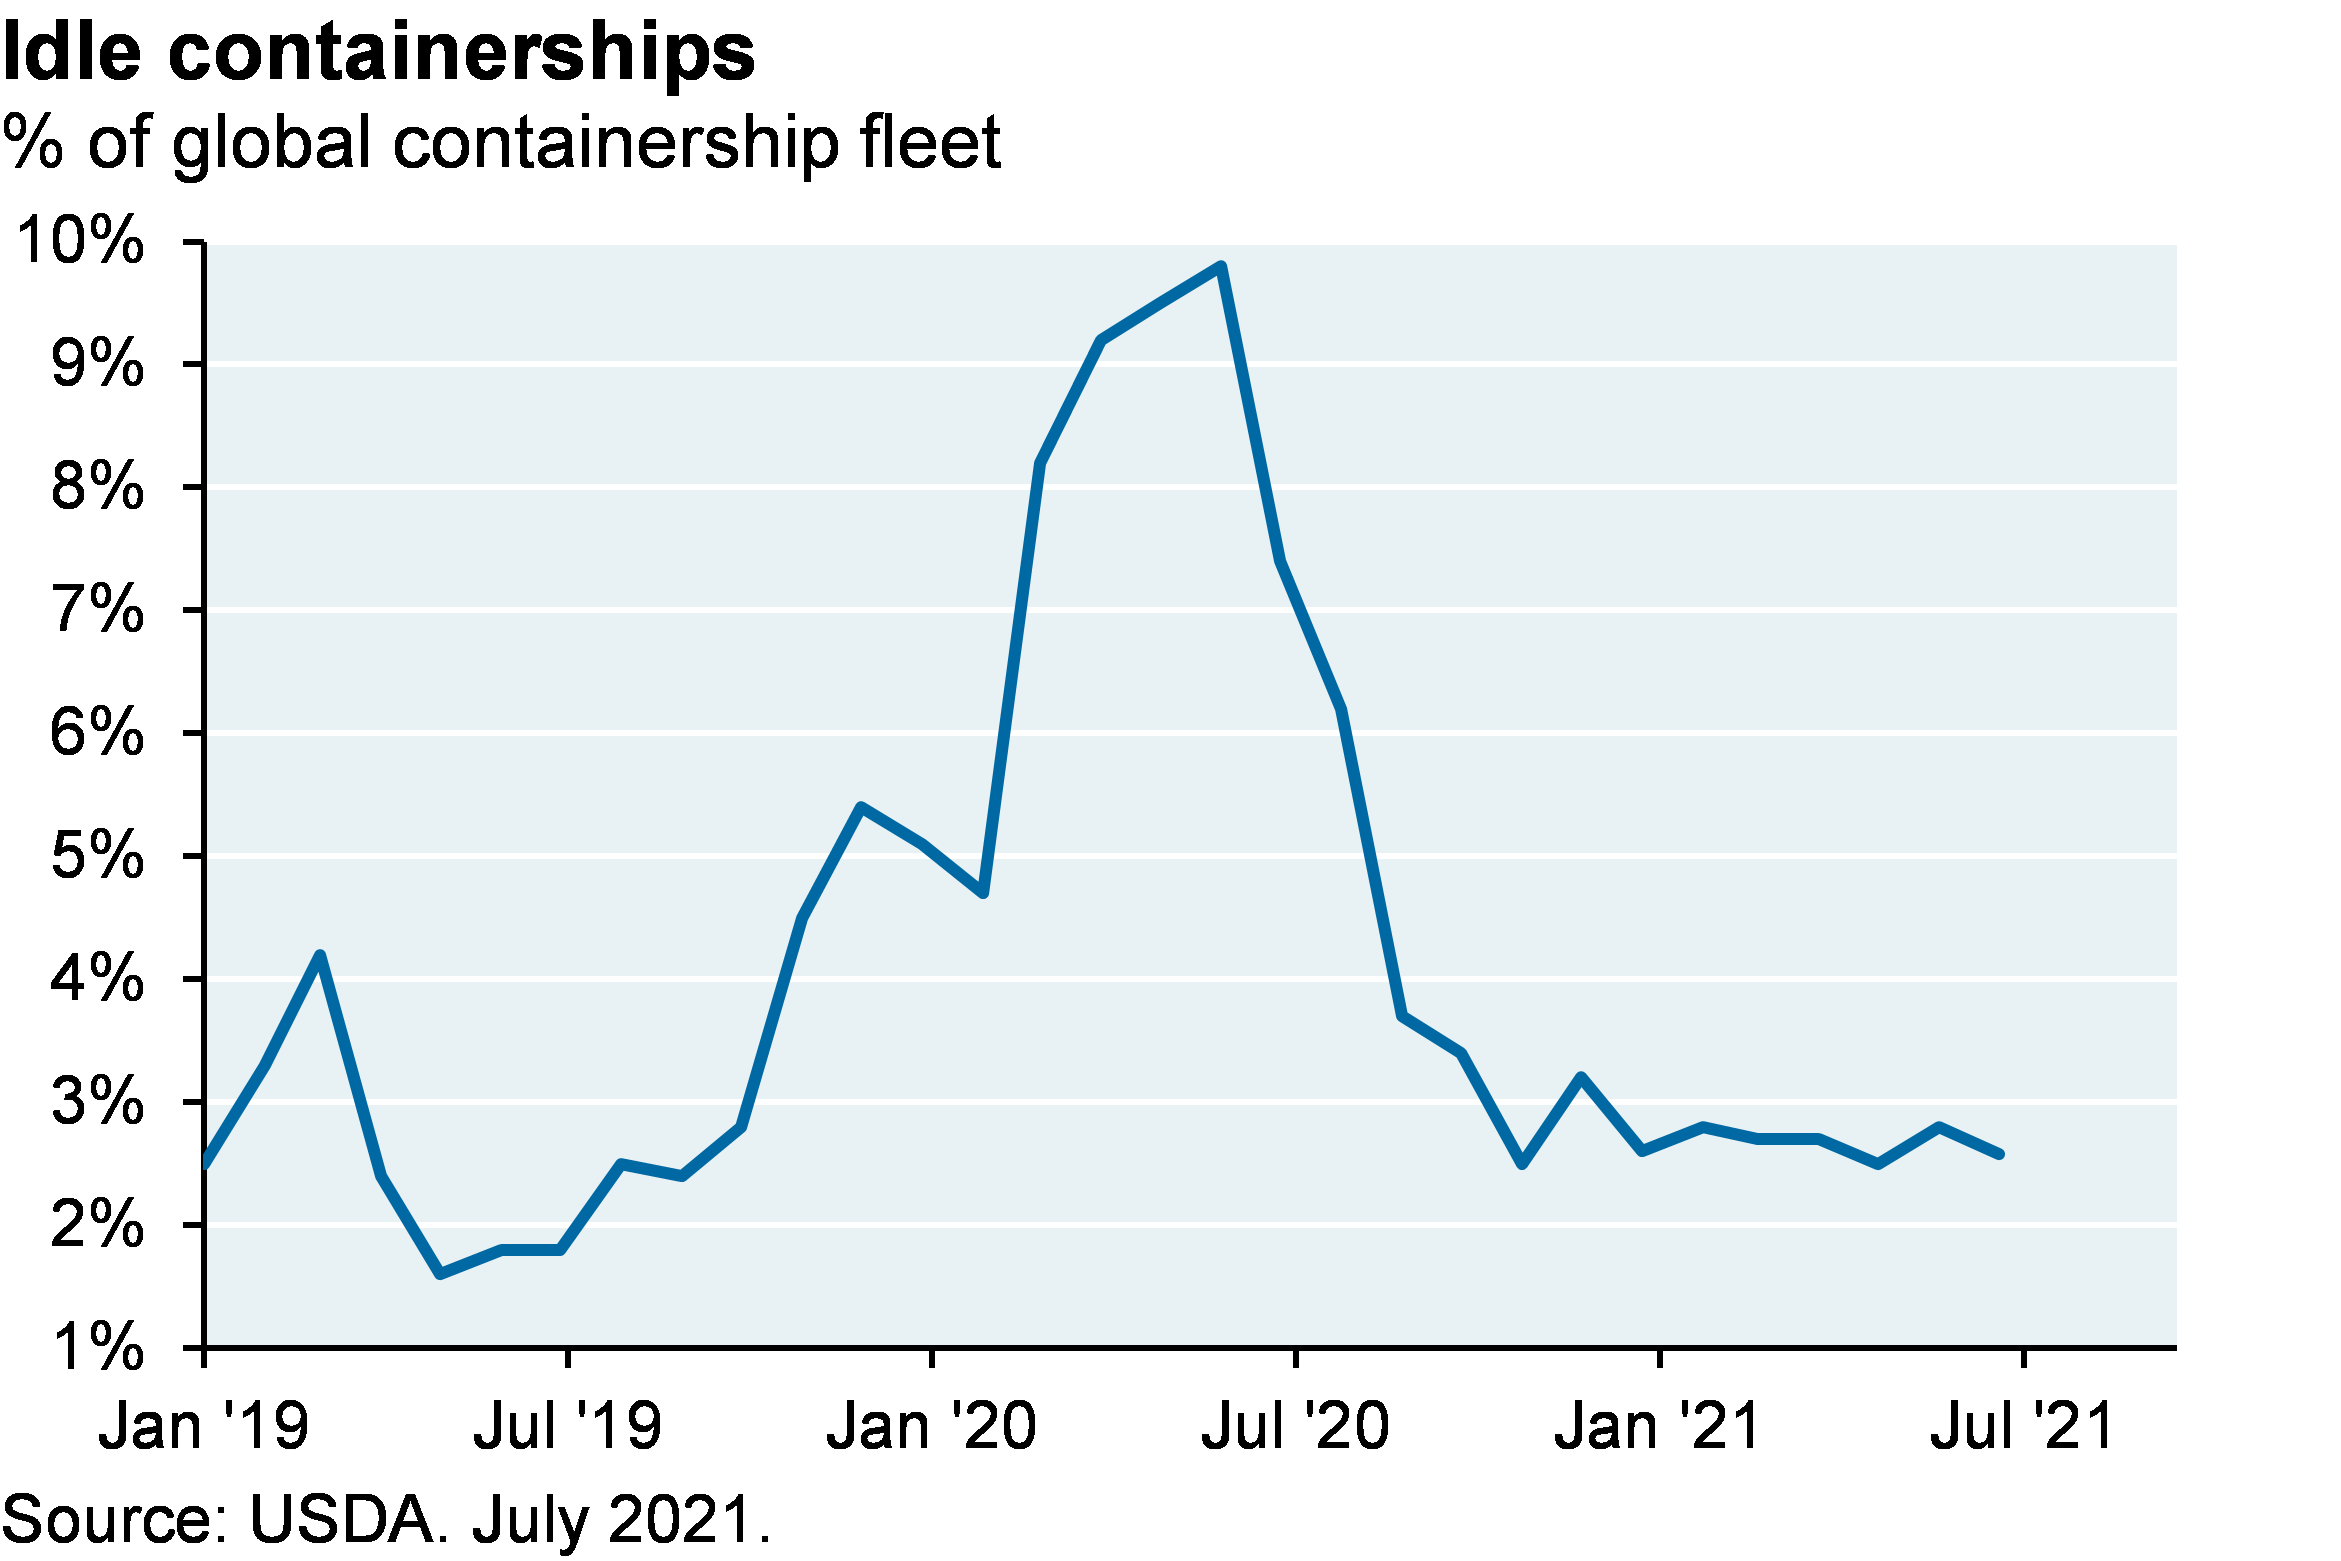
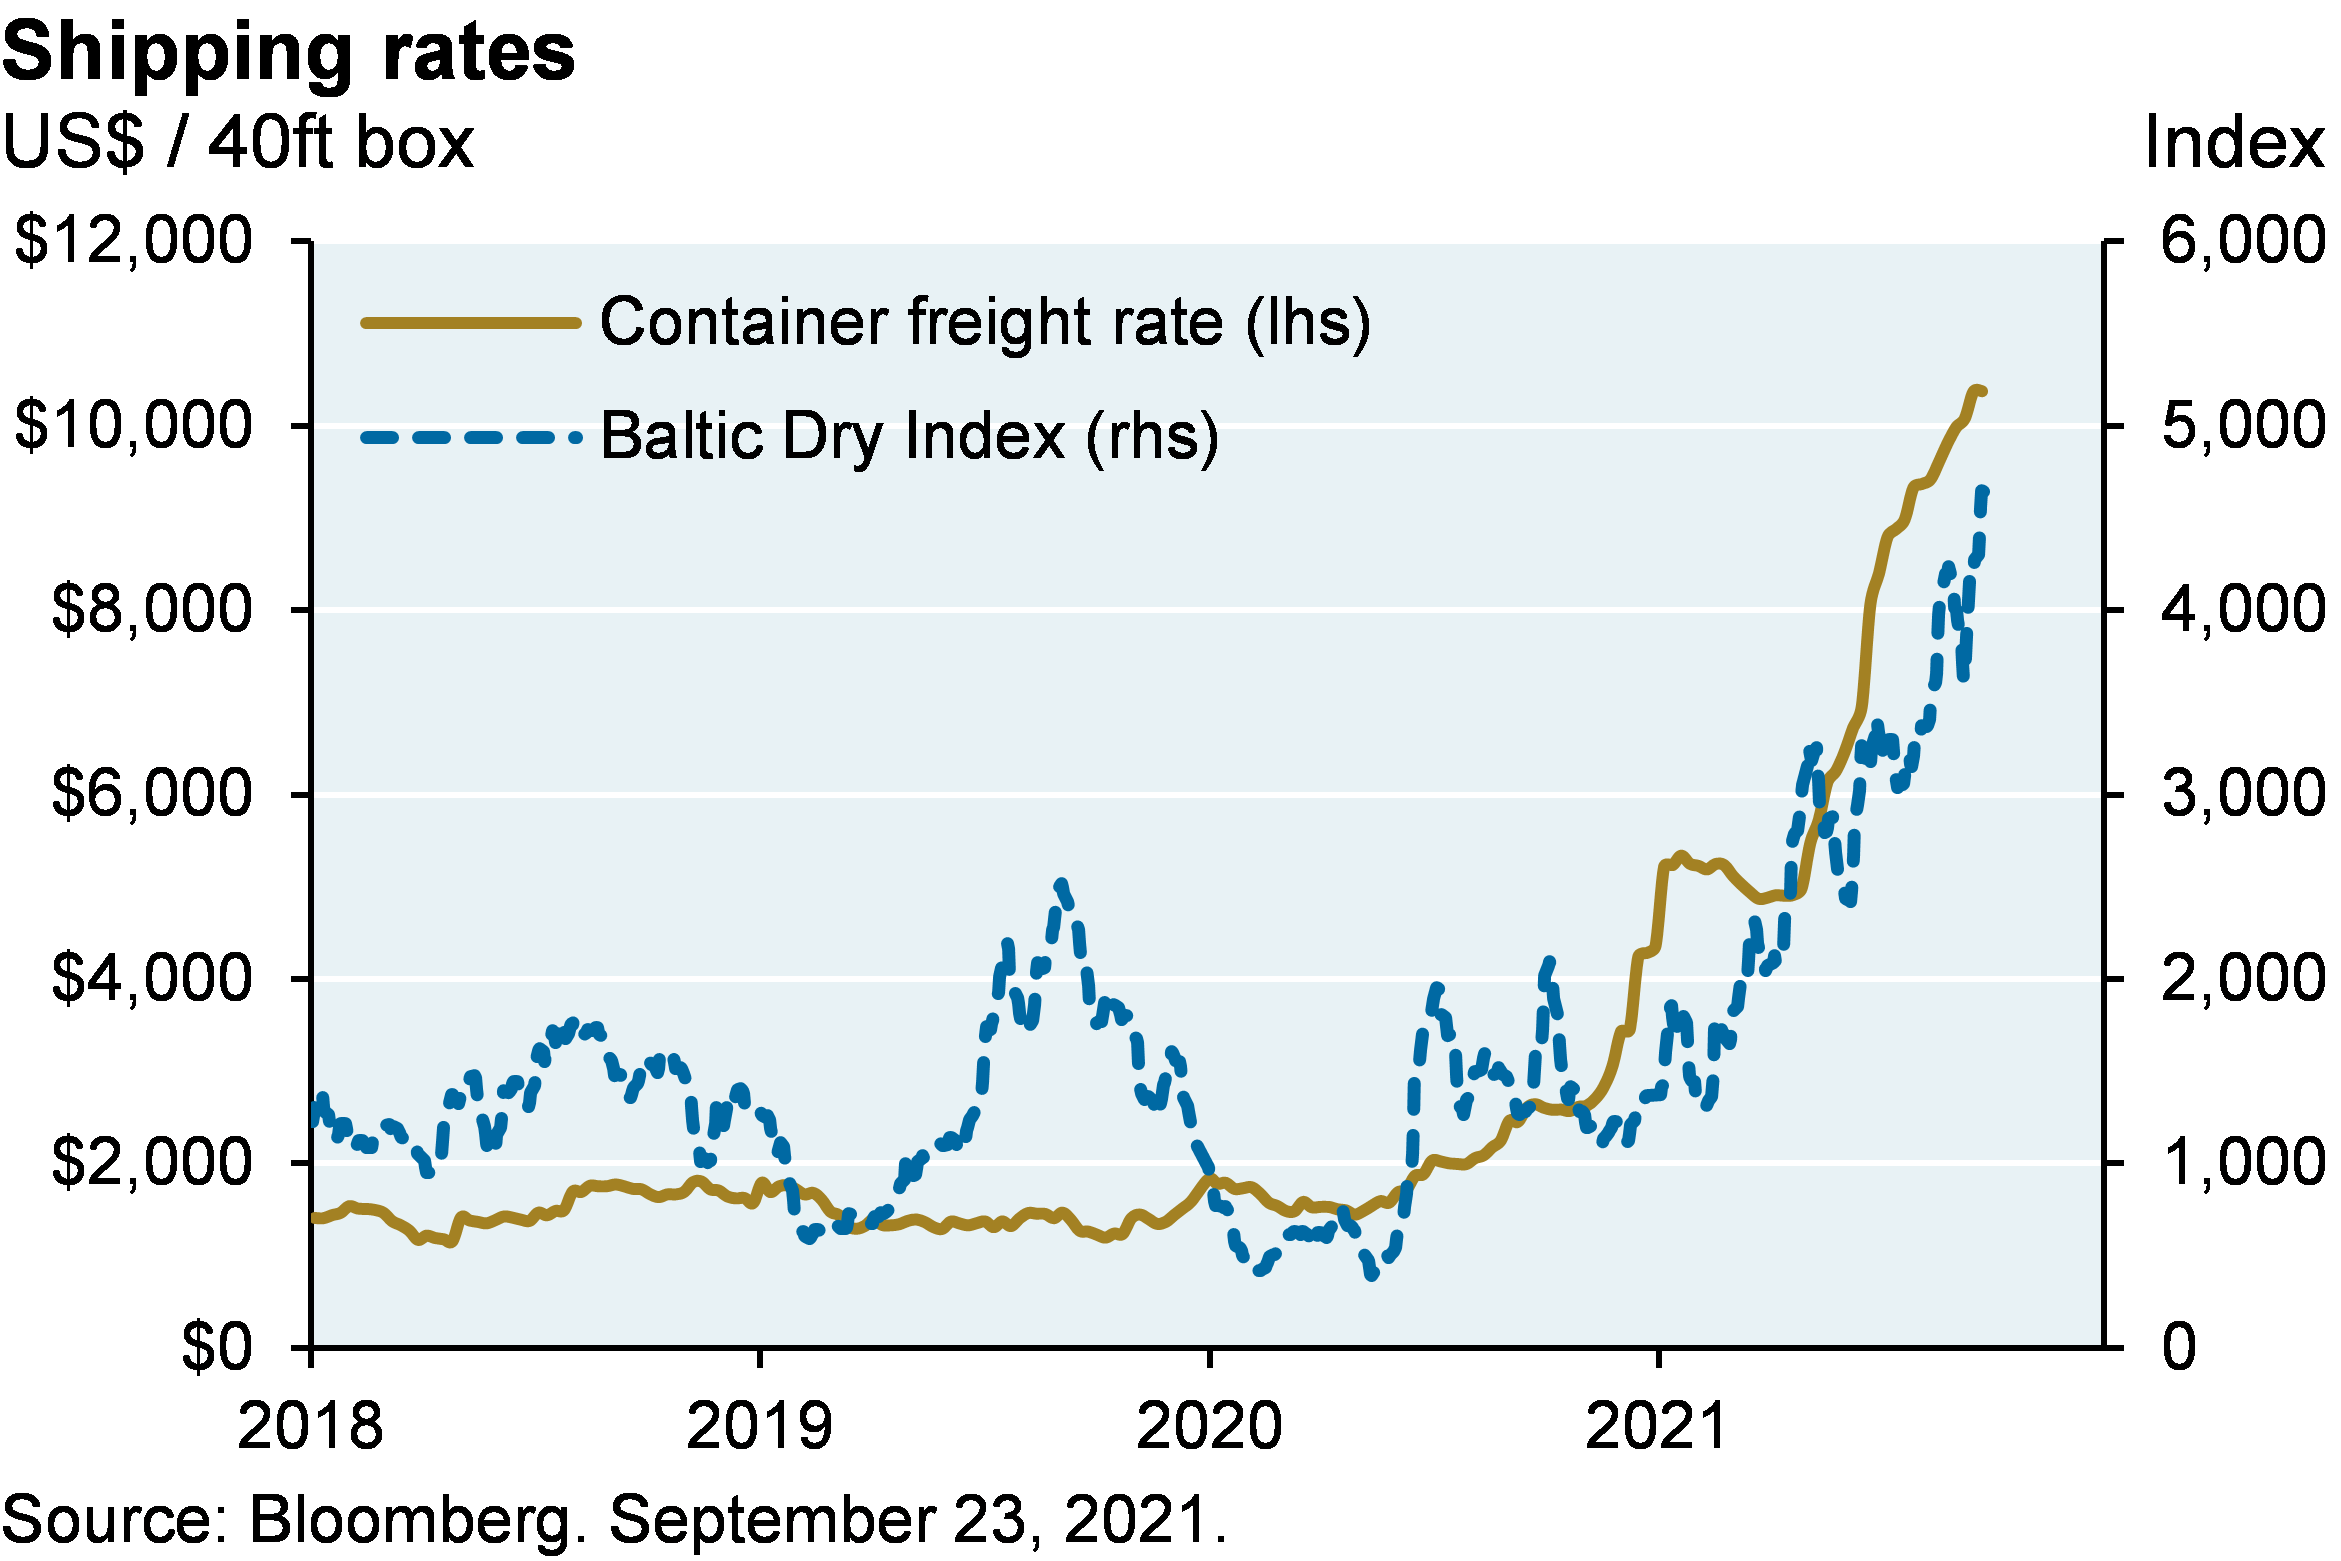
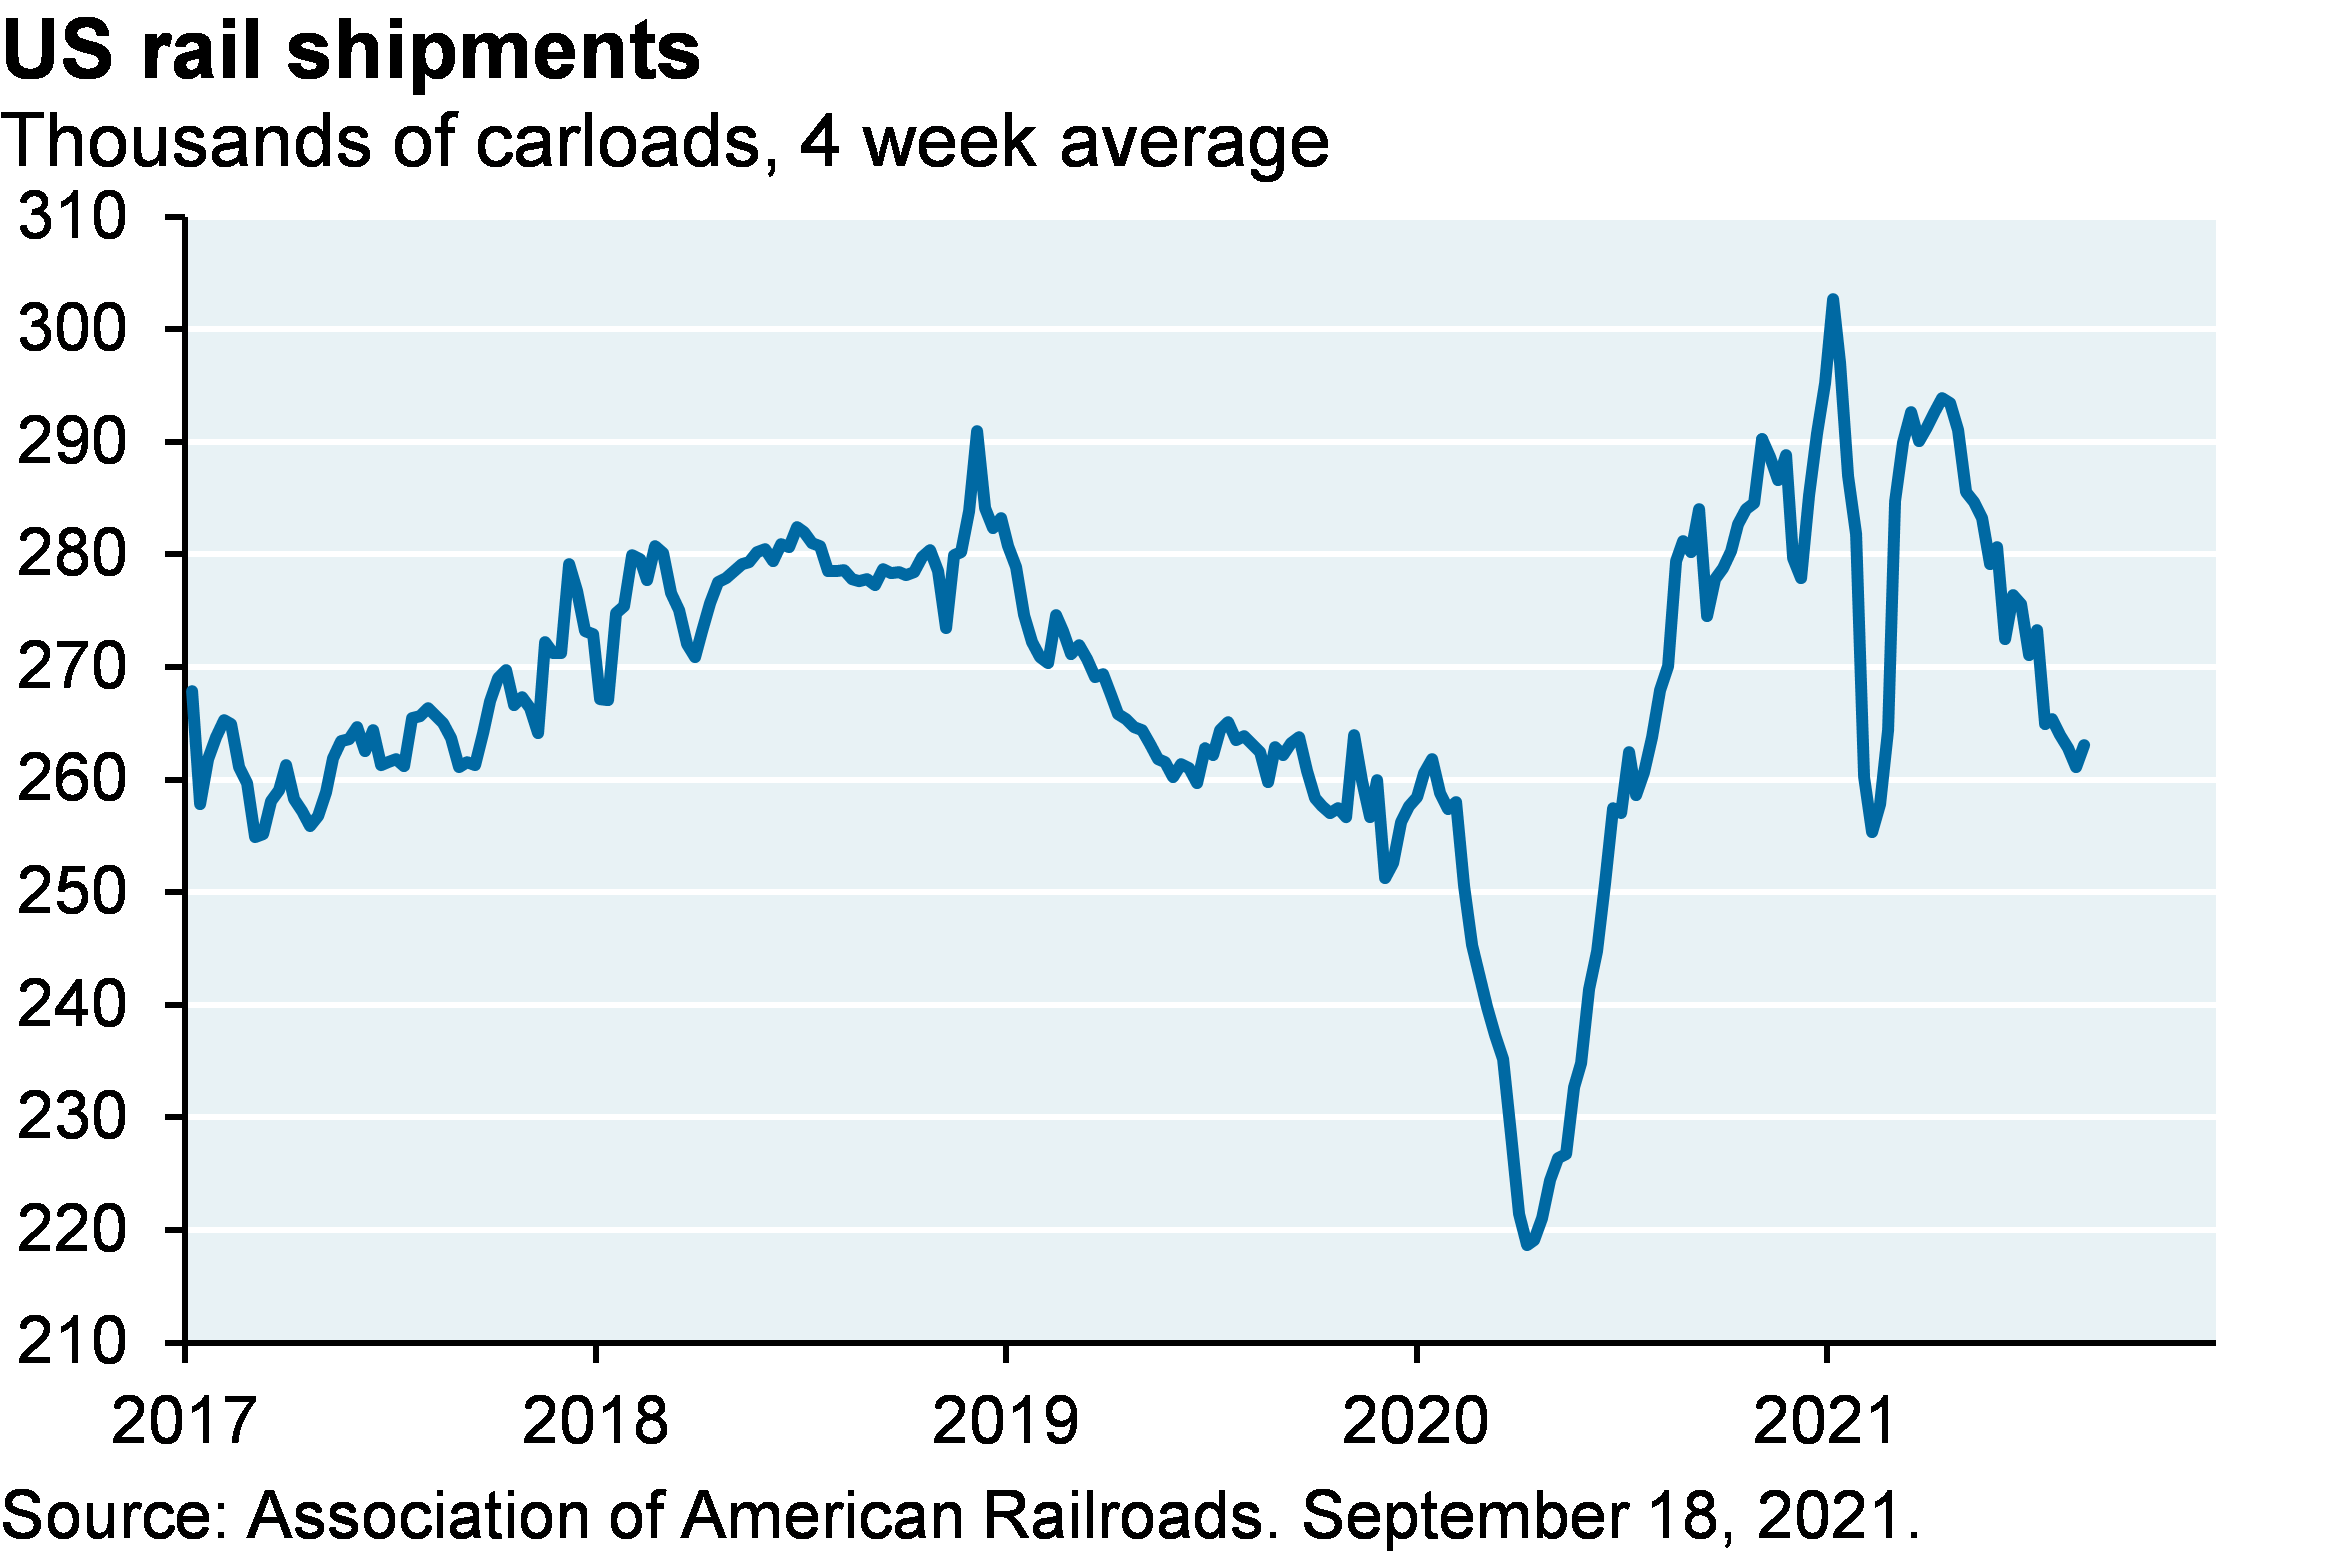
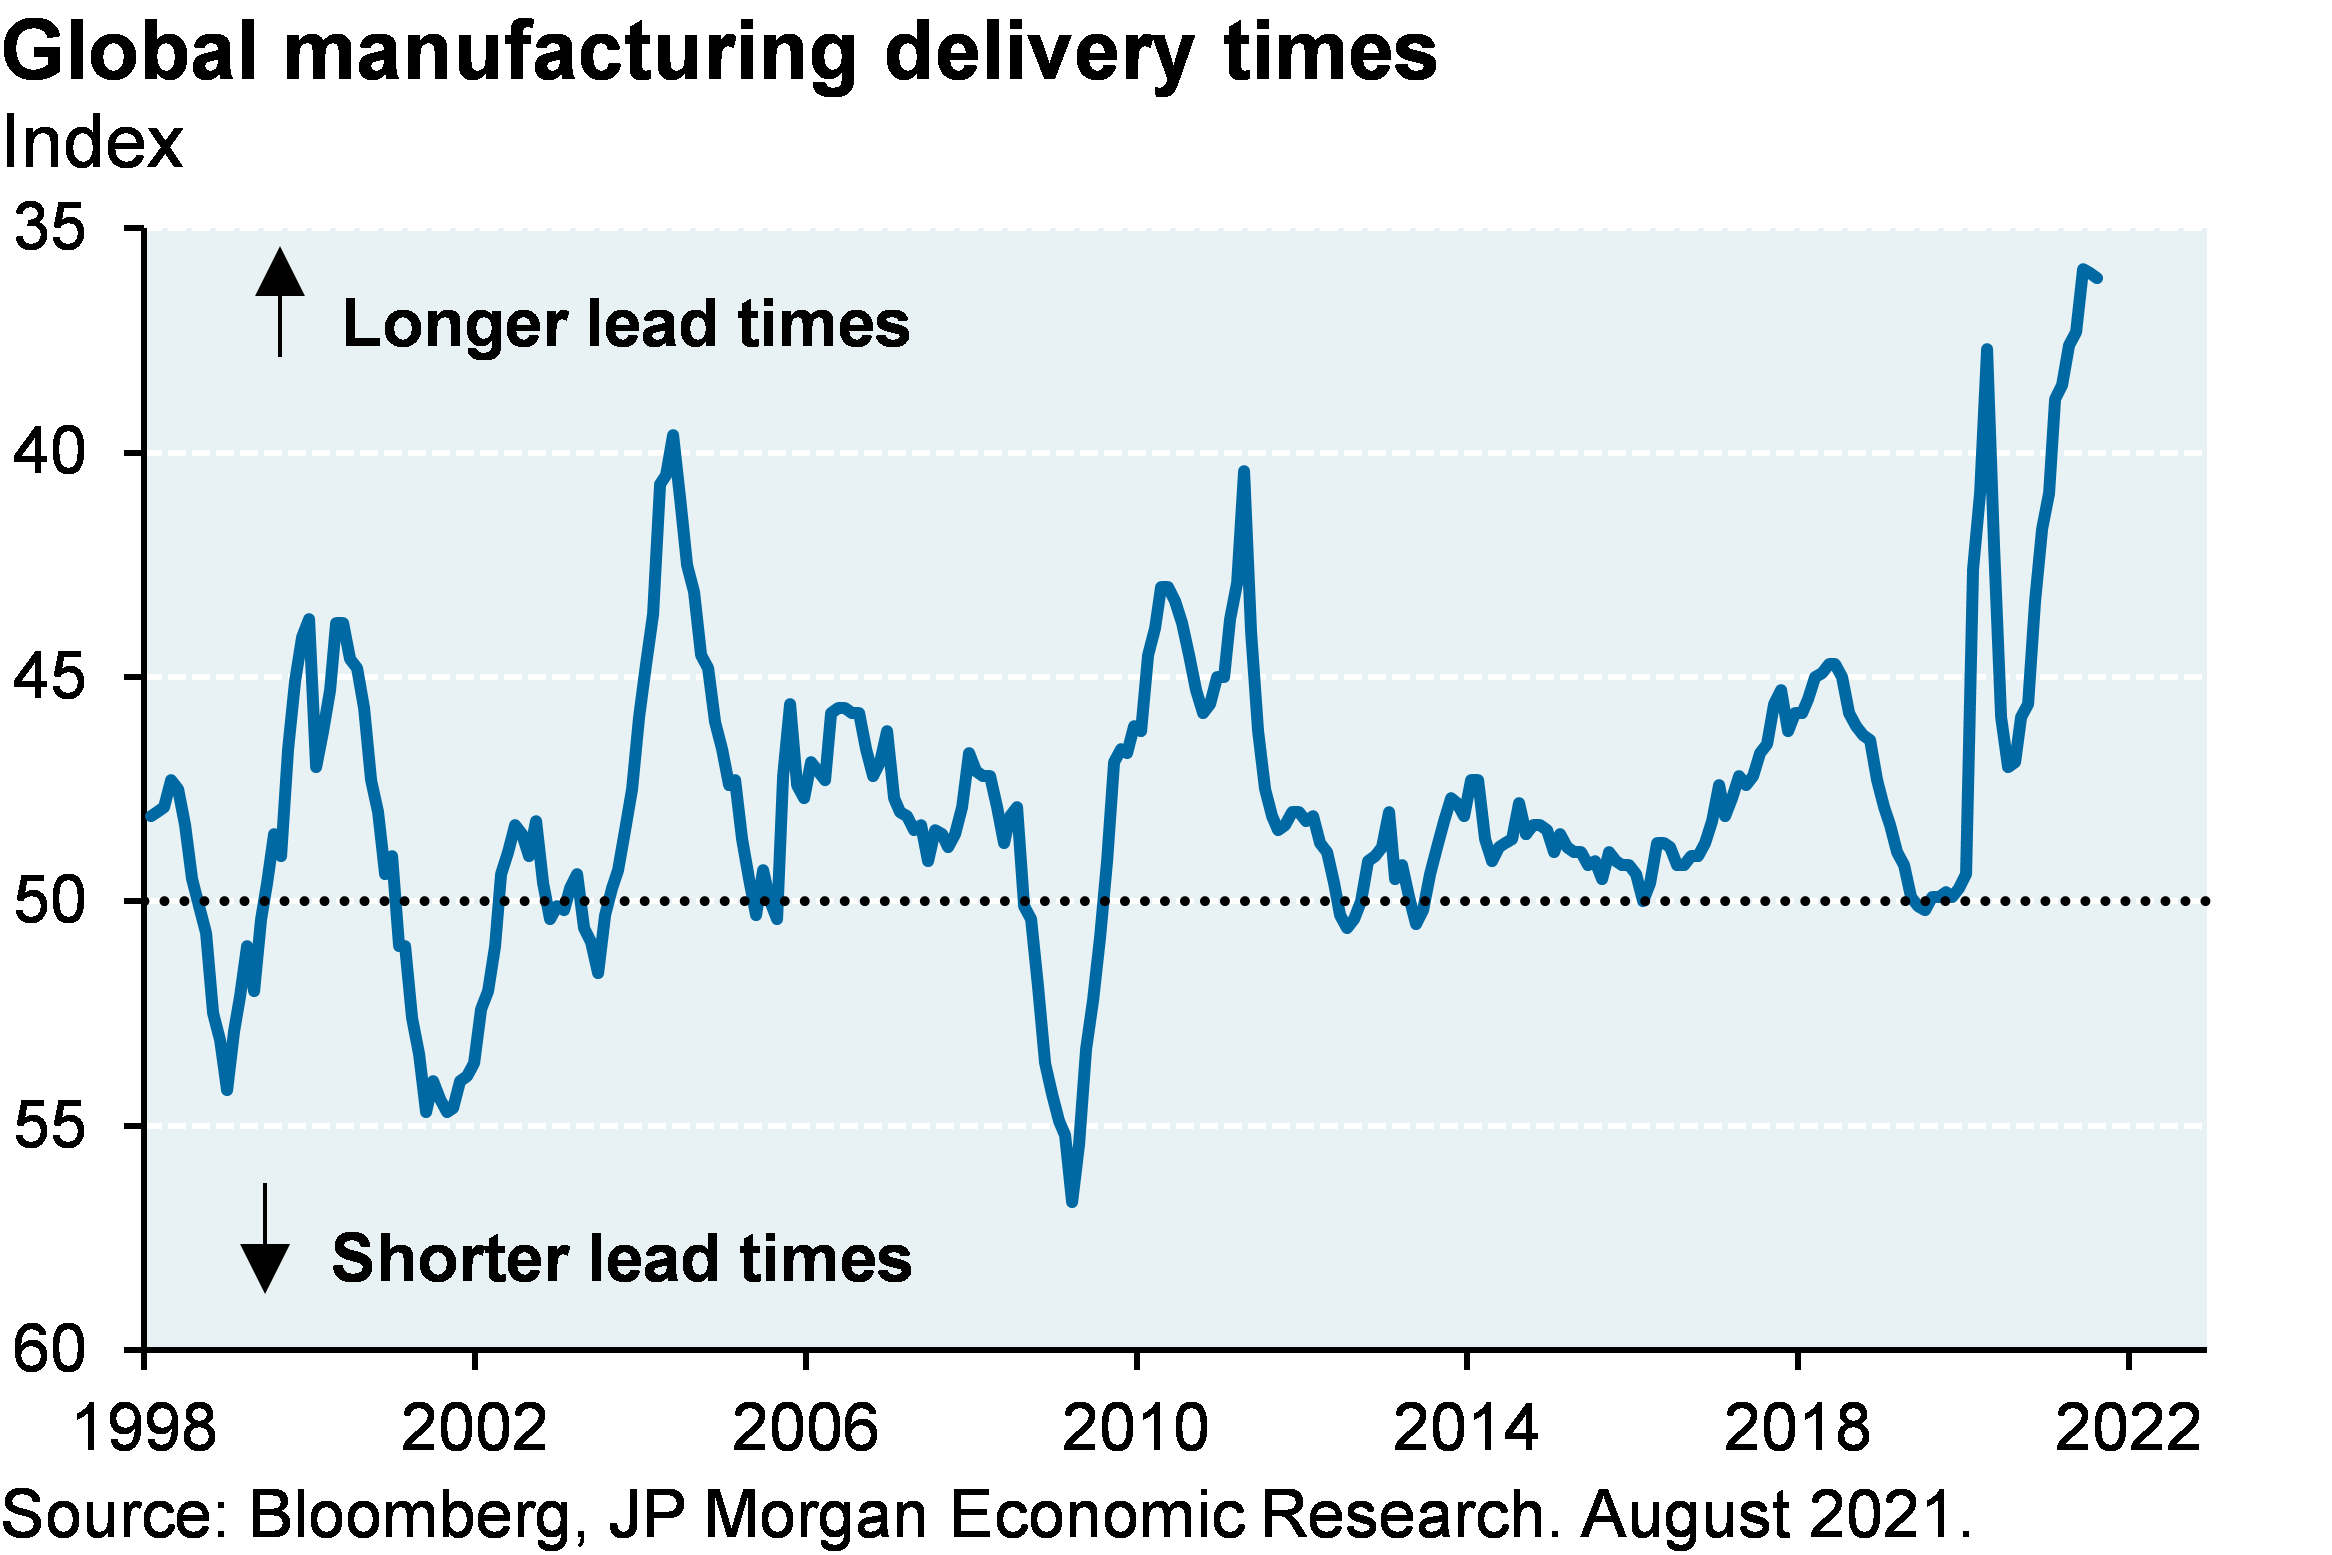
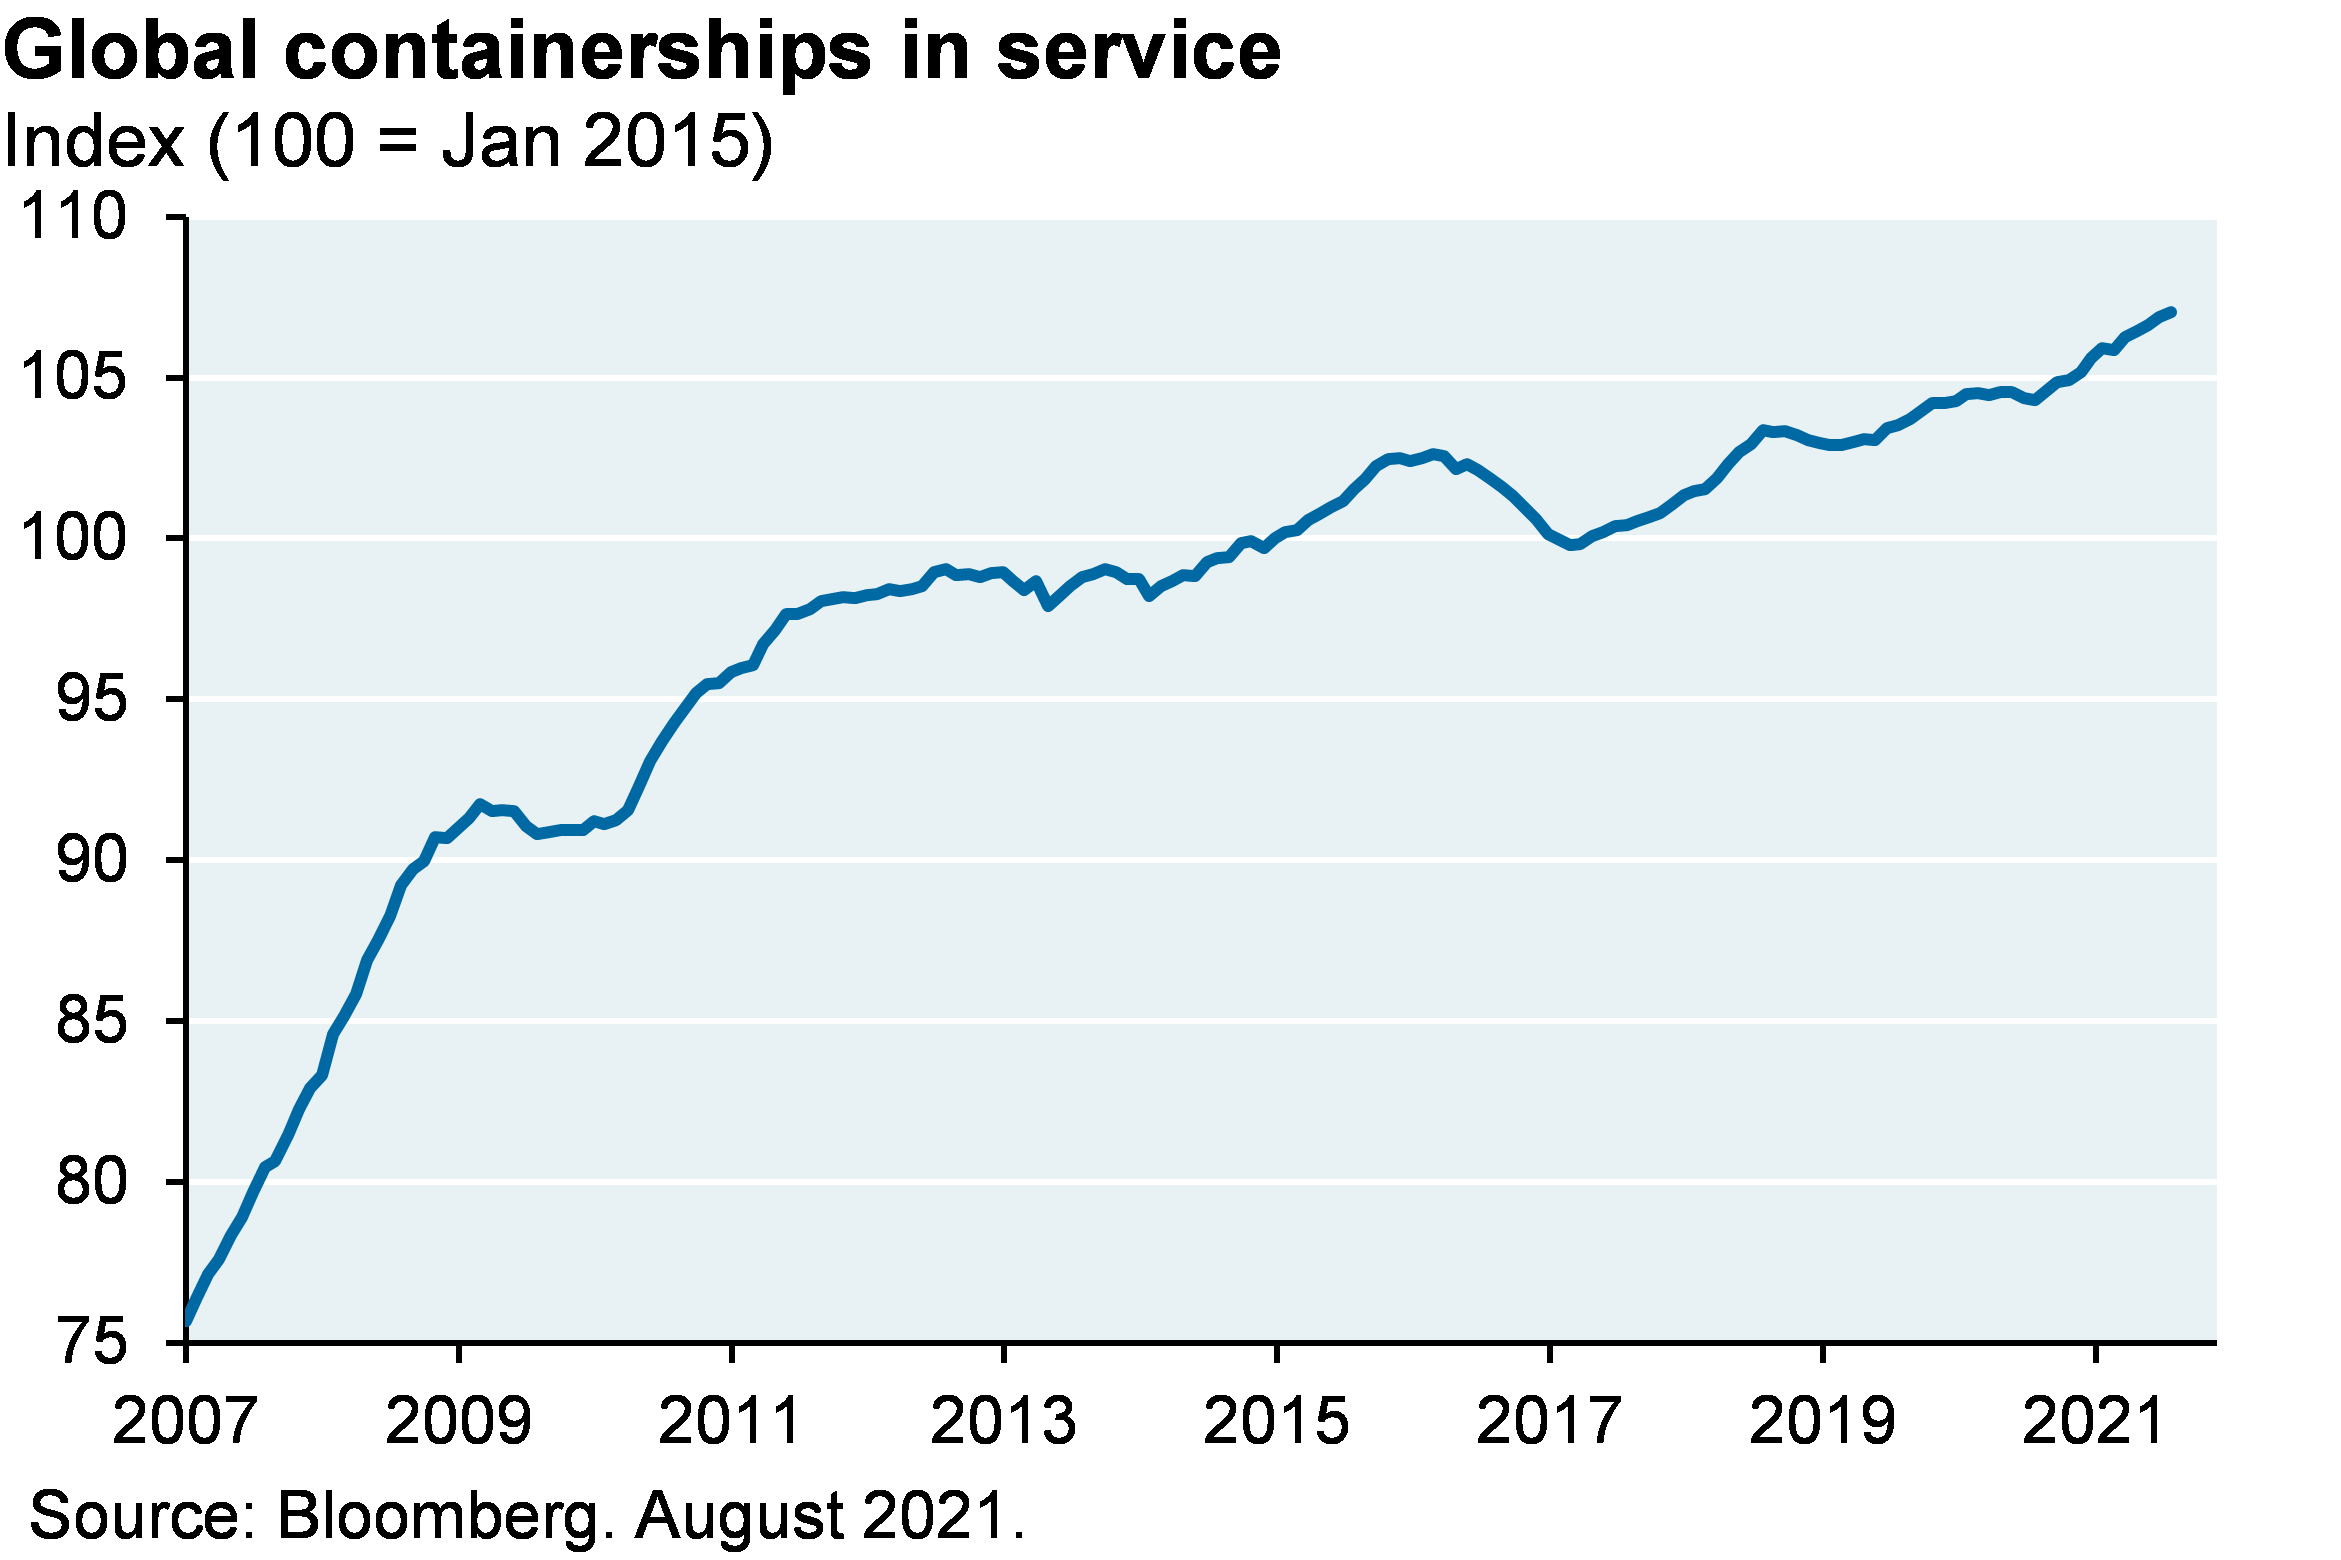
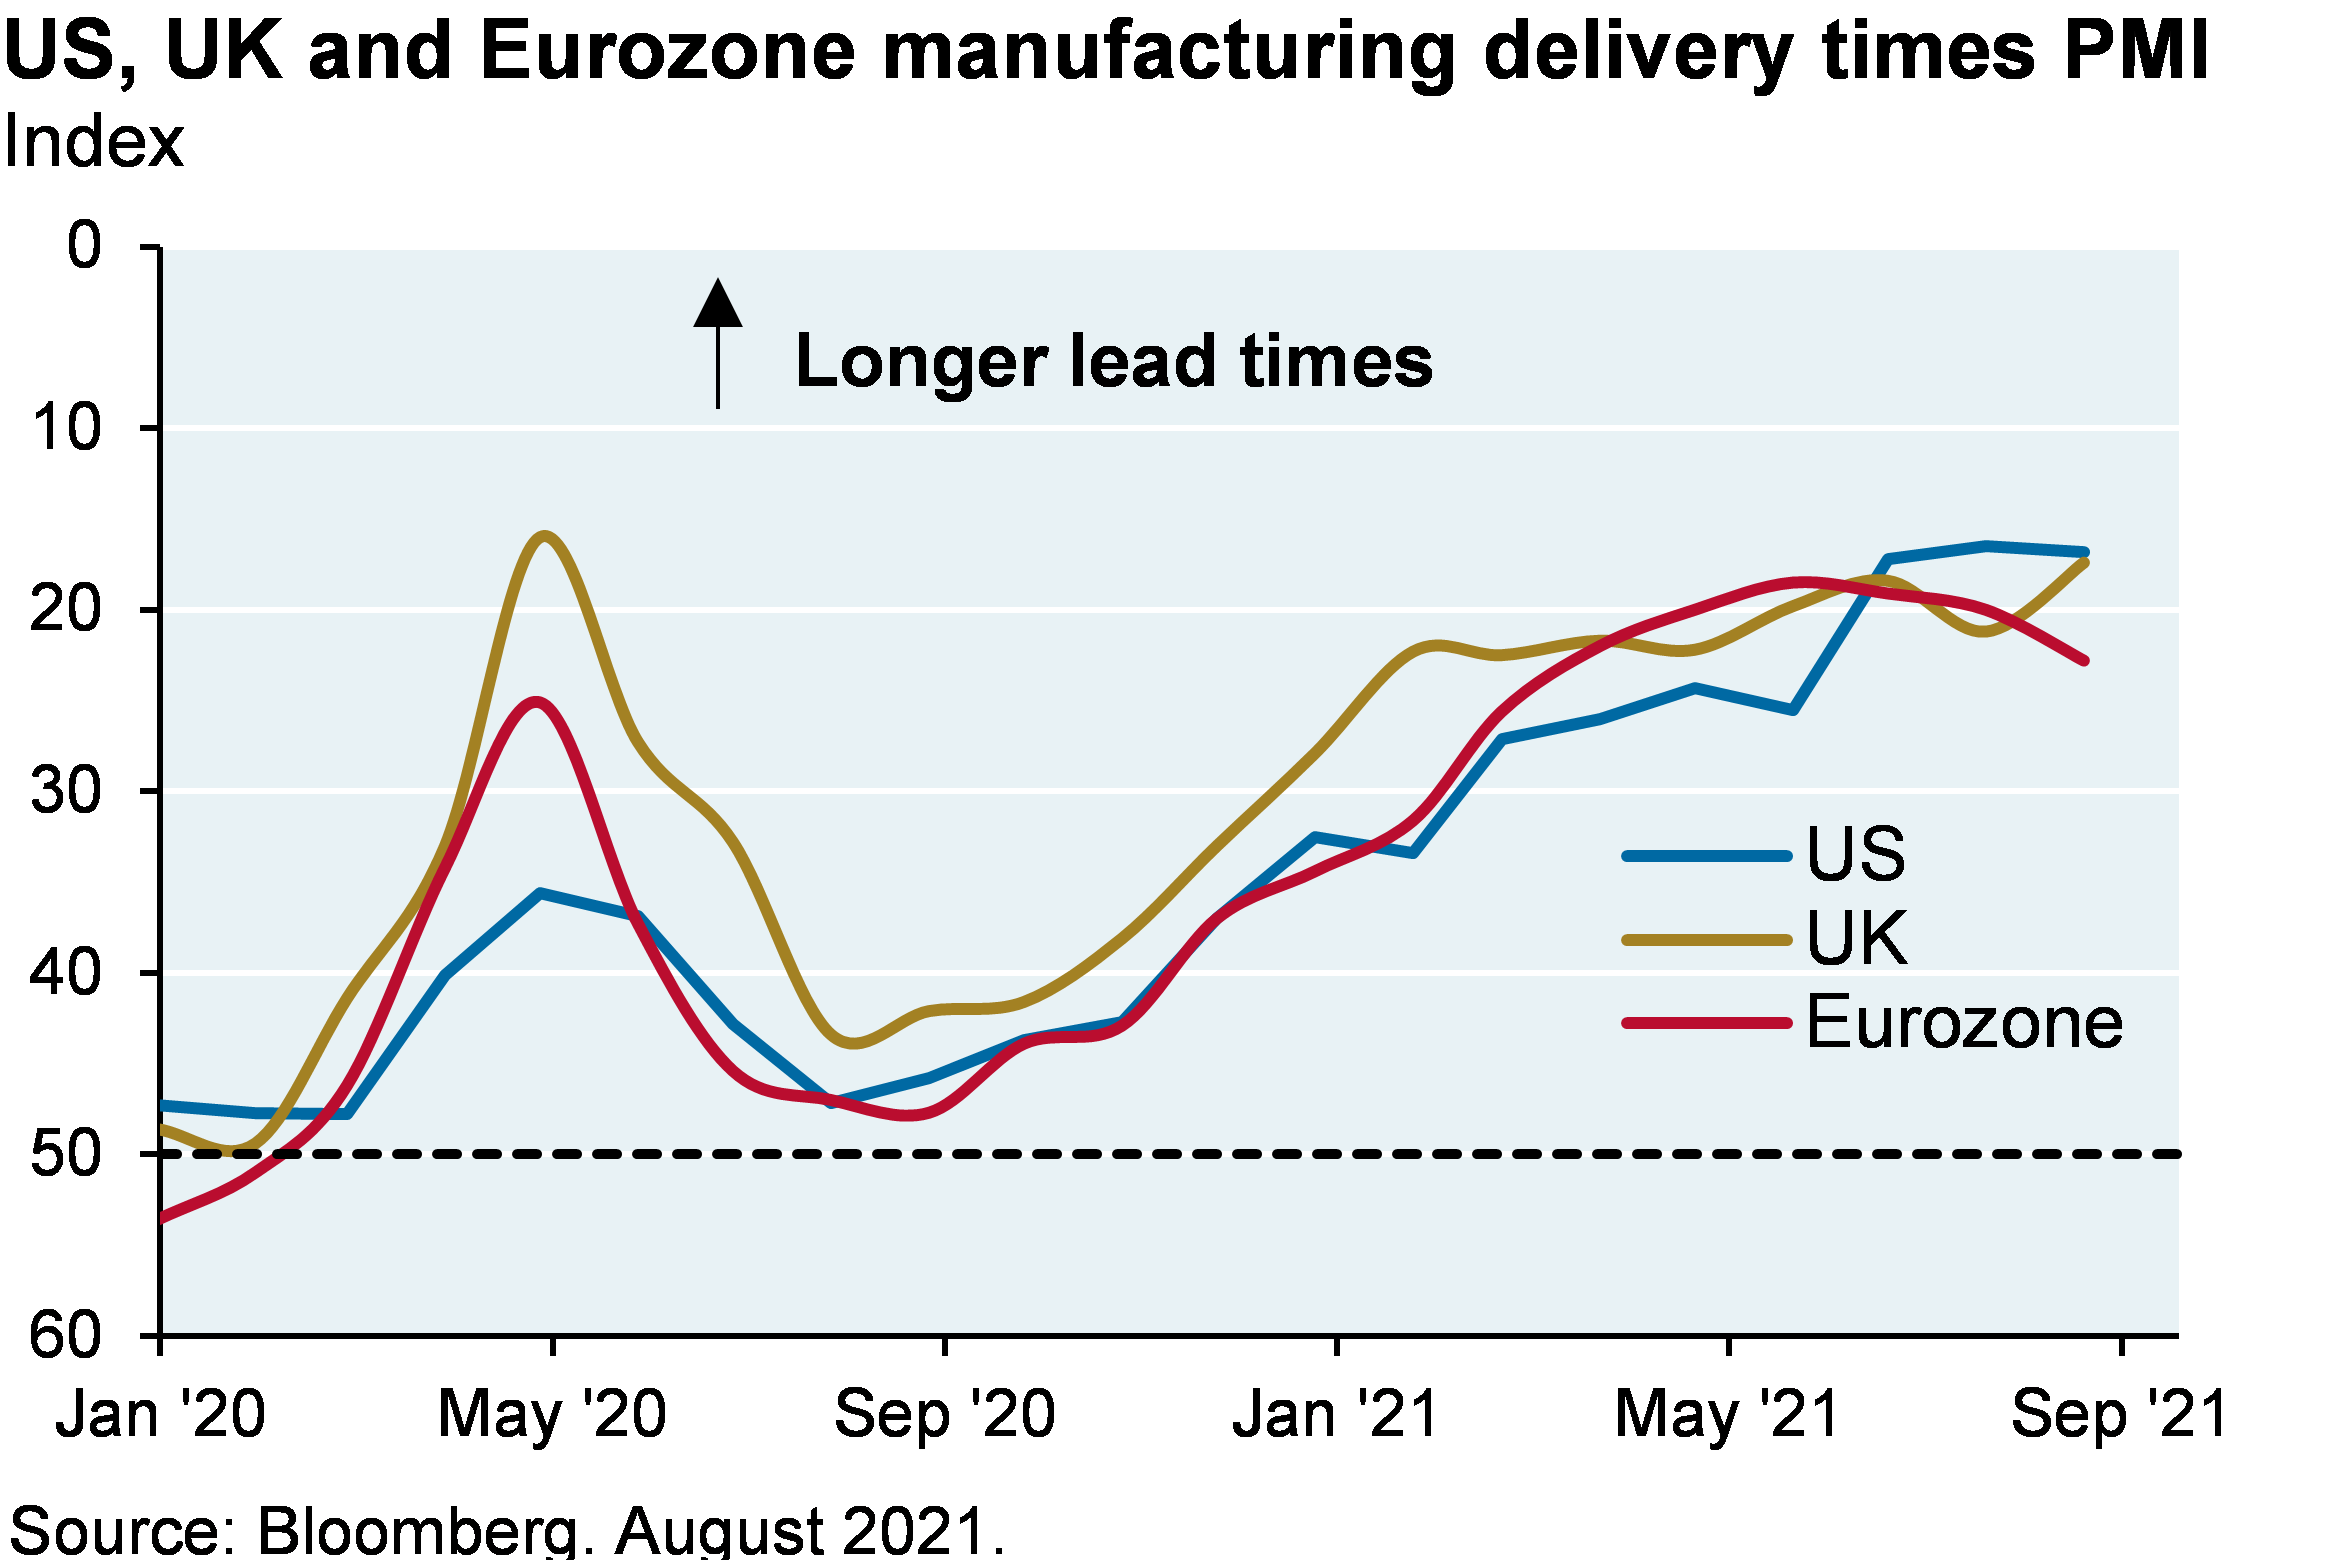
The containership industry is a good illustration of the supply chain mess: as shown in the first chart, more than 70 containerships are stacked up outside Los Angeles/Long Beach ports waiting to unload. Idle containerships are back to just 3% of the total fleet, shipping costs are surging, manufacturing delivery times are extended and rail shipments are declining sharply from their summer peak, illustrating the far reaching impact of the delays.

Line chart shows anchored containerships in Los Angeles and Long Beach, shown as the number of containerships which has spike to a high of about 70 in September.
Line chart shows idle containerships as a % of global containership fleet. Idle containerships spiked to 10% in July 2020 but is now at around 3%.
Line chart shows the container freight rate shown in US dollars per 40ft box and shows the Baltic Dry Index since 2018. The container freight rate has steadily been rising since January 2019, to its highest point of over $10,000 in September. The Baltic Dry Index remained at a level of 1000-2000 until recently, when it spiked to above 4,000, the highest level since 2010.
Line chart shows US rail shipments, shown in thousands of carloads as a 4 week average since 2017. Rail shipments dropped to a low of 220 thousand carloads in early 2020, then increased to a peak of 300 thousand carloads, and have declined most recently to a value of around 260 thousand carloads.
Line chart shows the arrangement of freight and cargo prices (PPI) shown as an index where 100 represents the December 2008 level. Prices have risen to a high of 160, after remaining below a level of 120 since 2009.
Line chart shows global manufacturing delivery times since 1998, shown as an inverted index where a lower value represents longer lead times and a higher value represents shorter lead times. Chart shows that lead times are the longest they have been in history.


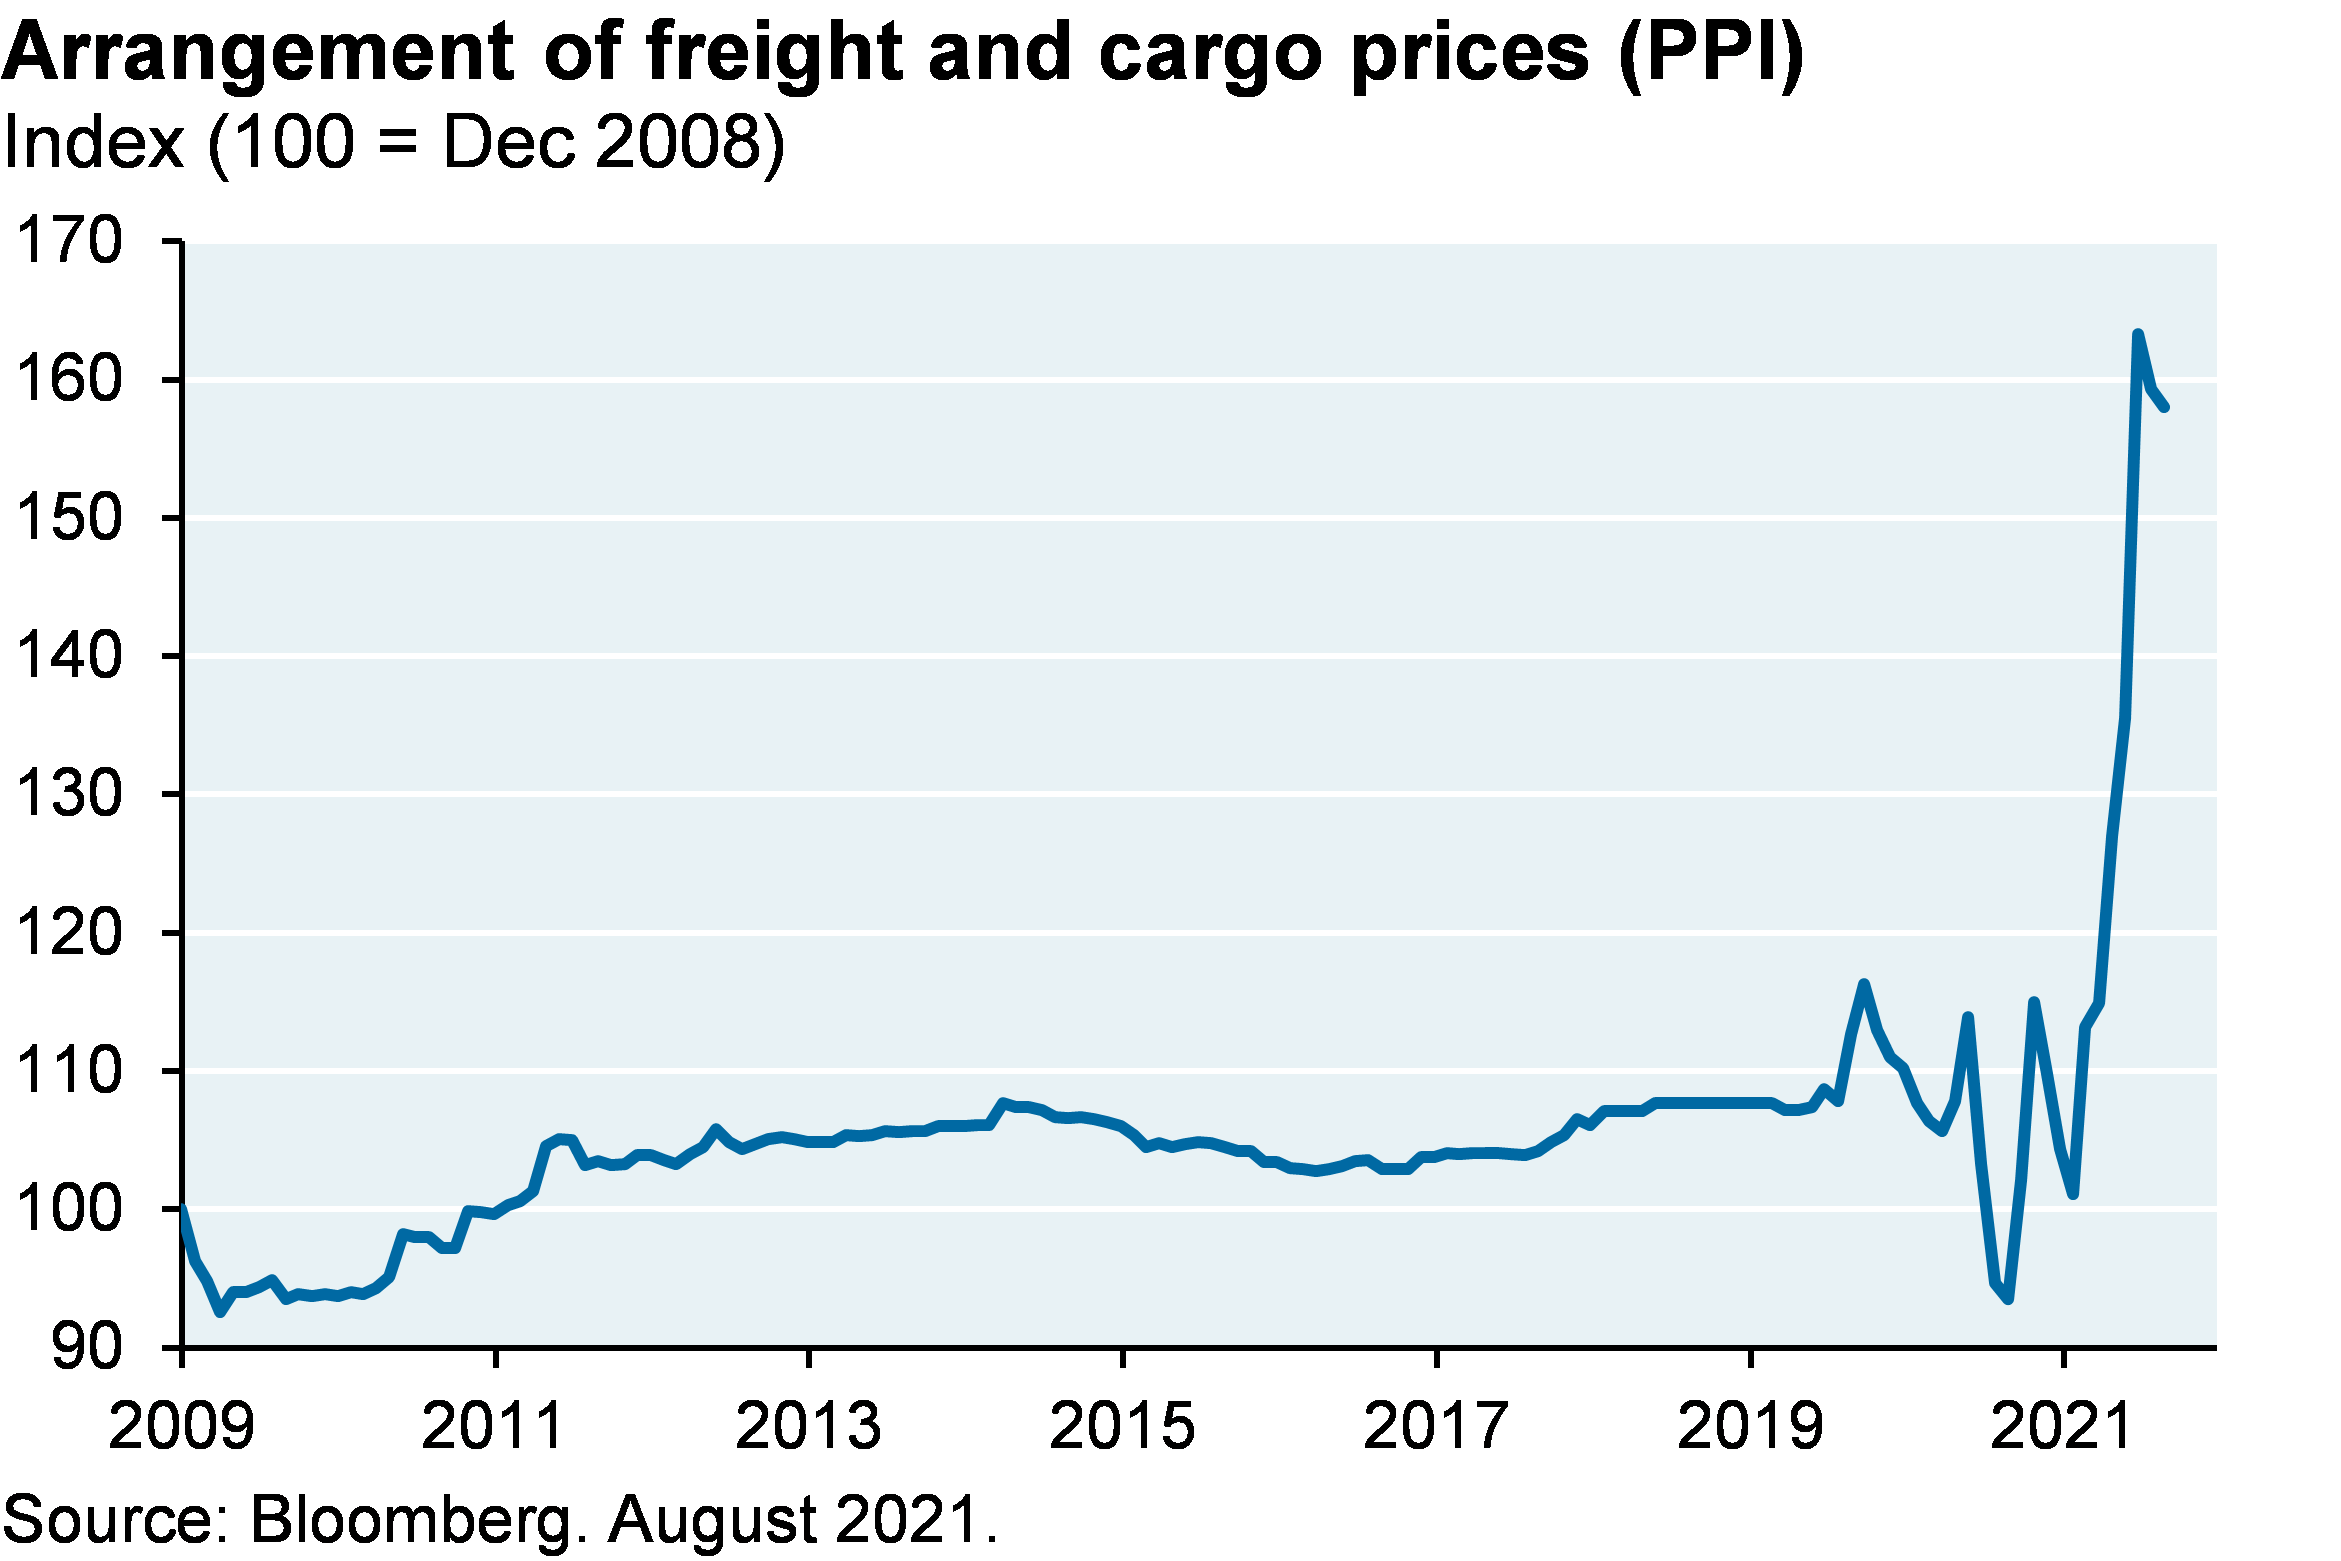
Why so many bottlenecks? Supply chain disruptions due to shipping cost discrepancies

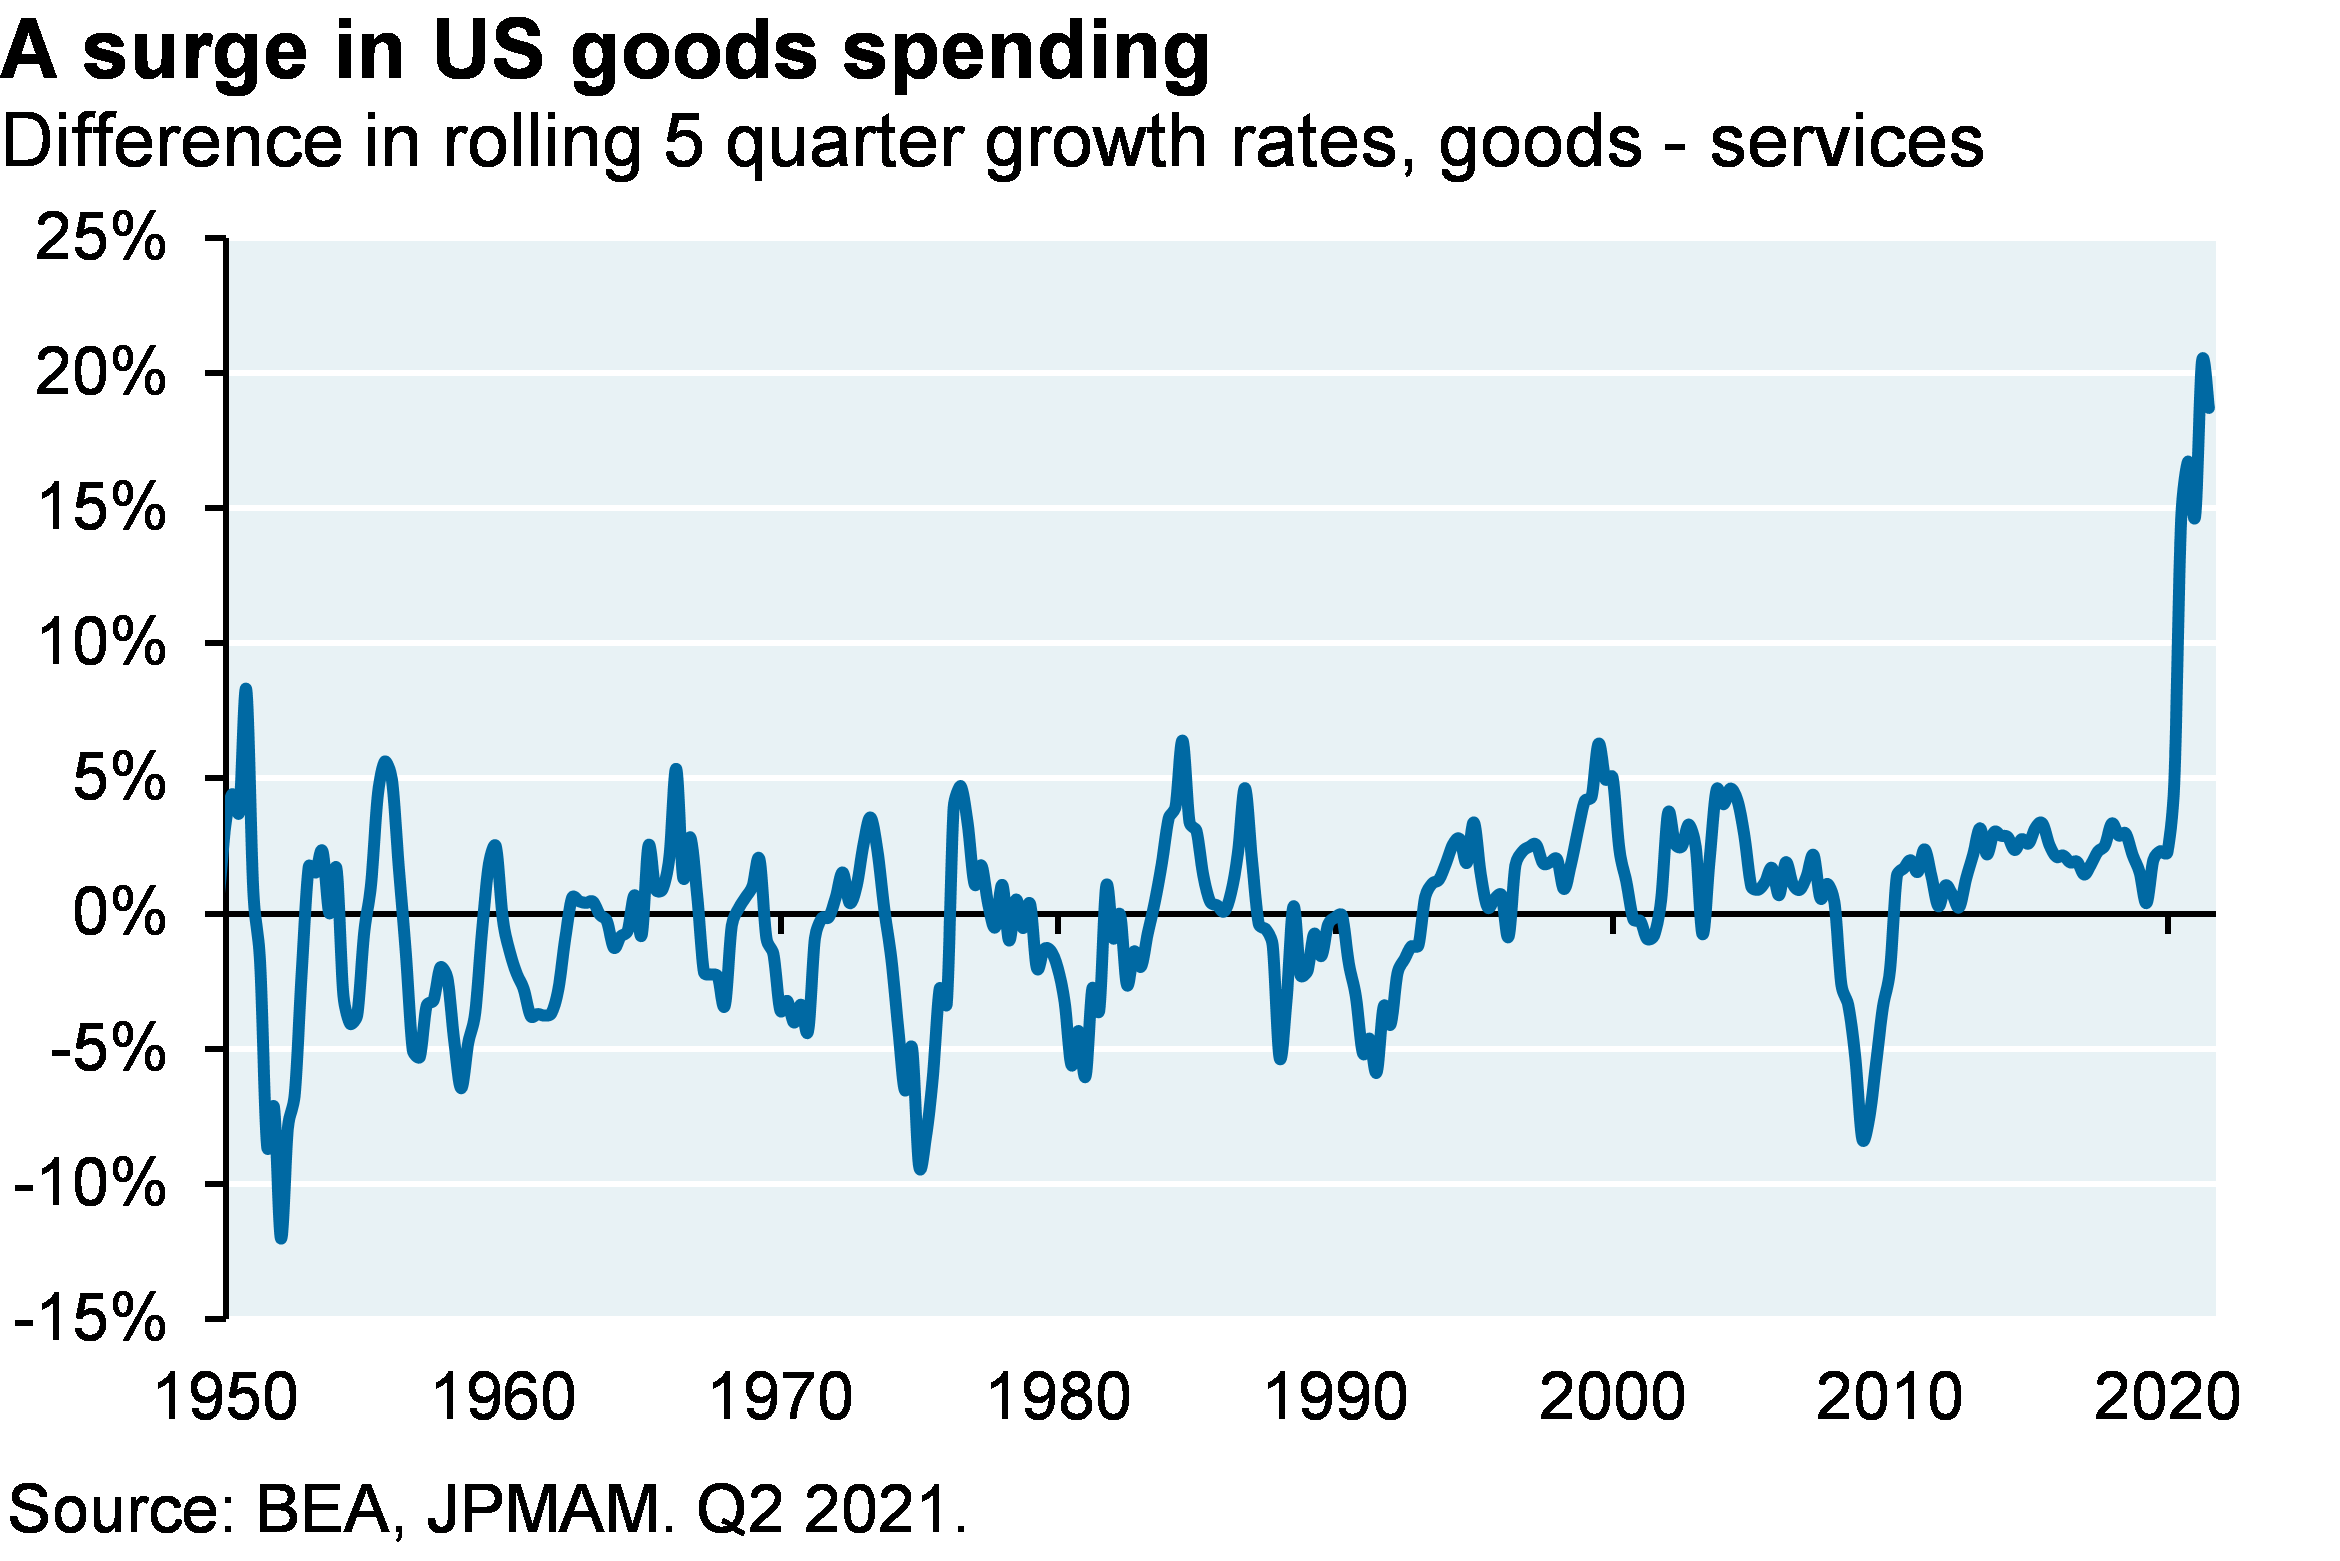
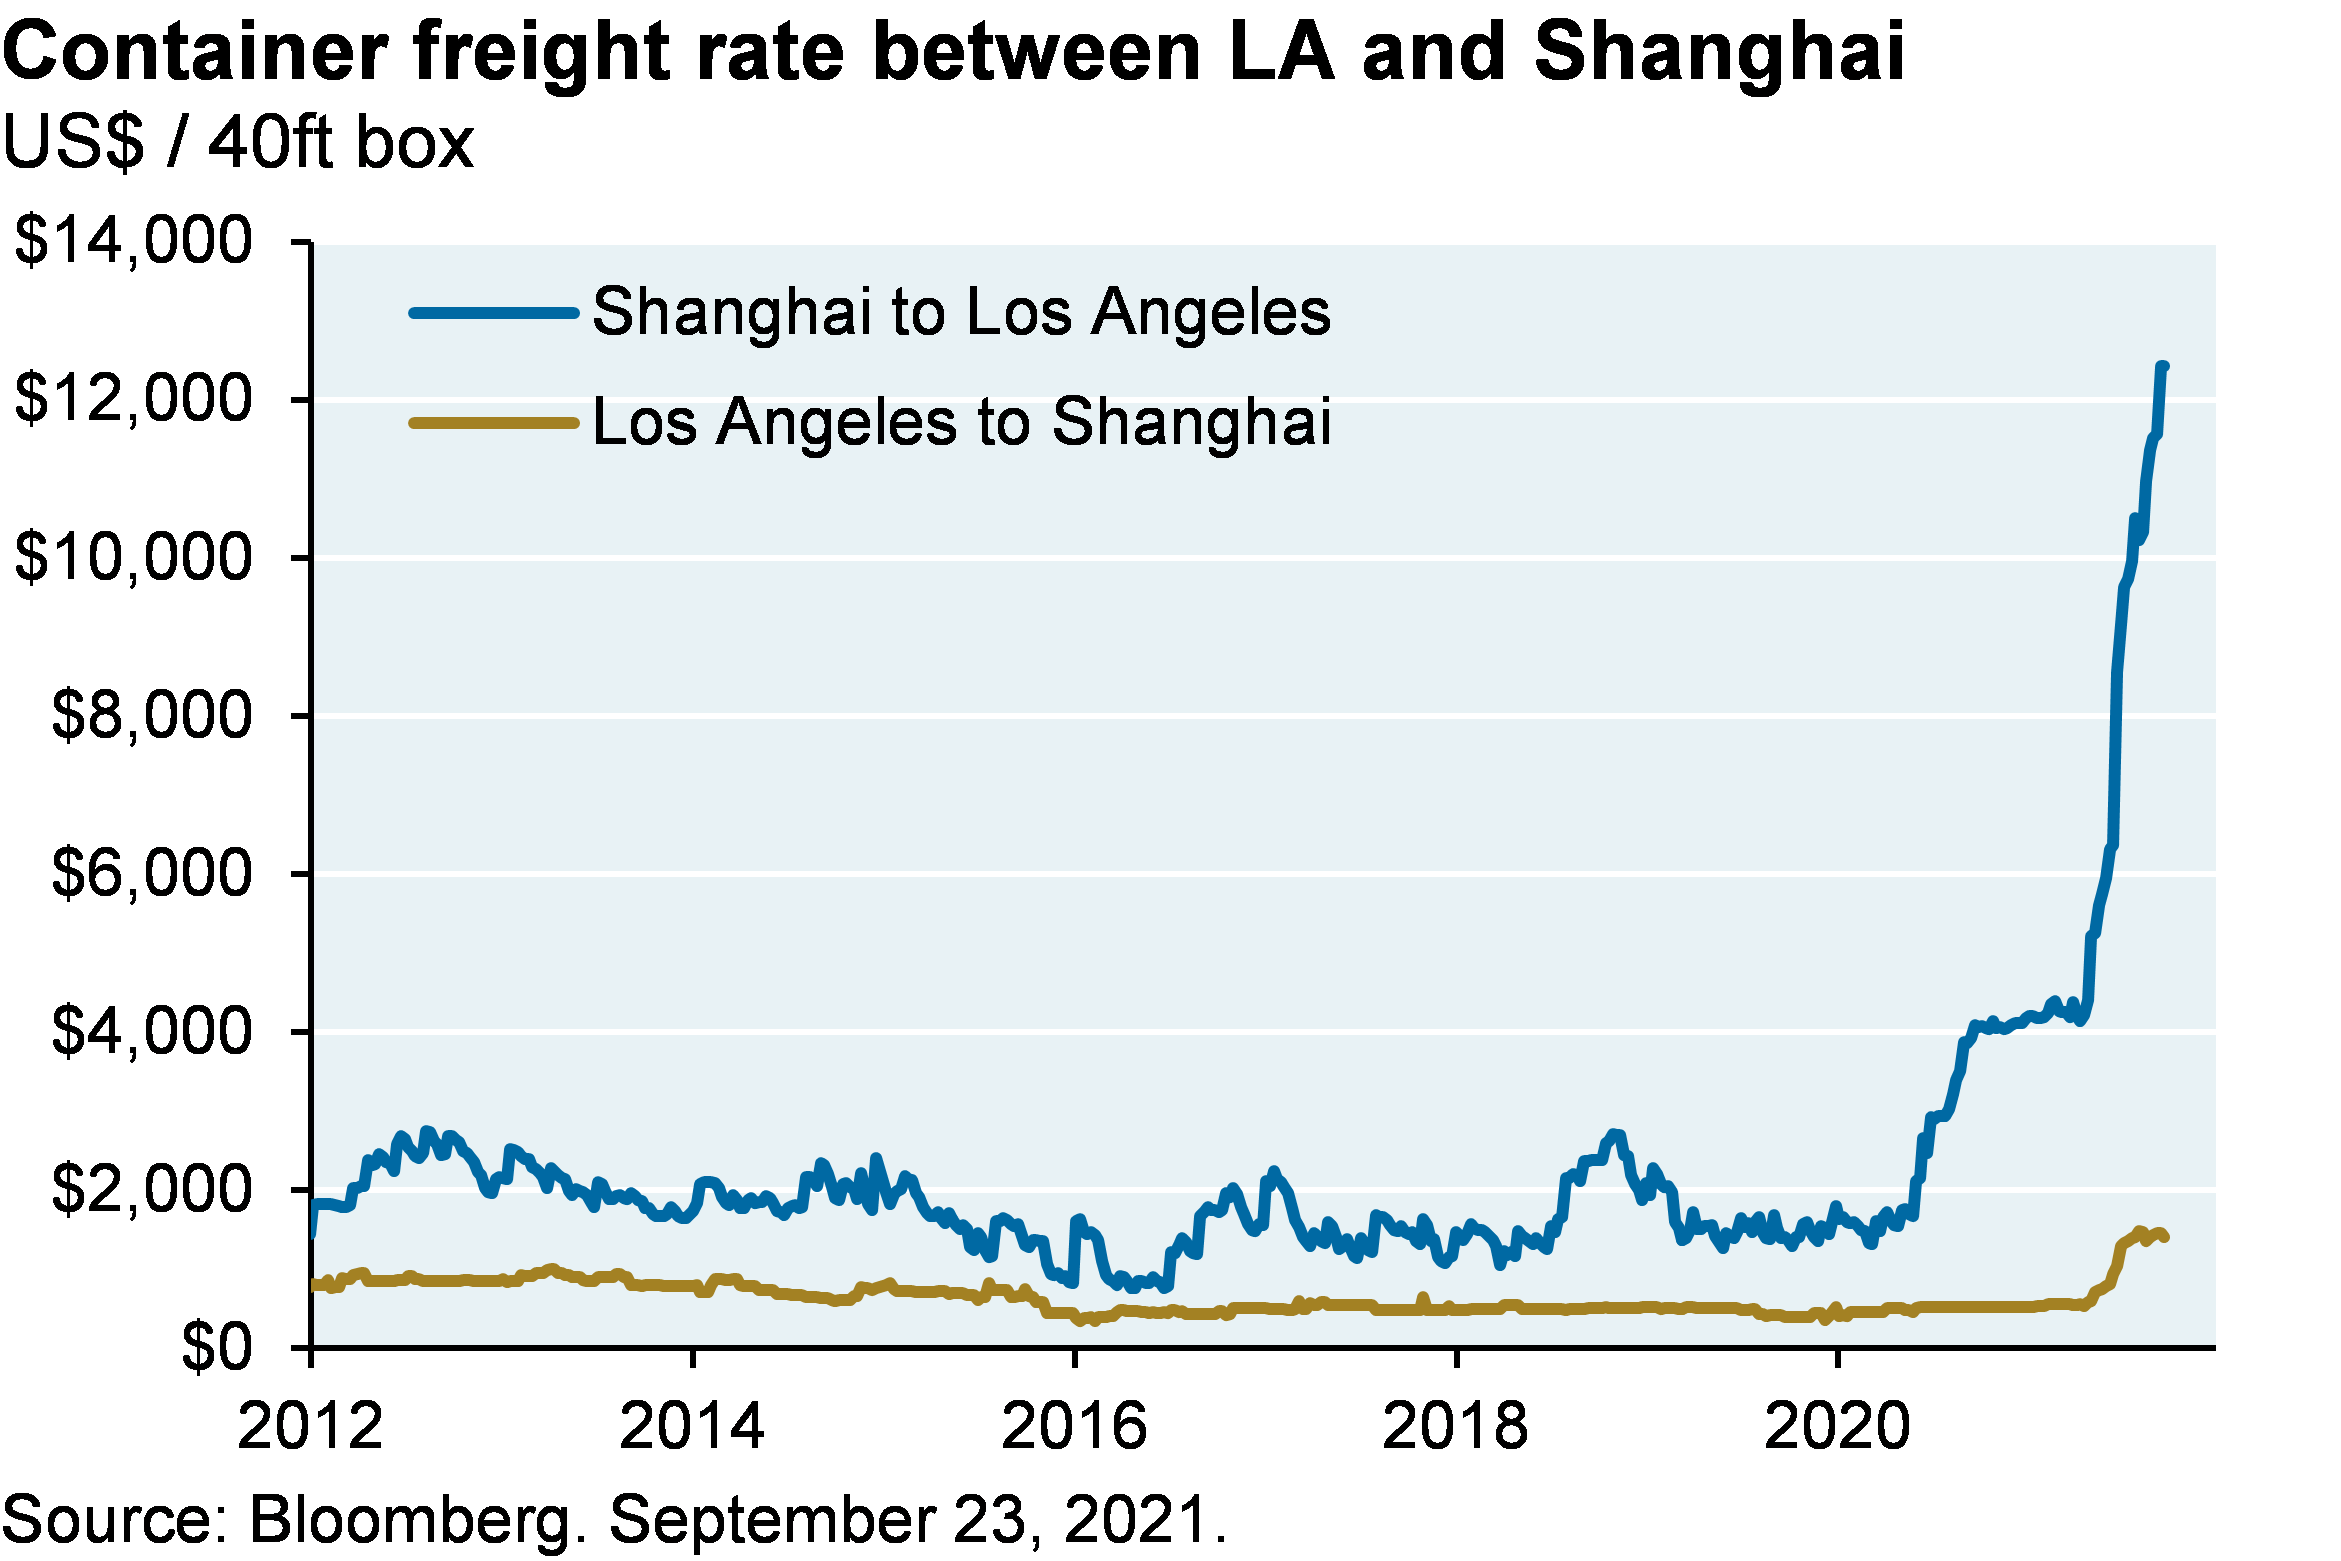
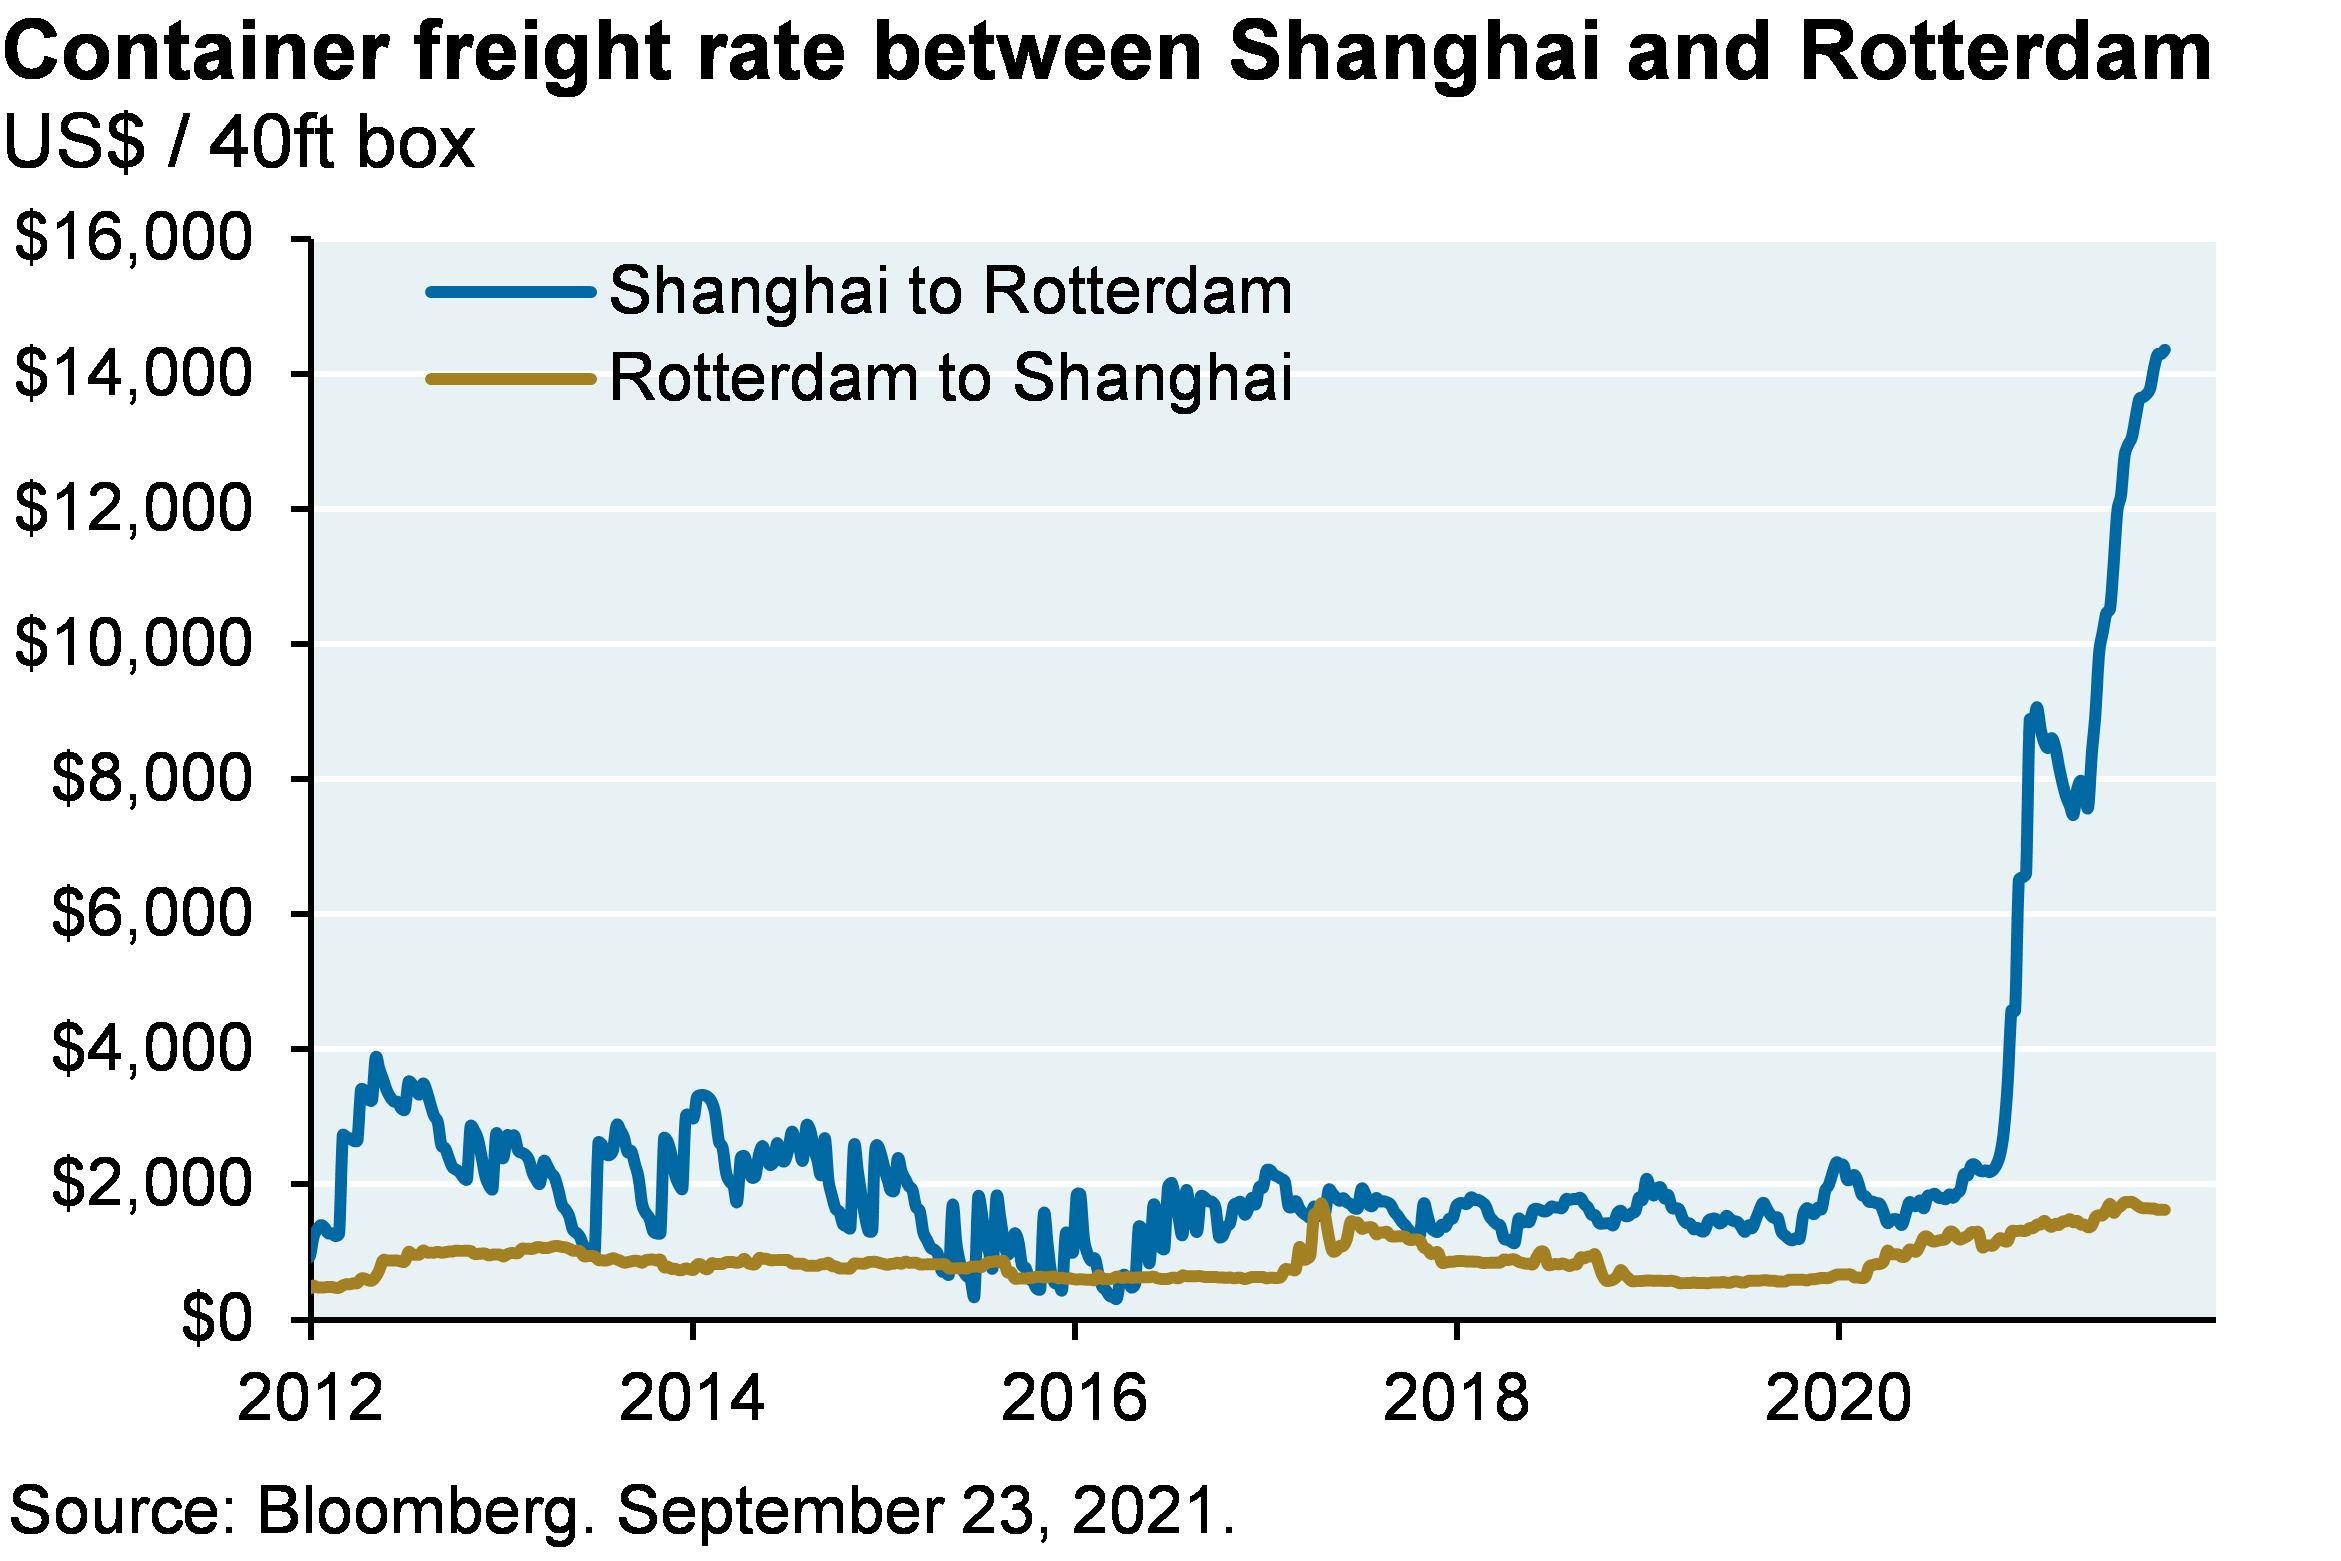
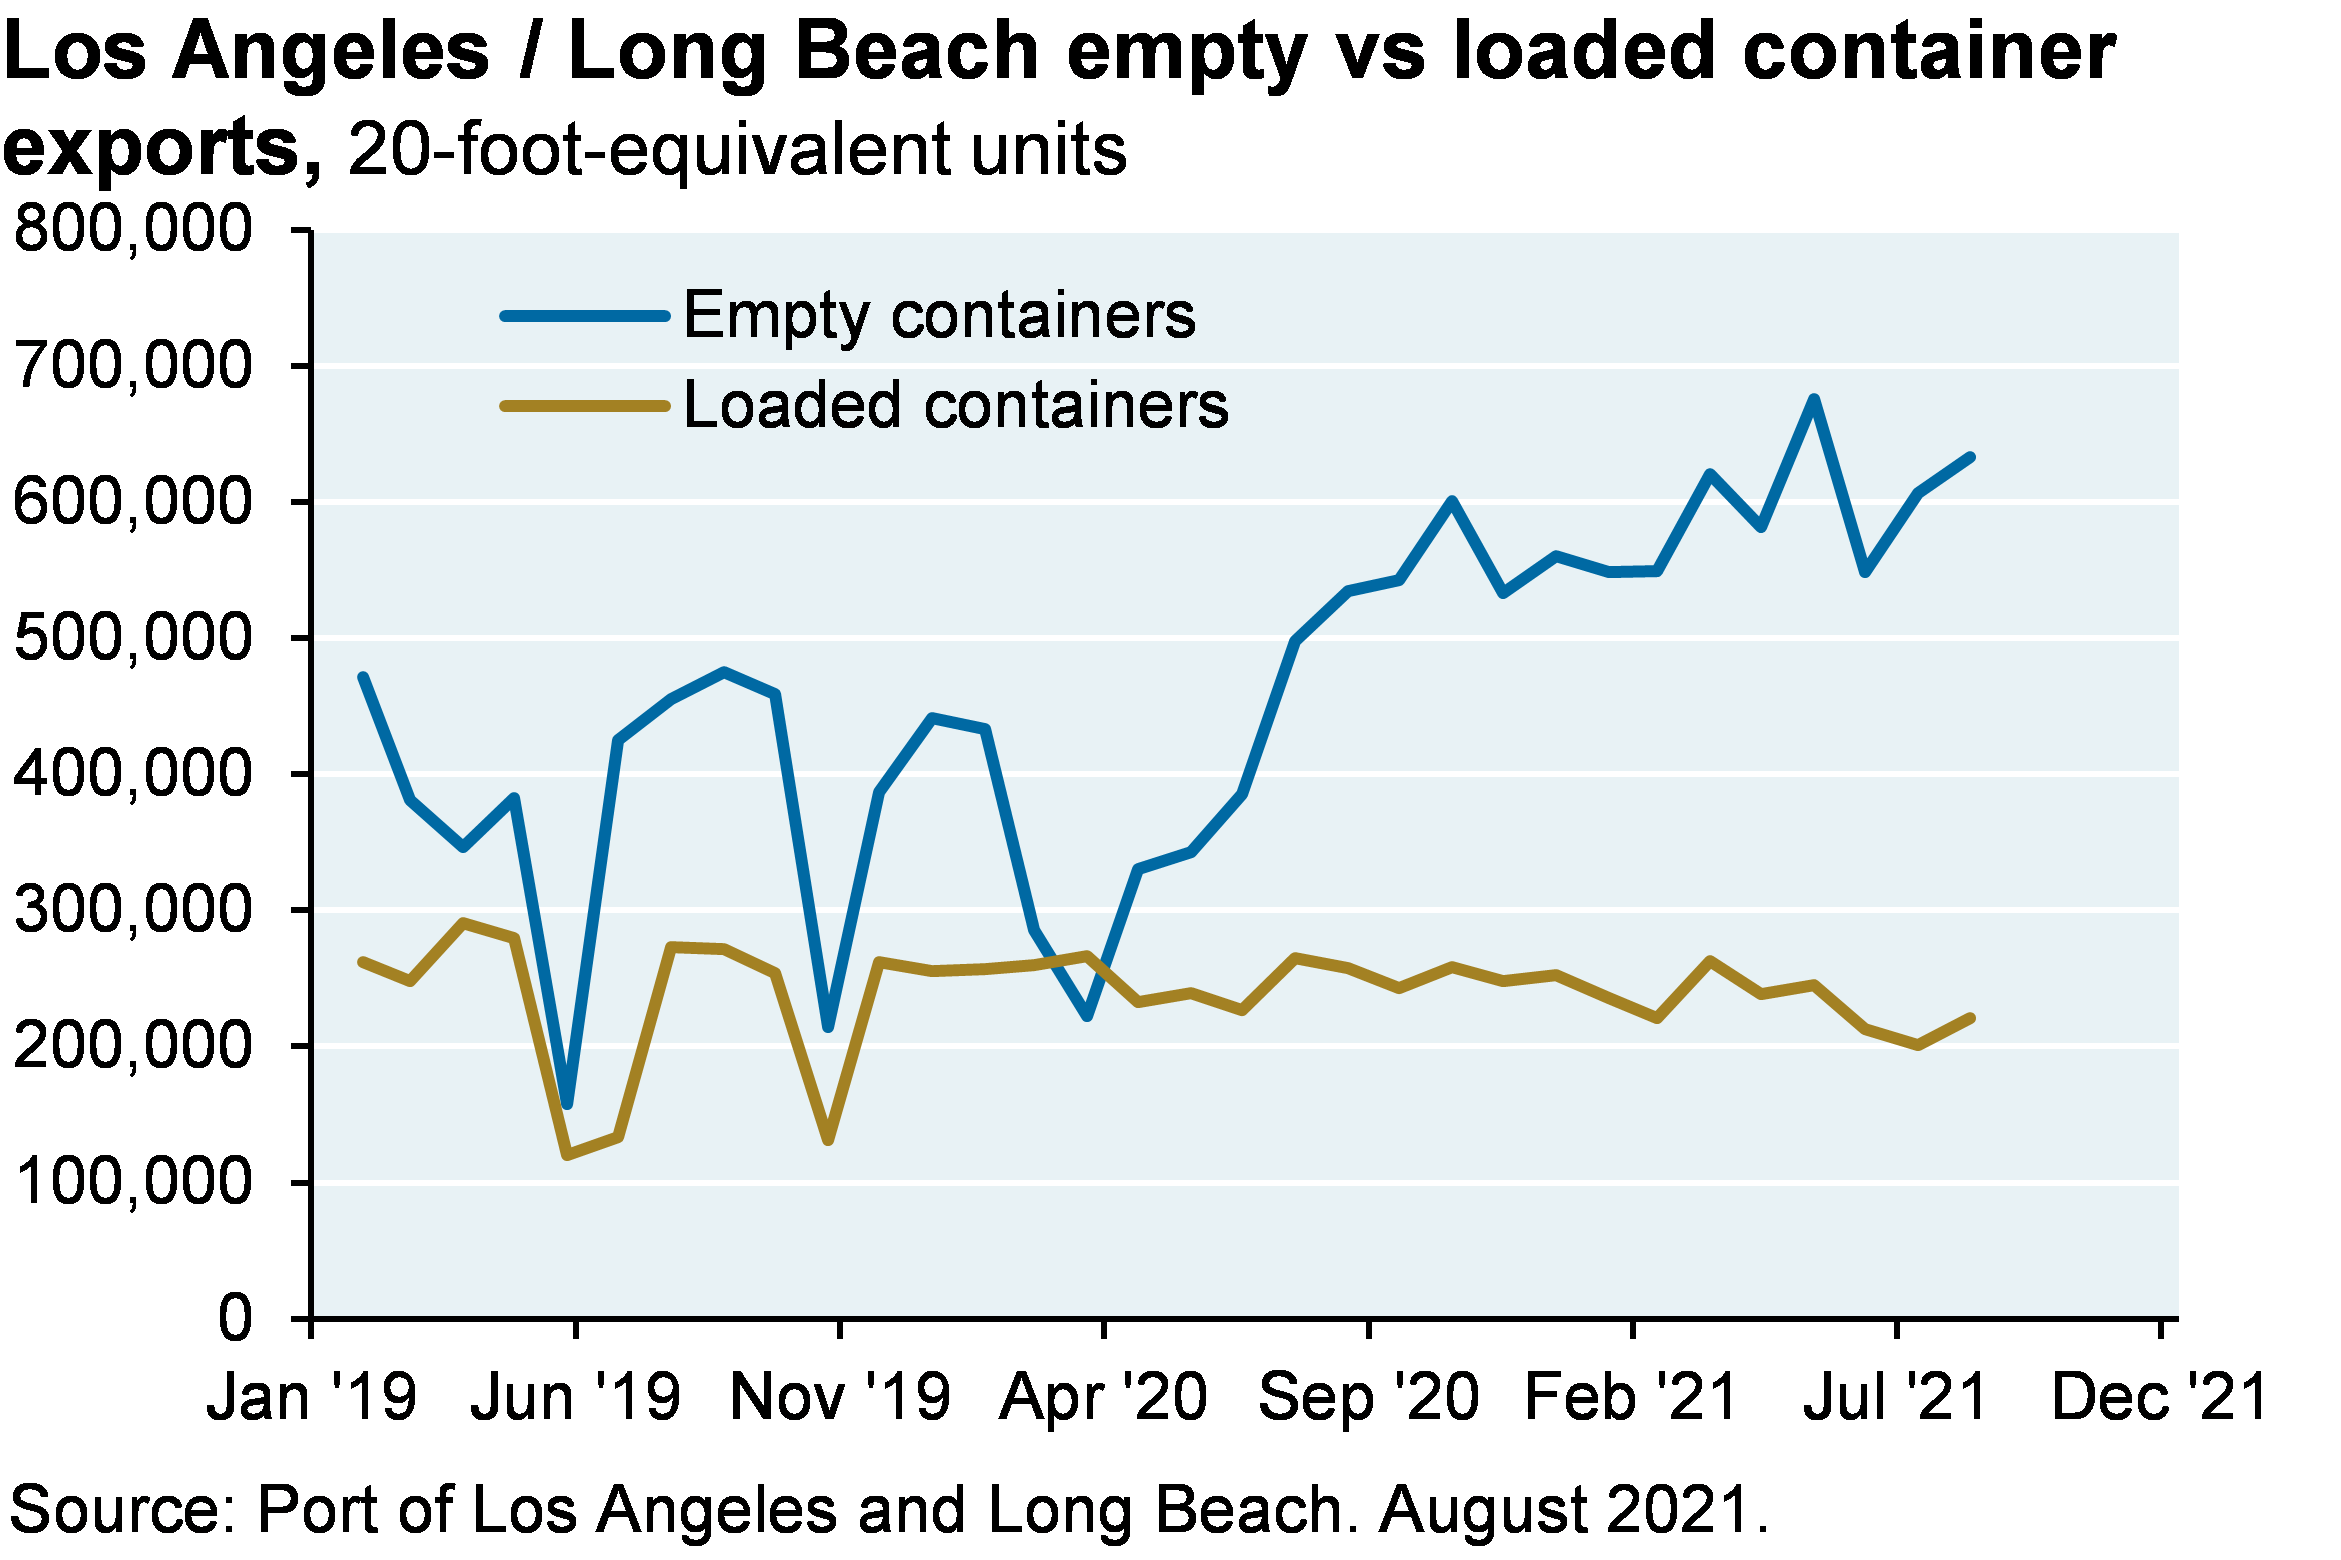
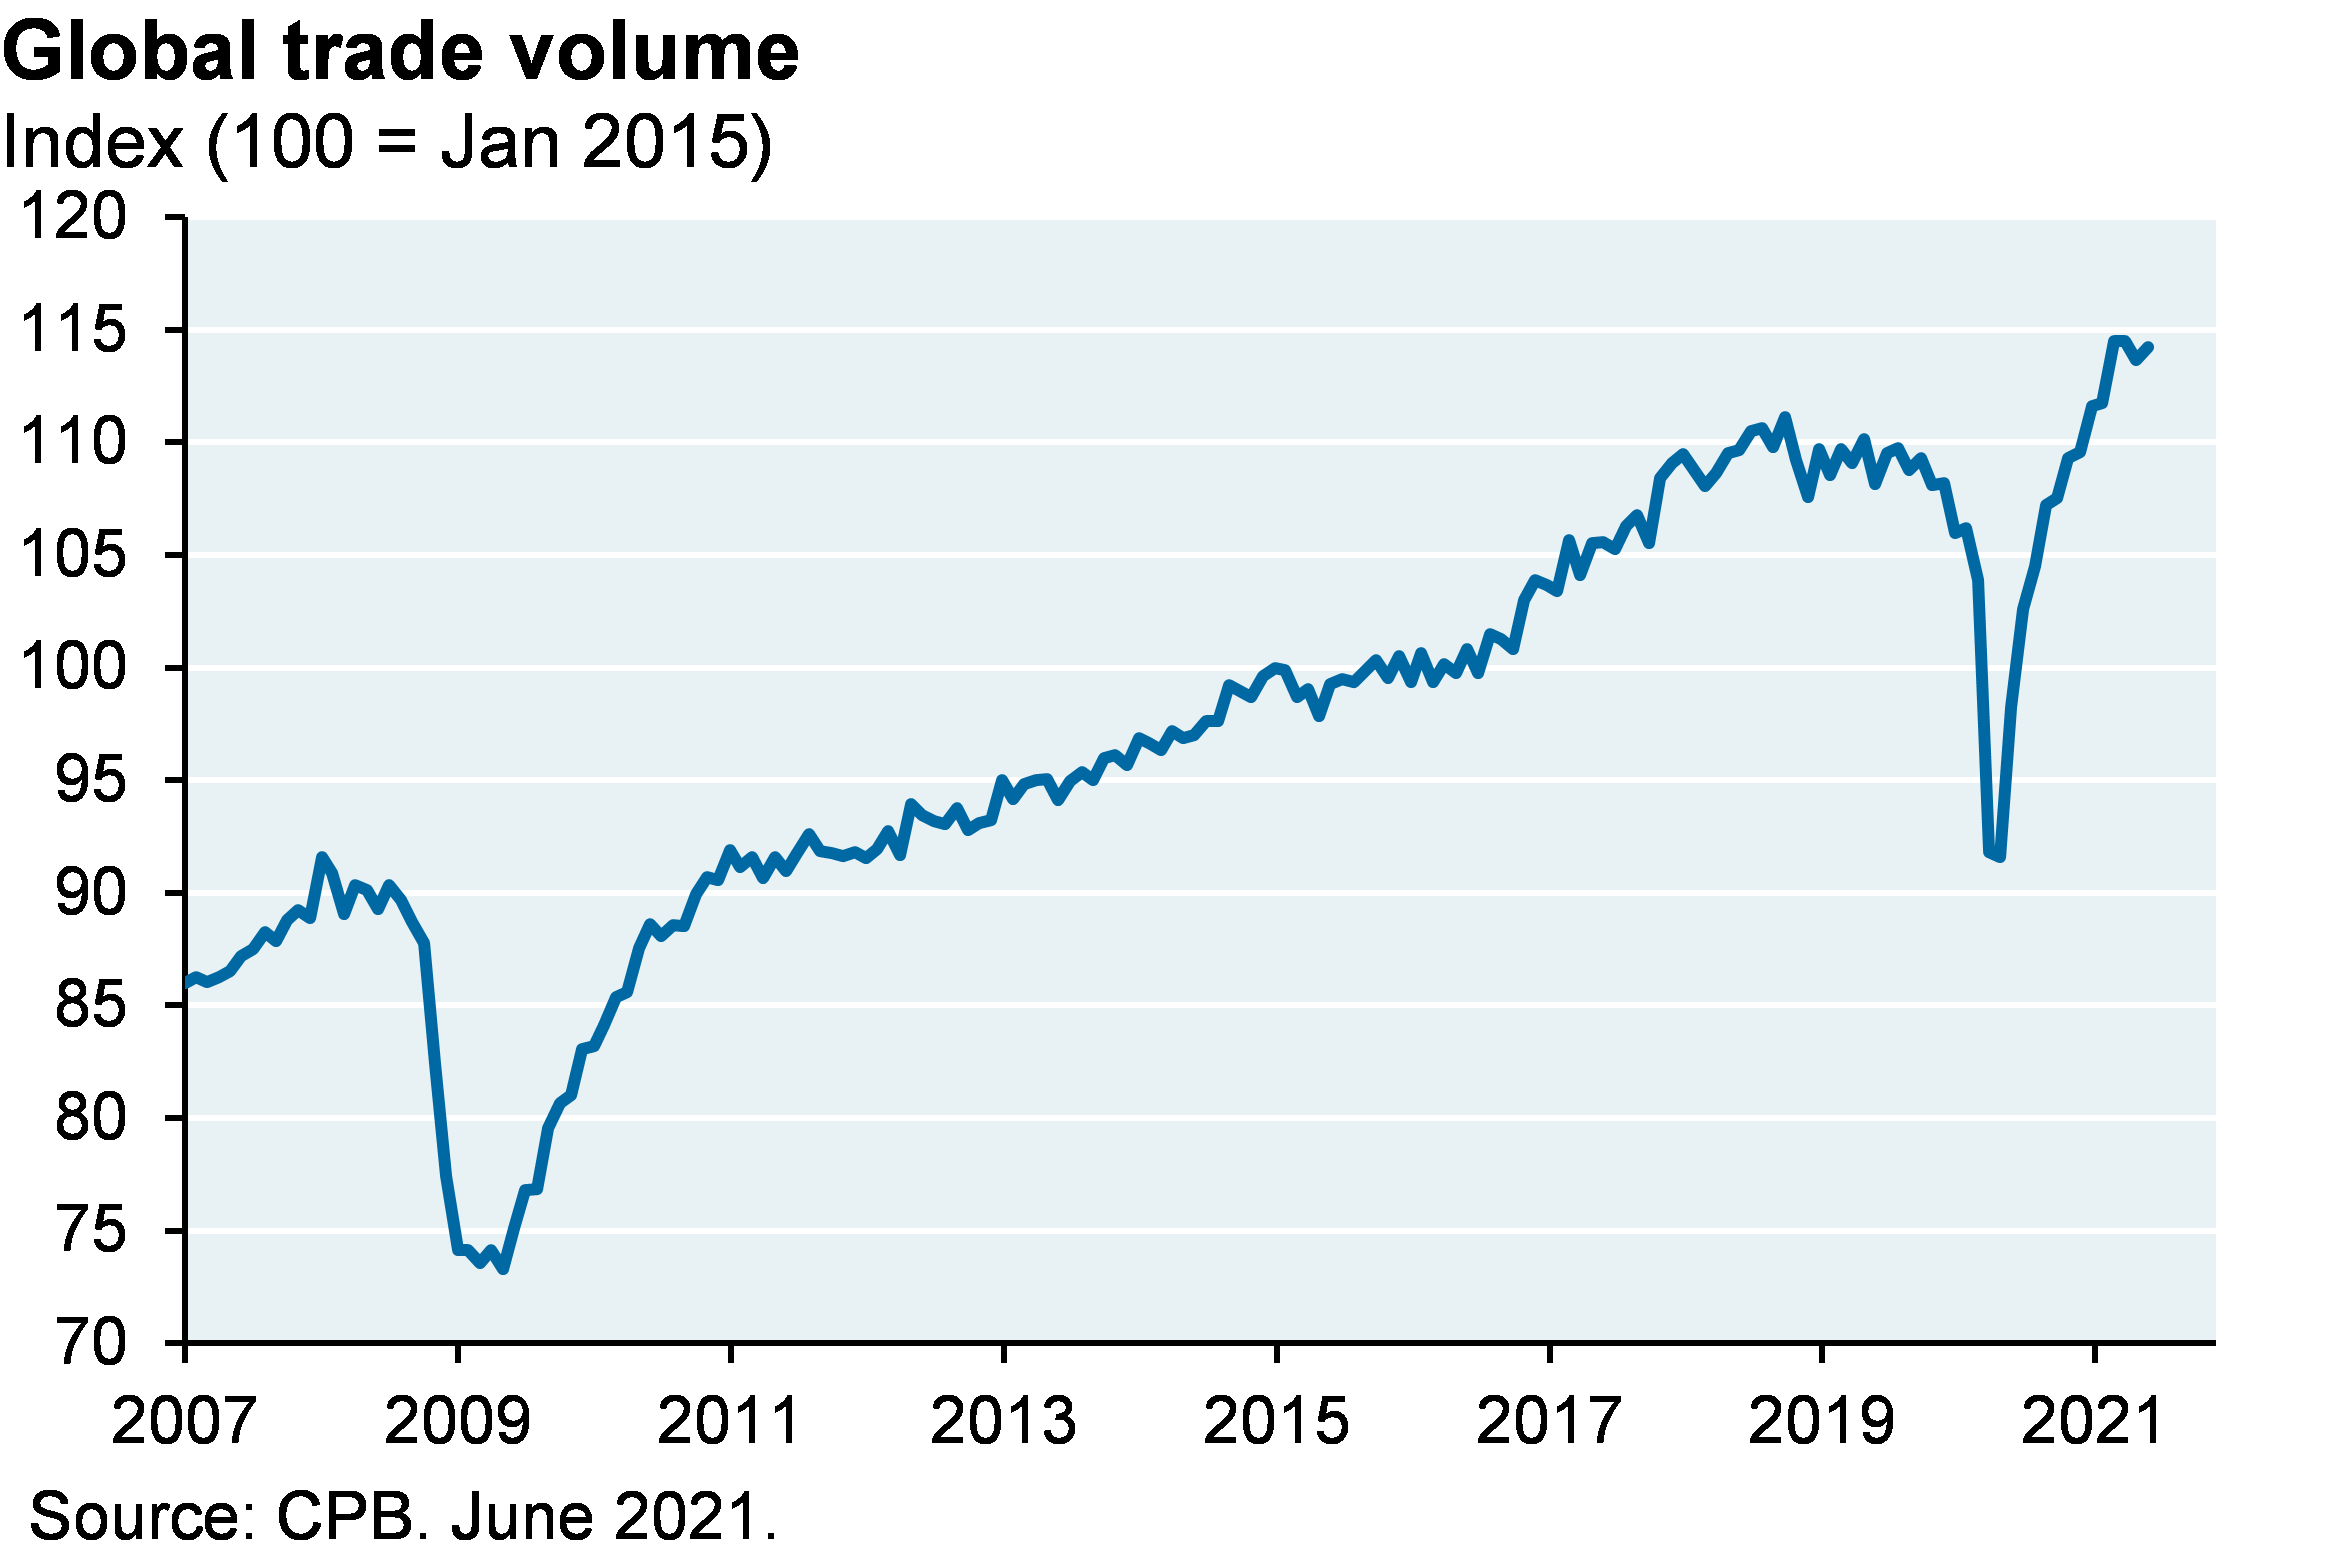
COVID has disrupted supply chains in two major ways: surging demand for imported consumer goods in the West due to pandemic work from home trends and other home improvement spending, and a decline in workers required to maintain and operate these supply chains. The surge in US import demand has led to a sharp rise in eastbound freight rates (see charts for Shanghai->LA and Shanghai->Rotterdam). However, westbound freight rates have not risen nearly as much, leading to an odd and problematic phenomenon: incentives for container owners to move them back to China empty to accelerate receipt of eastbound freight rates, instead of waiting for containers to be refilled to earn westbound freight rates as well. This is illustrated in the fourth chart which shows departing containers from LA/LB: a lot of them started leaving empty once eastbound freight rates surged. This further exacerbates supply chain issues, since US goods (i.e., grains) that were supposed to depart US railcars and warehouses for export remain in place, occupying space that US imported goods were destined for. 

Line chart shows the difference in rolling 5 quarter growth rates between goods and services. The dispersion in US goods spending vs services in the last few quarters is at the highest level on record.
Line chart shows the container freight rate between LA and Shanghai, shown in US dollars per 40ft box. While the Los Angeles to Shanghai container freight rate has remained steady since 2012 (though with a small recent spike), the Shanghai to Los Angeles freight rate has spiked from a normal value of around $2,000 to a most recent peak of over $12,000 per 40ft box.
Line chart shows the container freight rate between Shanghai and Rotterdam, shown in US dollars per 40ft box. While the Rotterdam to Shanghai container freight rate has remained steady since 2012 (though with a small recent uptick), the Shanghai to Rotterdam freight rate has spiked from a normal value of around $2,000 to a most recent peak of over $14,000 per 40ft box.
Line chart shows Los Angeles / Long Beach empty vs loaded container exports, shown as 20-foot-equivalent units. Loaded container exports has stayed relatively constant at around 200,000 20-foot-equivalent units, while empty containers has spiked to around 600,000 20-foot equivalent units.
 

The other big bottleneck: the semiconductor shortage

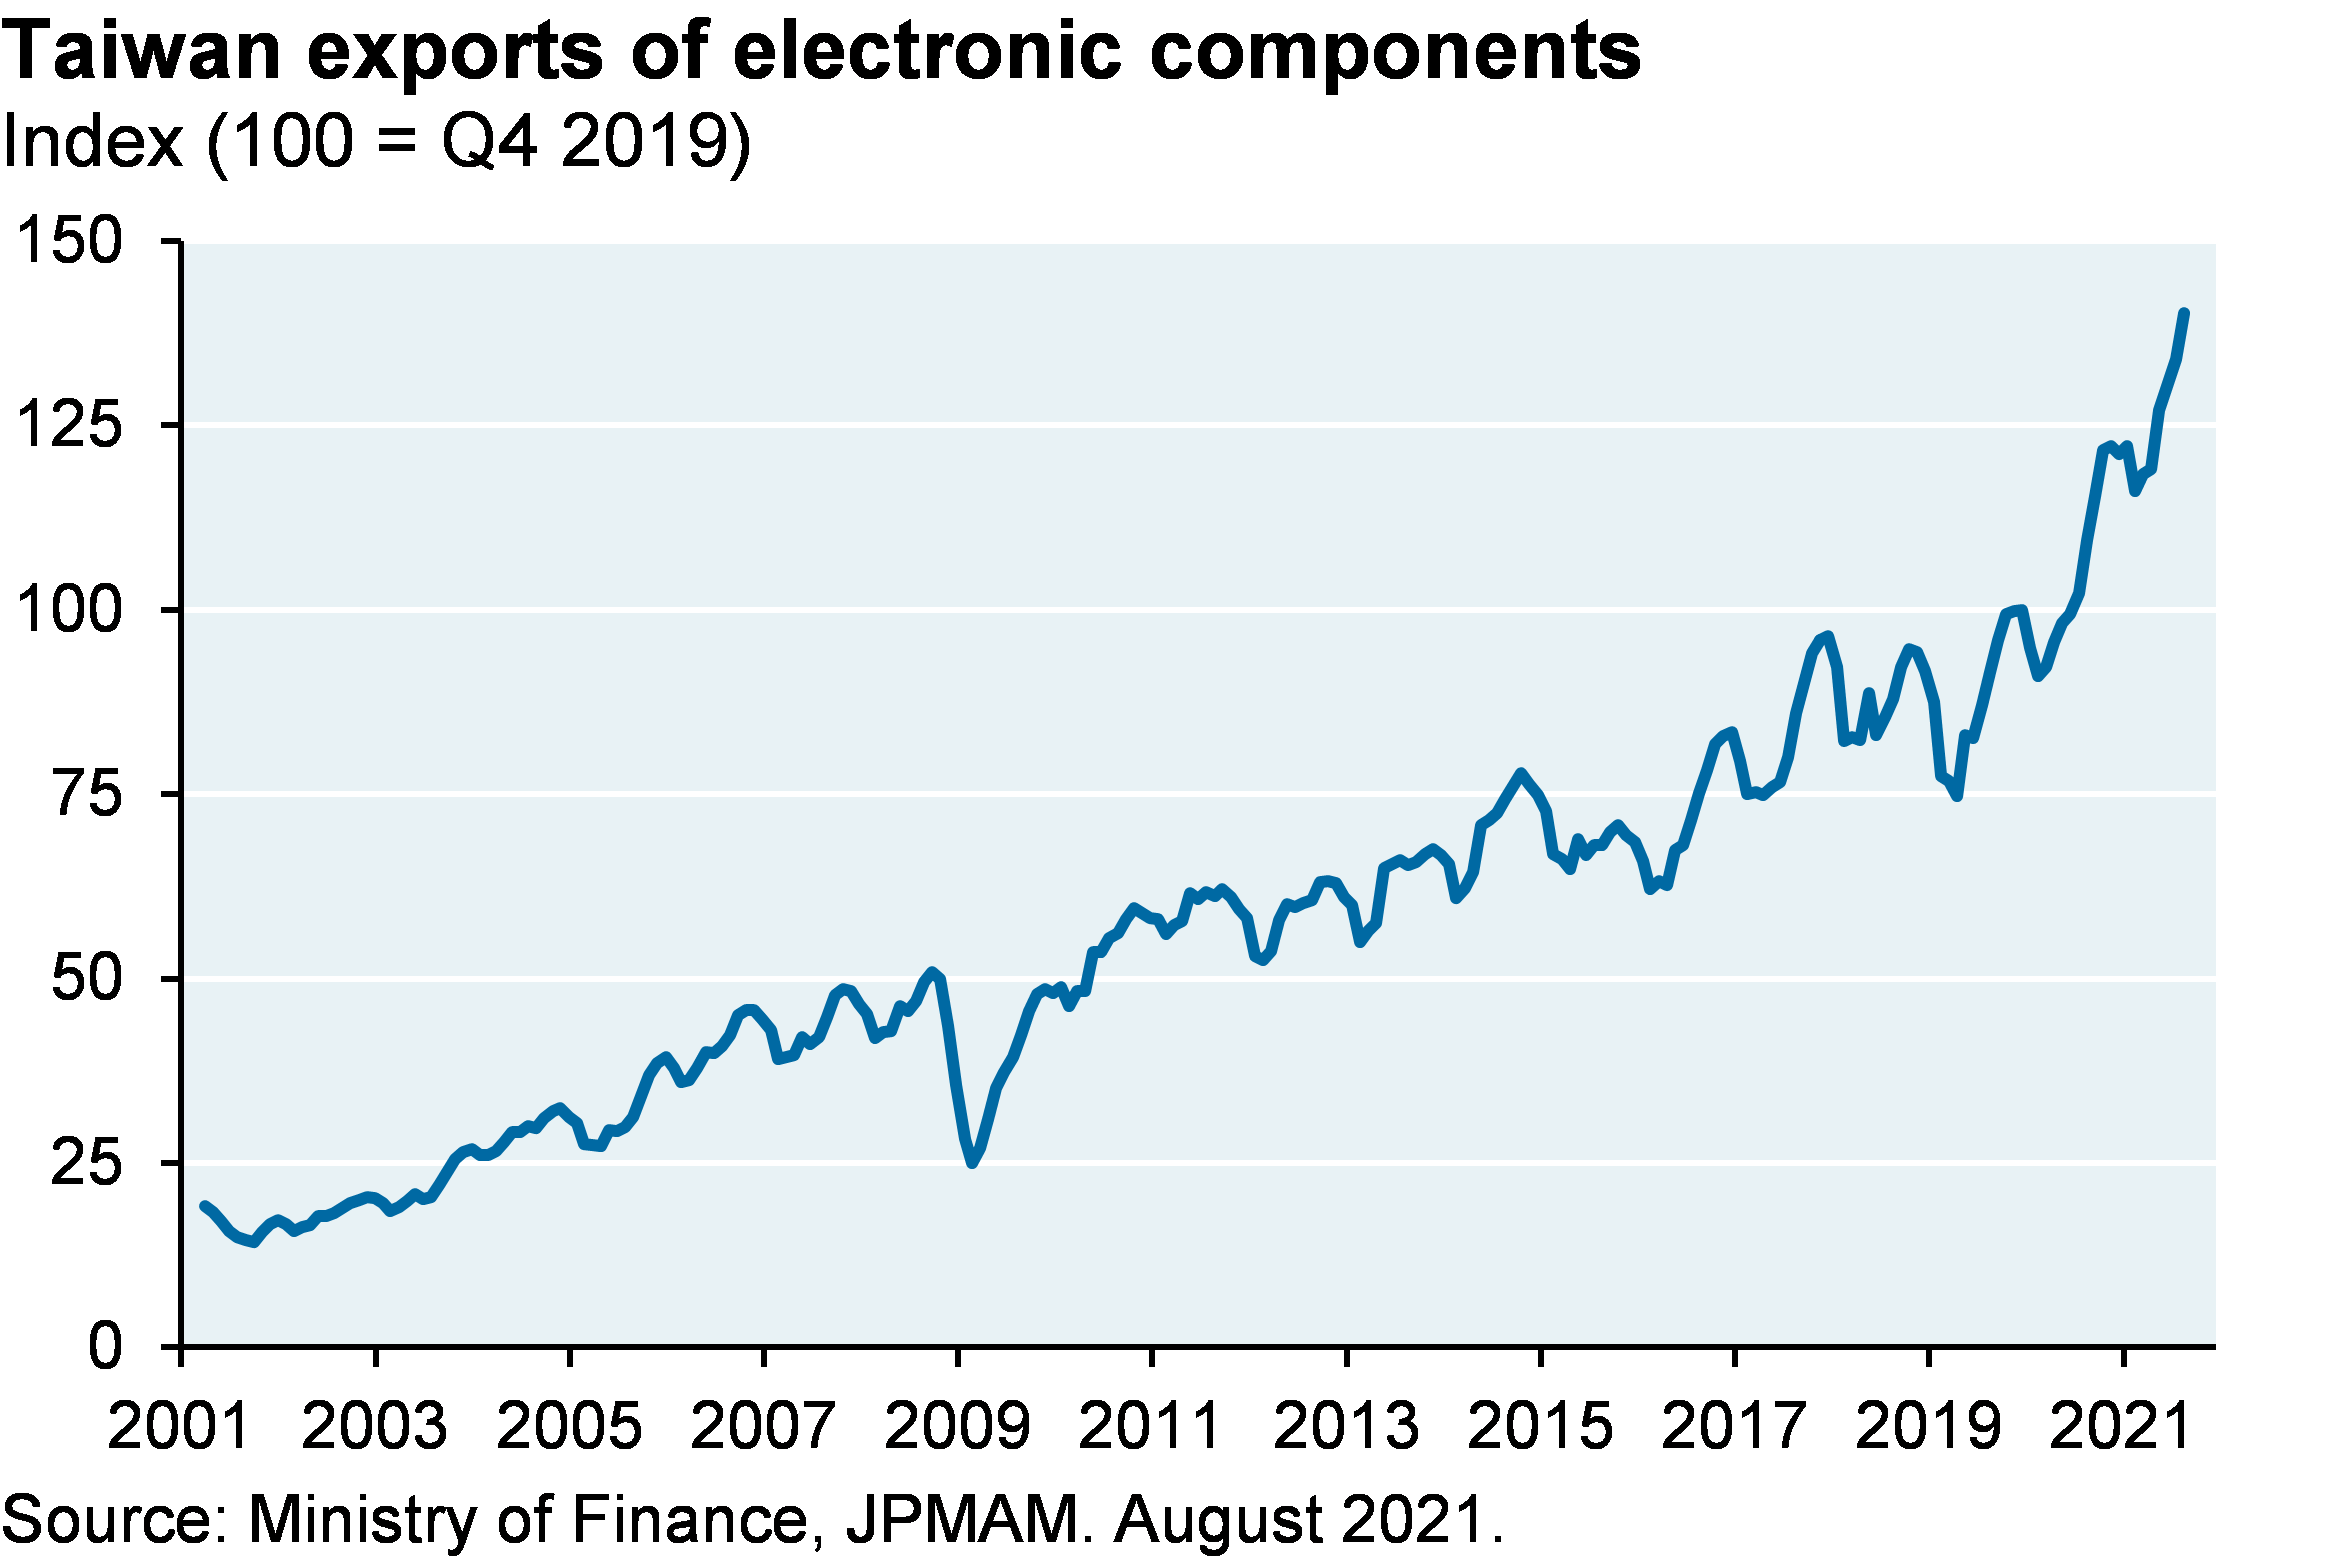
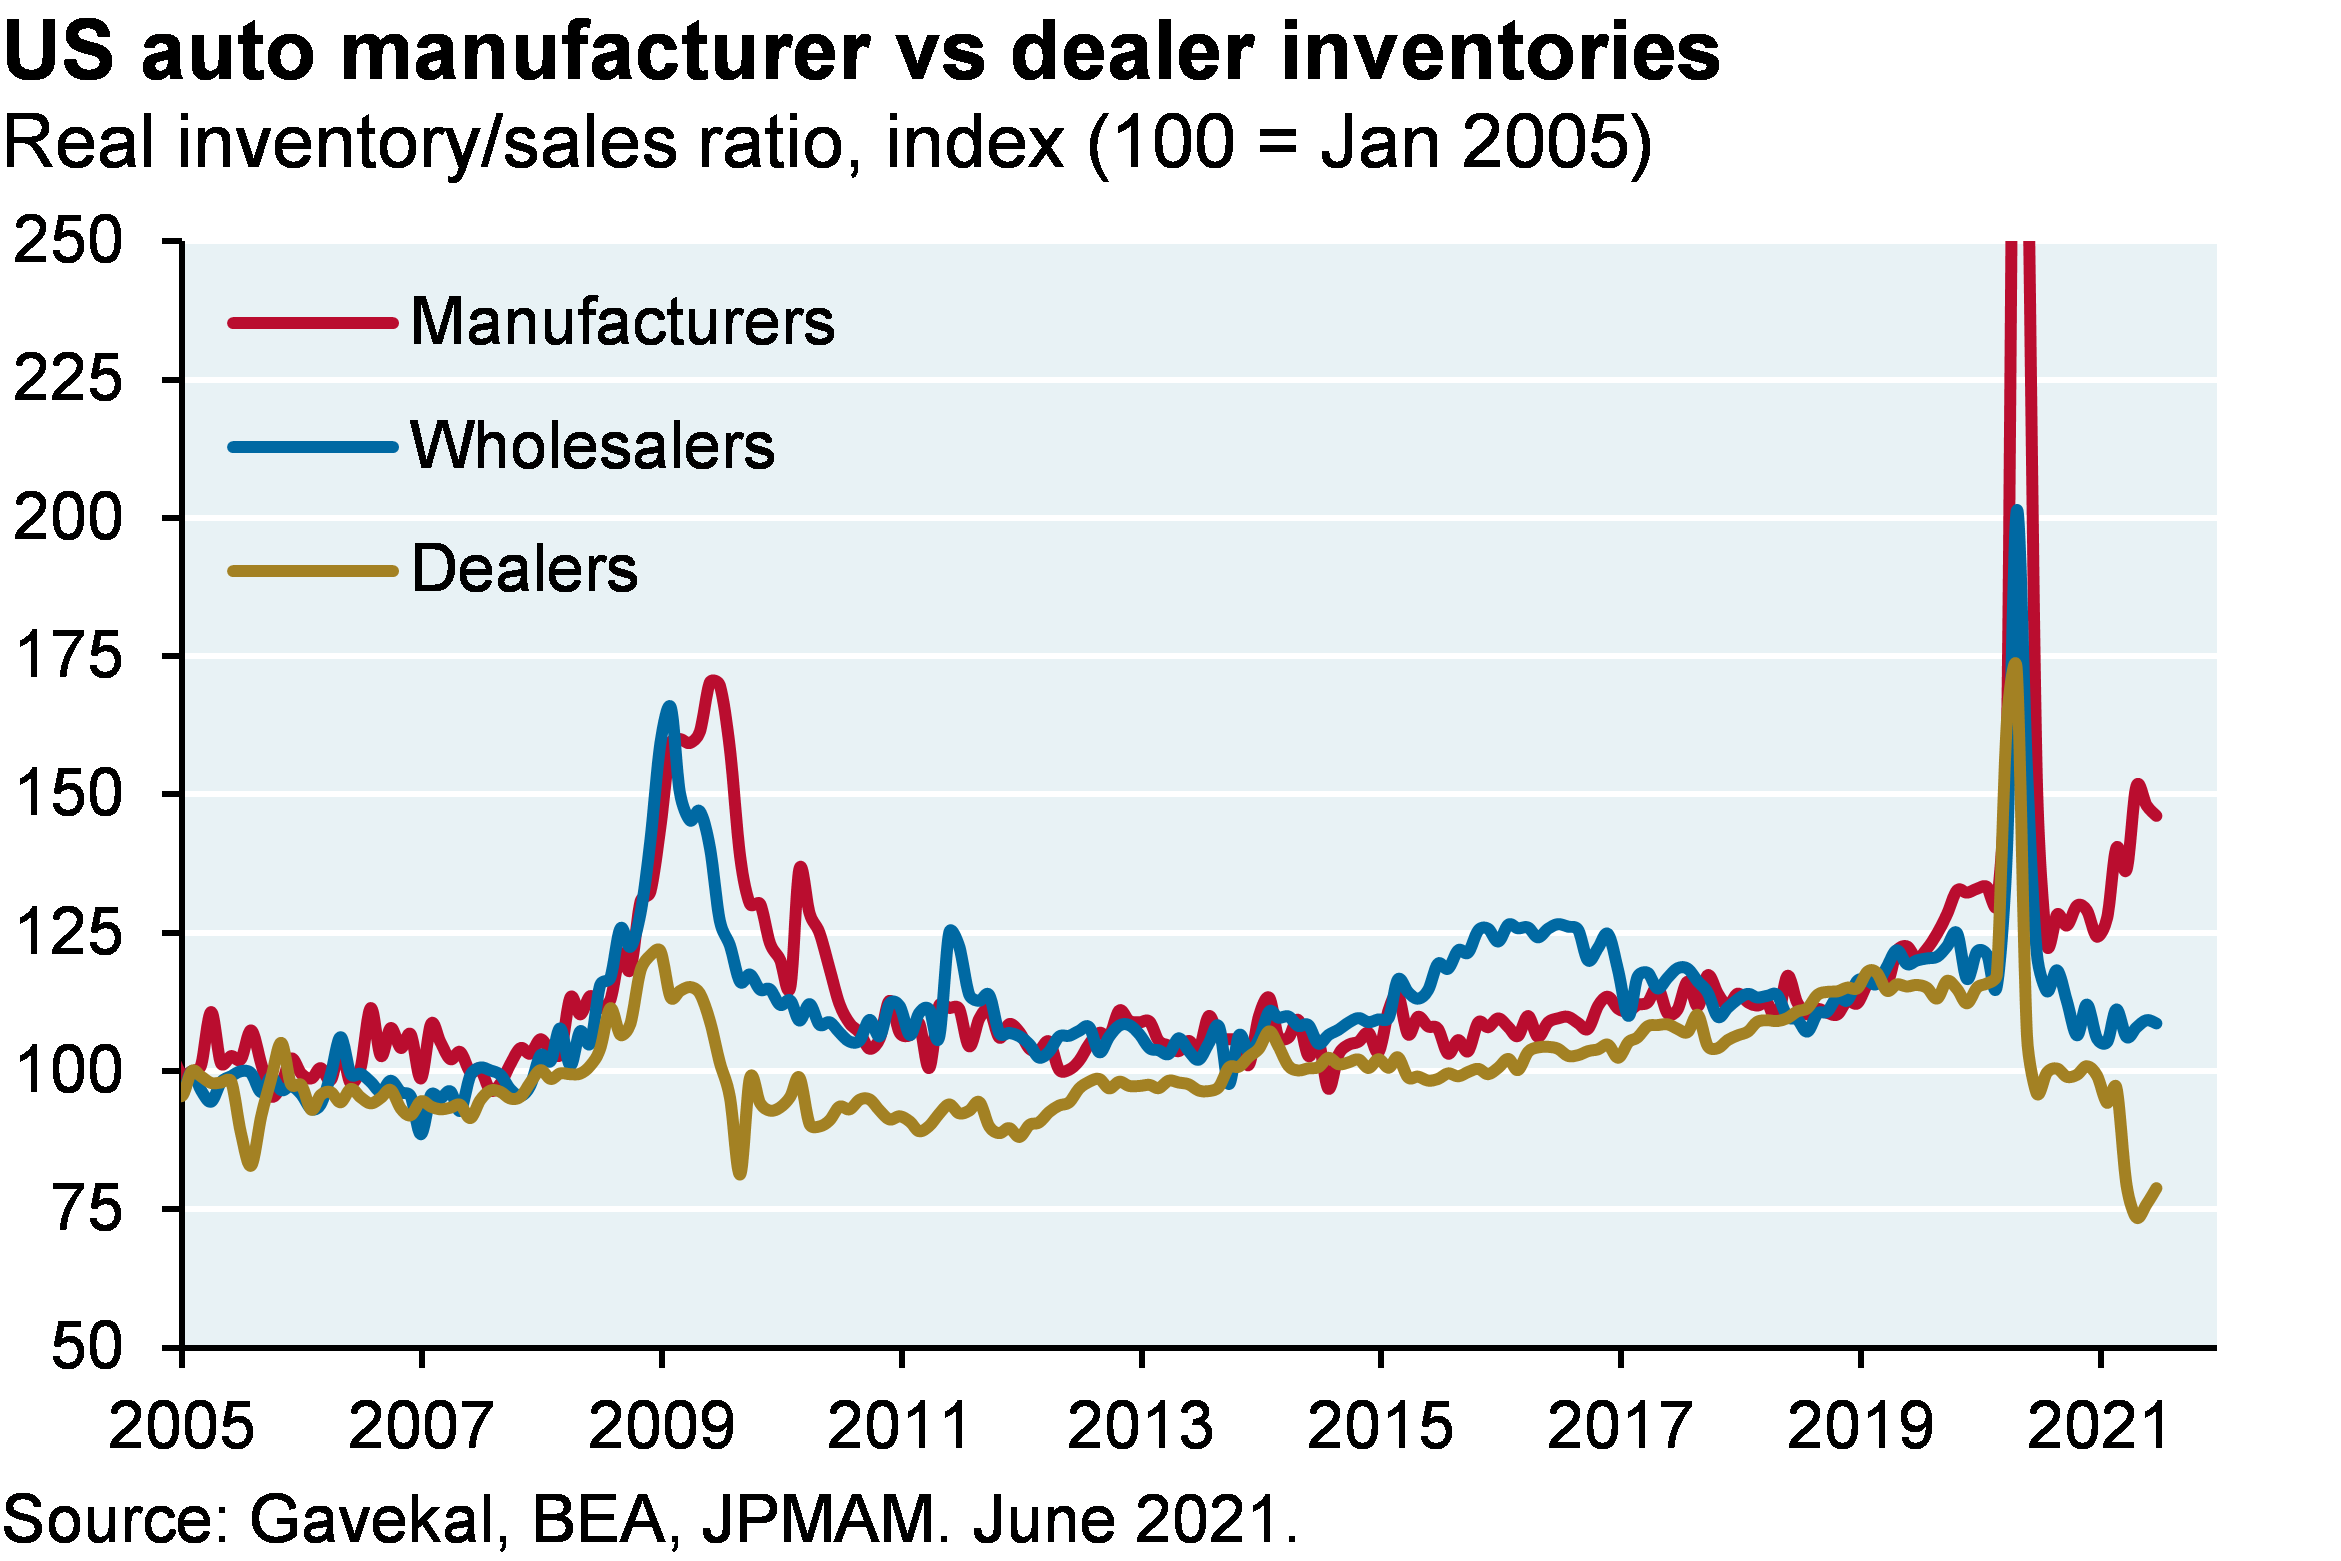
Semiconductors are the world’s 4th most traded good after crude oil, refined oil and cars. Strong demand existed before COVID and reflected the chip-intensity of 5G, AI, electric vehicles (3-5x the chip content of ICE cars) and the internet of things. Current chip shortages are mostly related to older and simpler 200-mm silicon wafers used in cars, computers, monitors, laptops, TVs, refrigerators and washing machines. Demand for many of these items soared during the pandemic as people built out home offices and related projects; this surge in demand is illustrated below via the rise in Taiwanese electronic component exports. One by-product of the shortage: a rise in US auto manufacturer inventories and a collapse in dealer inventories as manufacturers wait for the chips they need. Auto consulting firm Alix now estimates that the semiconductor shortage will cost US auto manufacturers $210 bn this year, up from their $60 bn estimate back in January. Ford is actually offering customers faster delivery if they agree to “lower feature content”, which translates into fewer semiconductors.

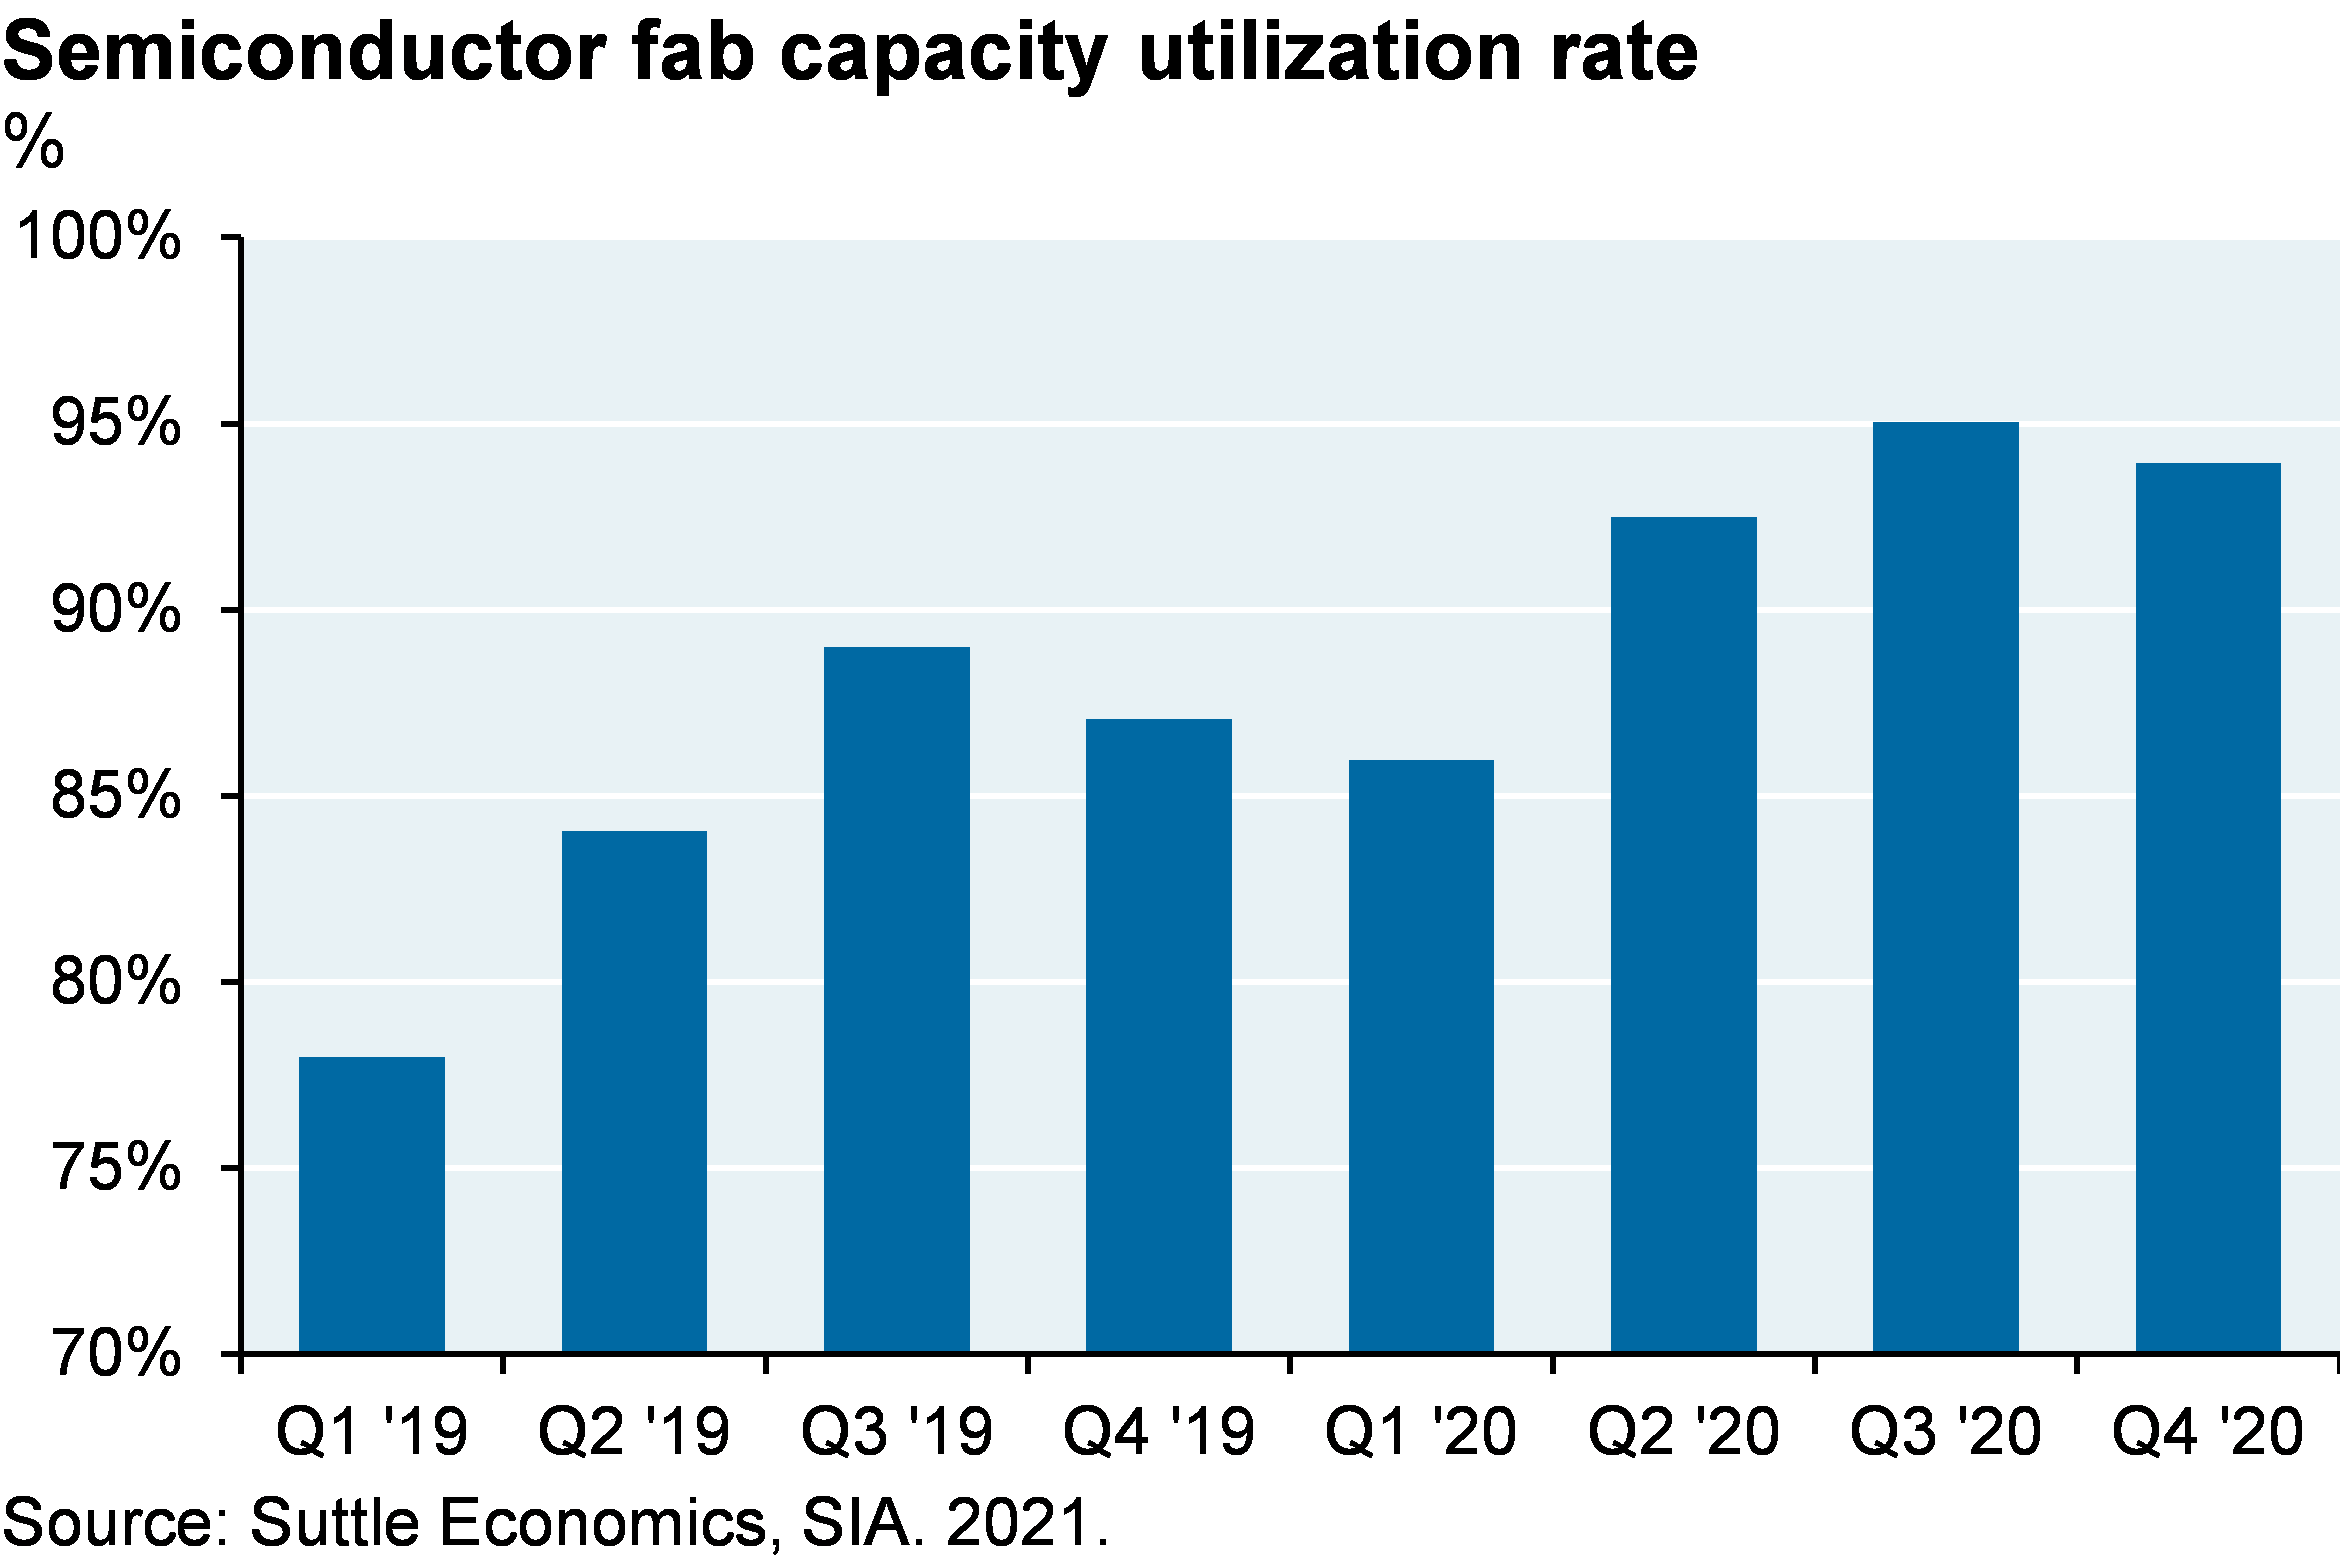
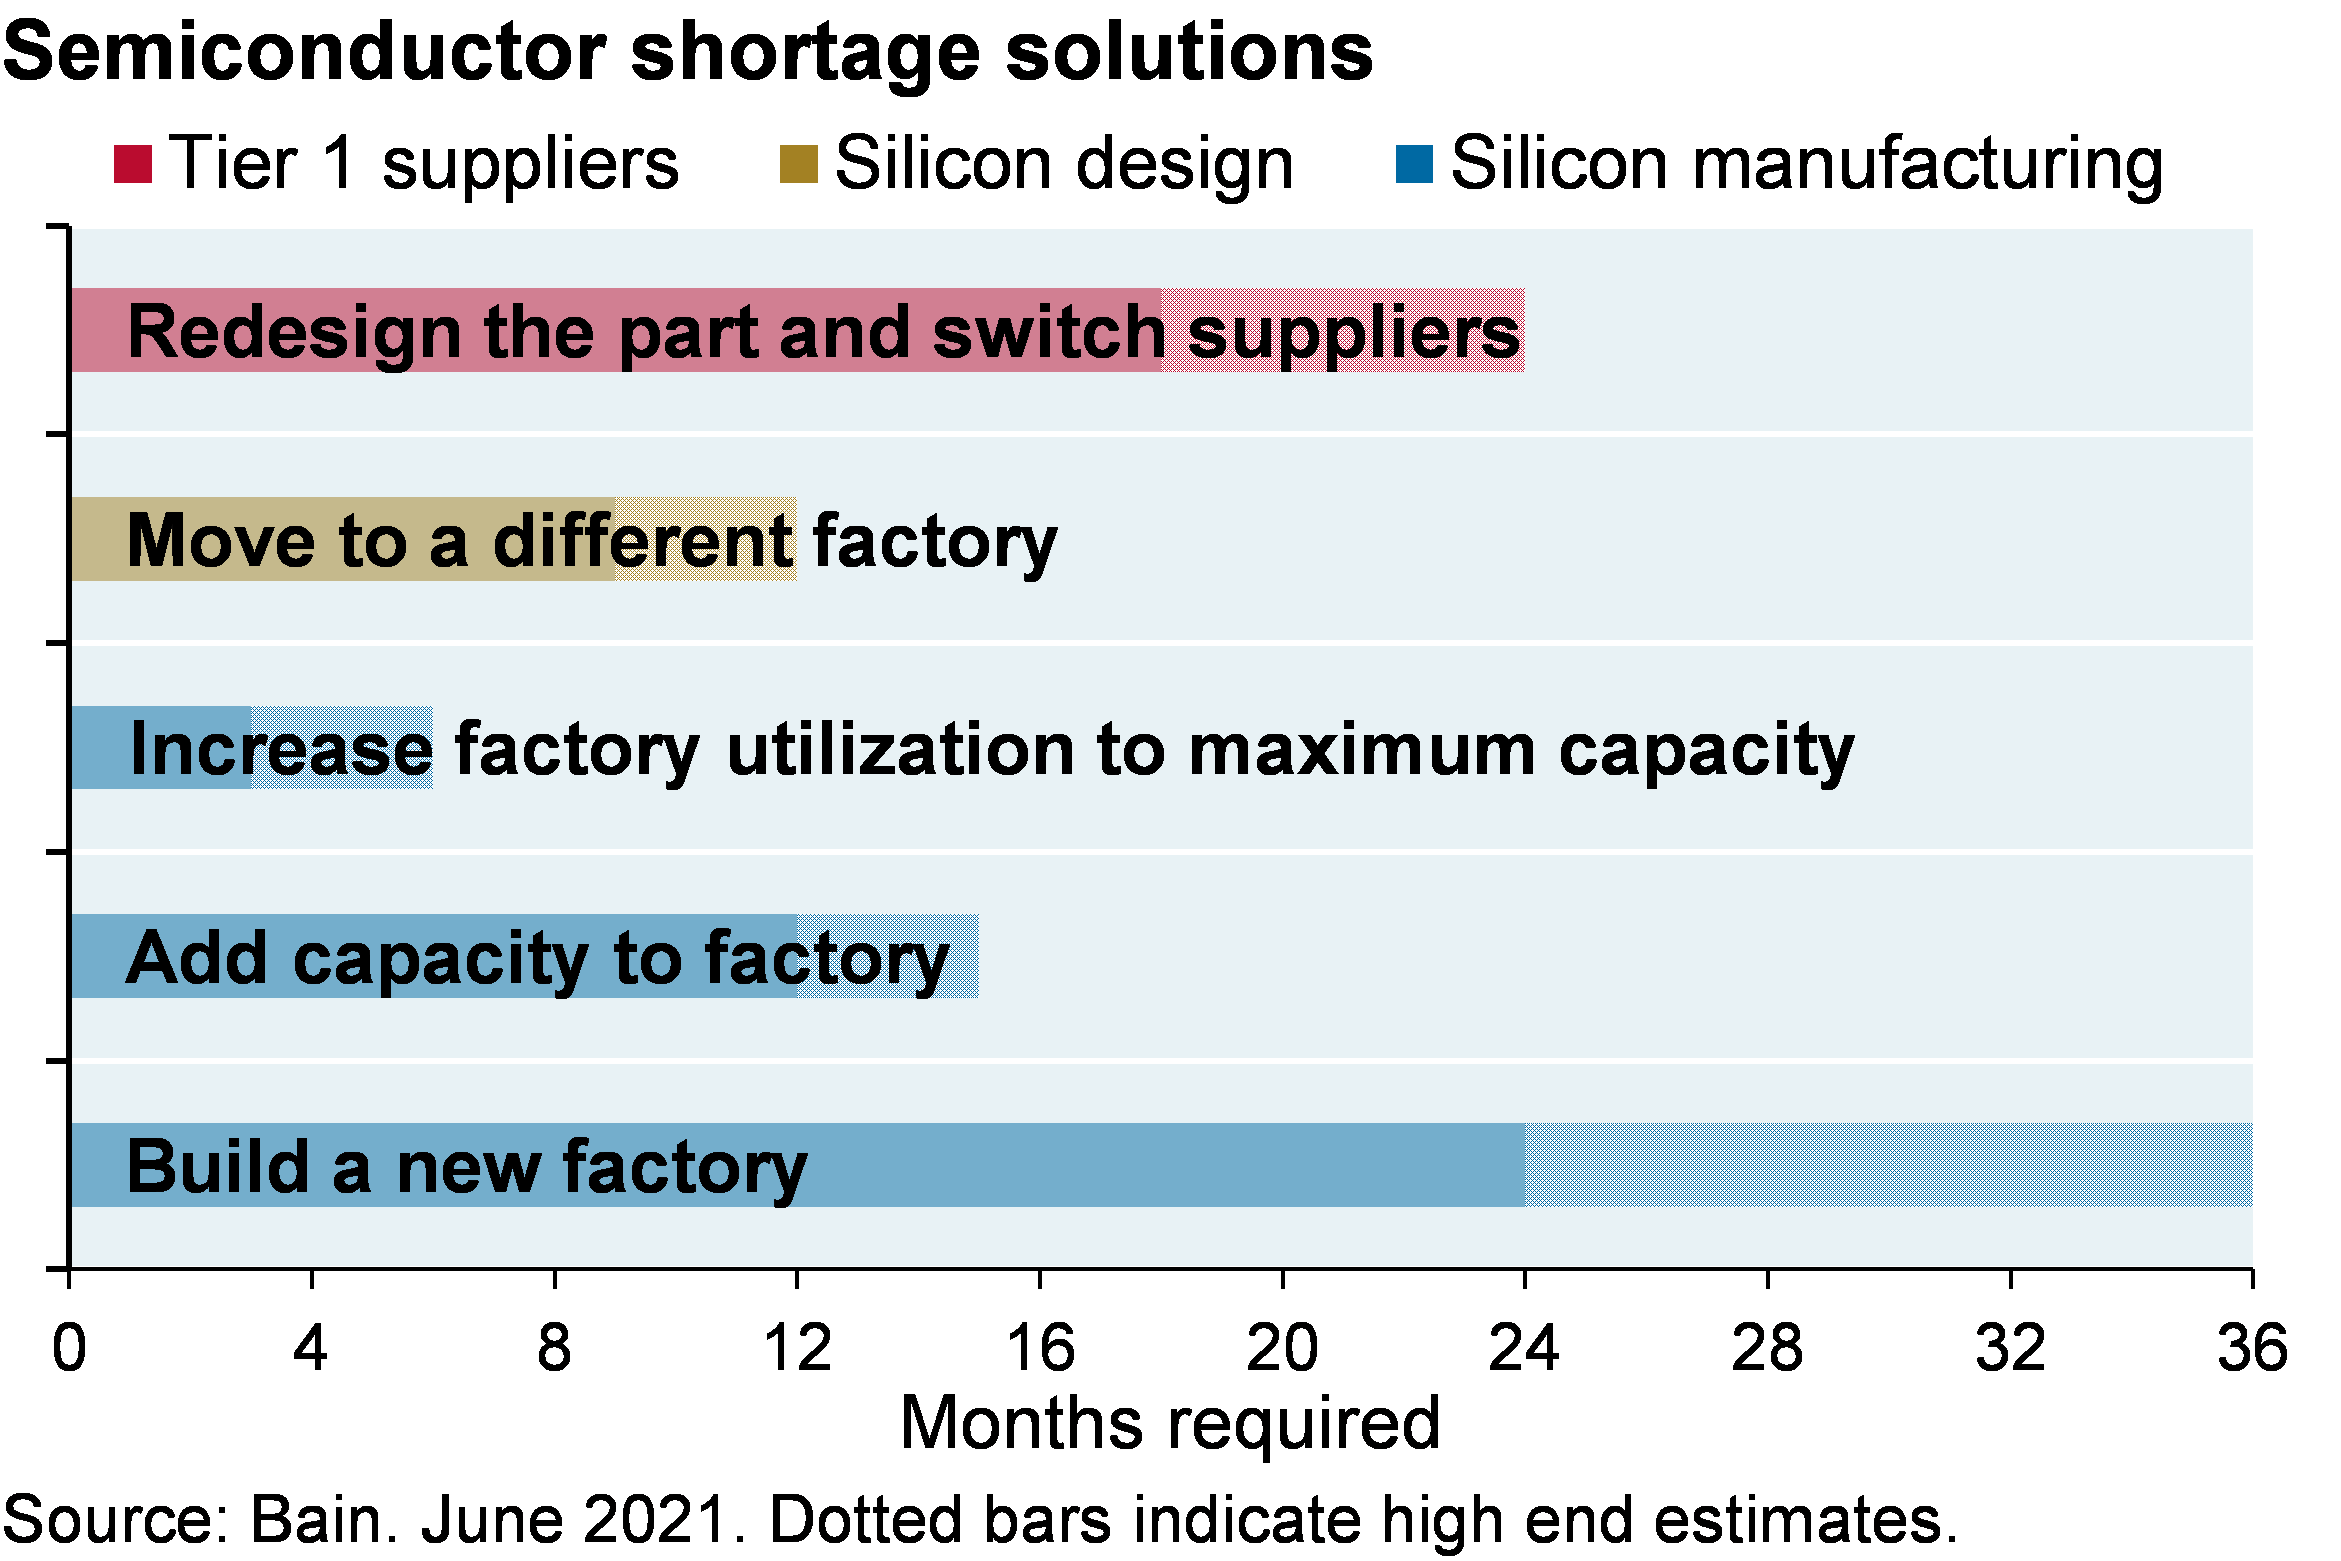
There’s limited economic incentive to build new 200-mm chip plants given wafer-thin margins; only a handful of new ones are planned for 2022. Even so, there’s a few billion dollars being invested to expand capacity by ~20% in existing plants, in which case the semiconductor squeeze may start to ease by Q2 2022. Auto manufacturers are also discussing longer term contracts with Tier 2 suppliers that might incent them to build out new 200-mm capacity. As shown below, adding capacity to existing factories will take a few months at least, in which case the semiconductor shortage will drag on into next year. 

Line chart shows exports of electronic components from Taiwan from 2001 to 2021. Exports have steadily increased throughout this time period.
Line chart shows inventory to sales ratios for US auto manufacturers, wholesalers and dealers. Automaker inventories have recently been piling up as the supply shortage continues, while wholesalers and dealer inventories have fallen.
Bar chart shows semiconductor fab capacity utilization rate as a percentage since Q1 2019. Chart shows that the capacity utilization rate has risen from 75% in Q1 2019 to nearly 95% in Q4 2020.
Bar chart shows the low and high range of months required to implement various solutions to the chip shortage problem. Tier 1 supplies can redesign parts and switch suppliers, taking 18-24 months. Silicon designers can move to a different factory, which would take about 9 to 12 months. Silicon manufacturers can either increase factory utilization (3-6 months), add factory capacity (12-15 months), or build a new factory (24-36 months).


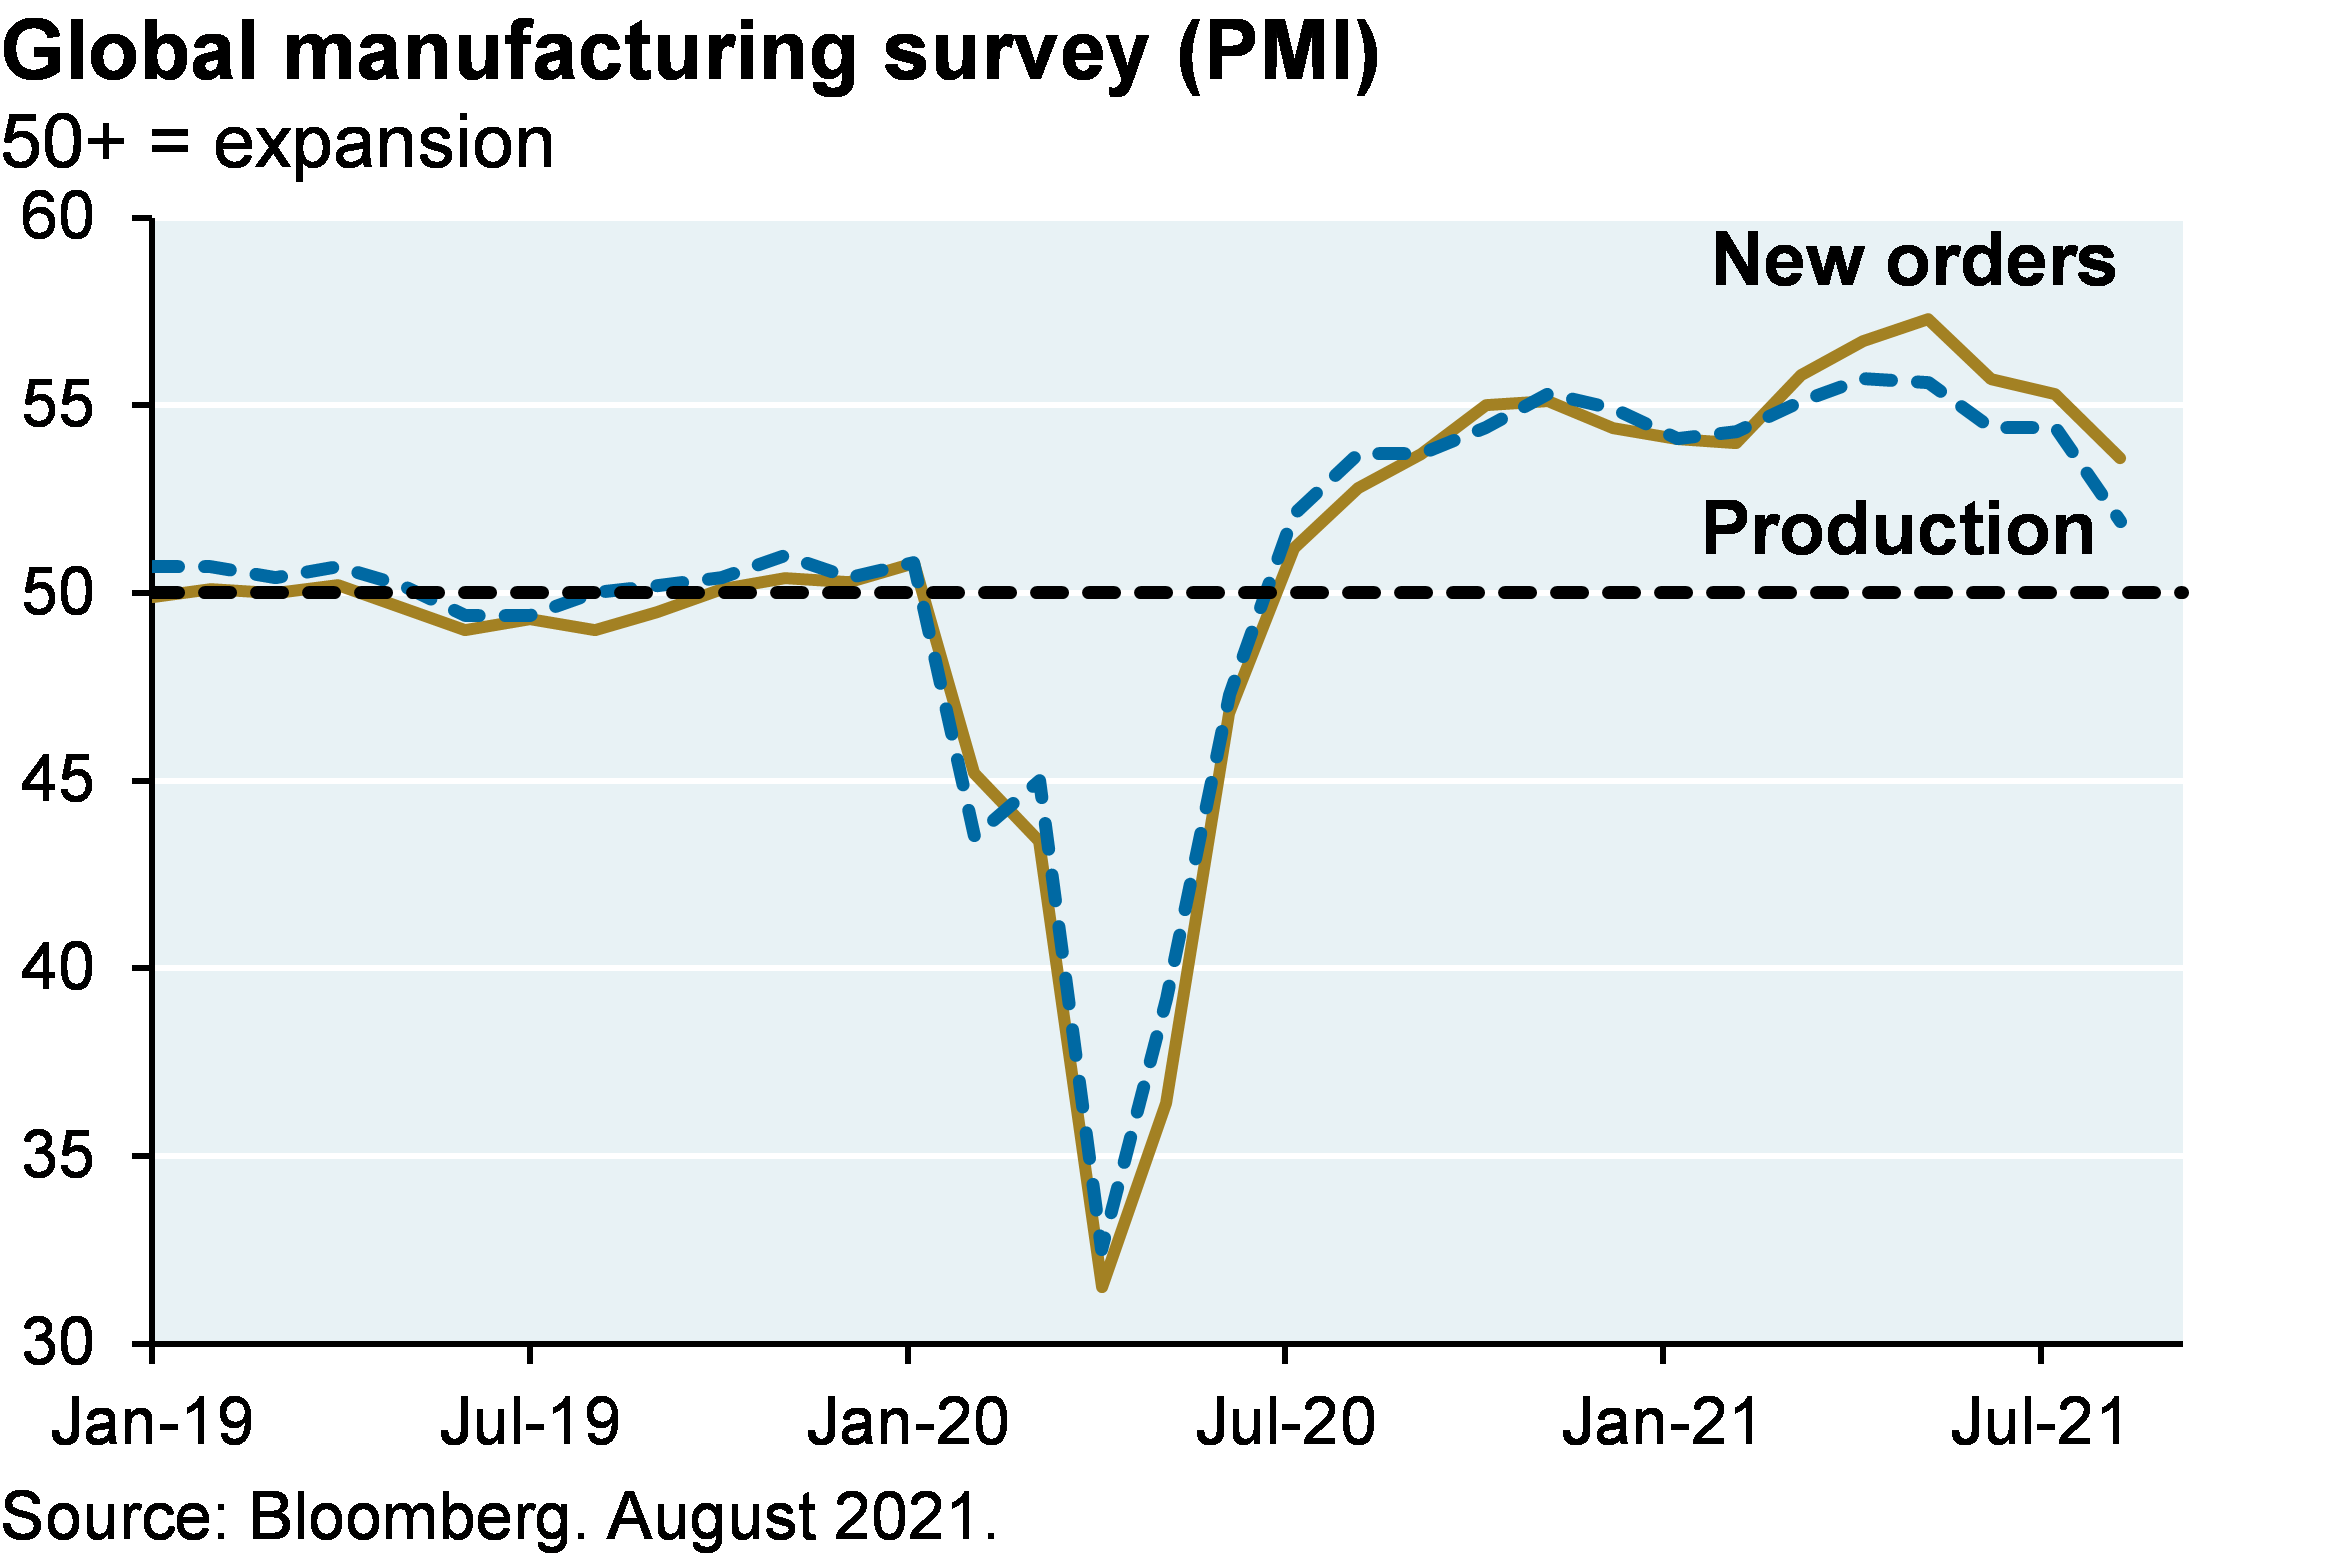
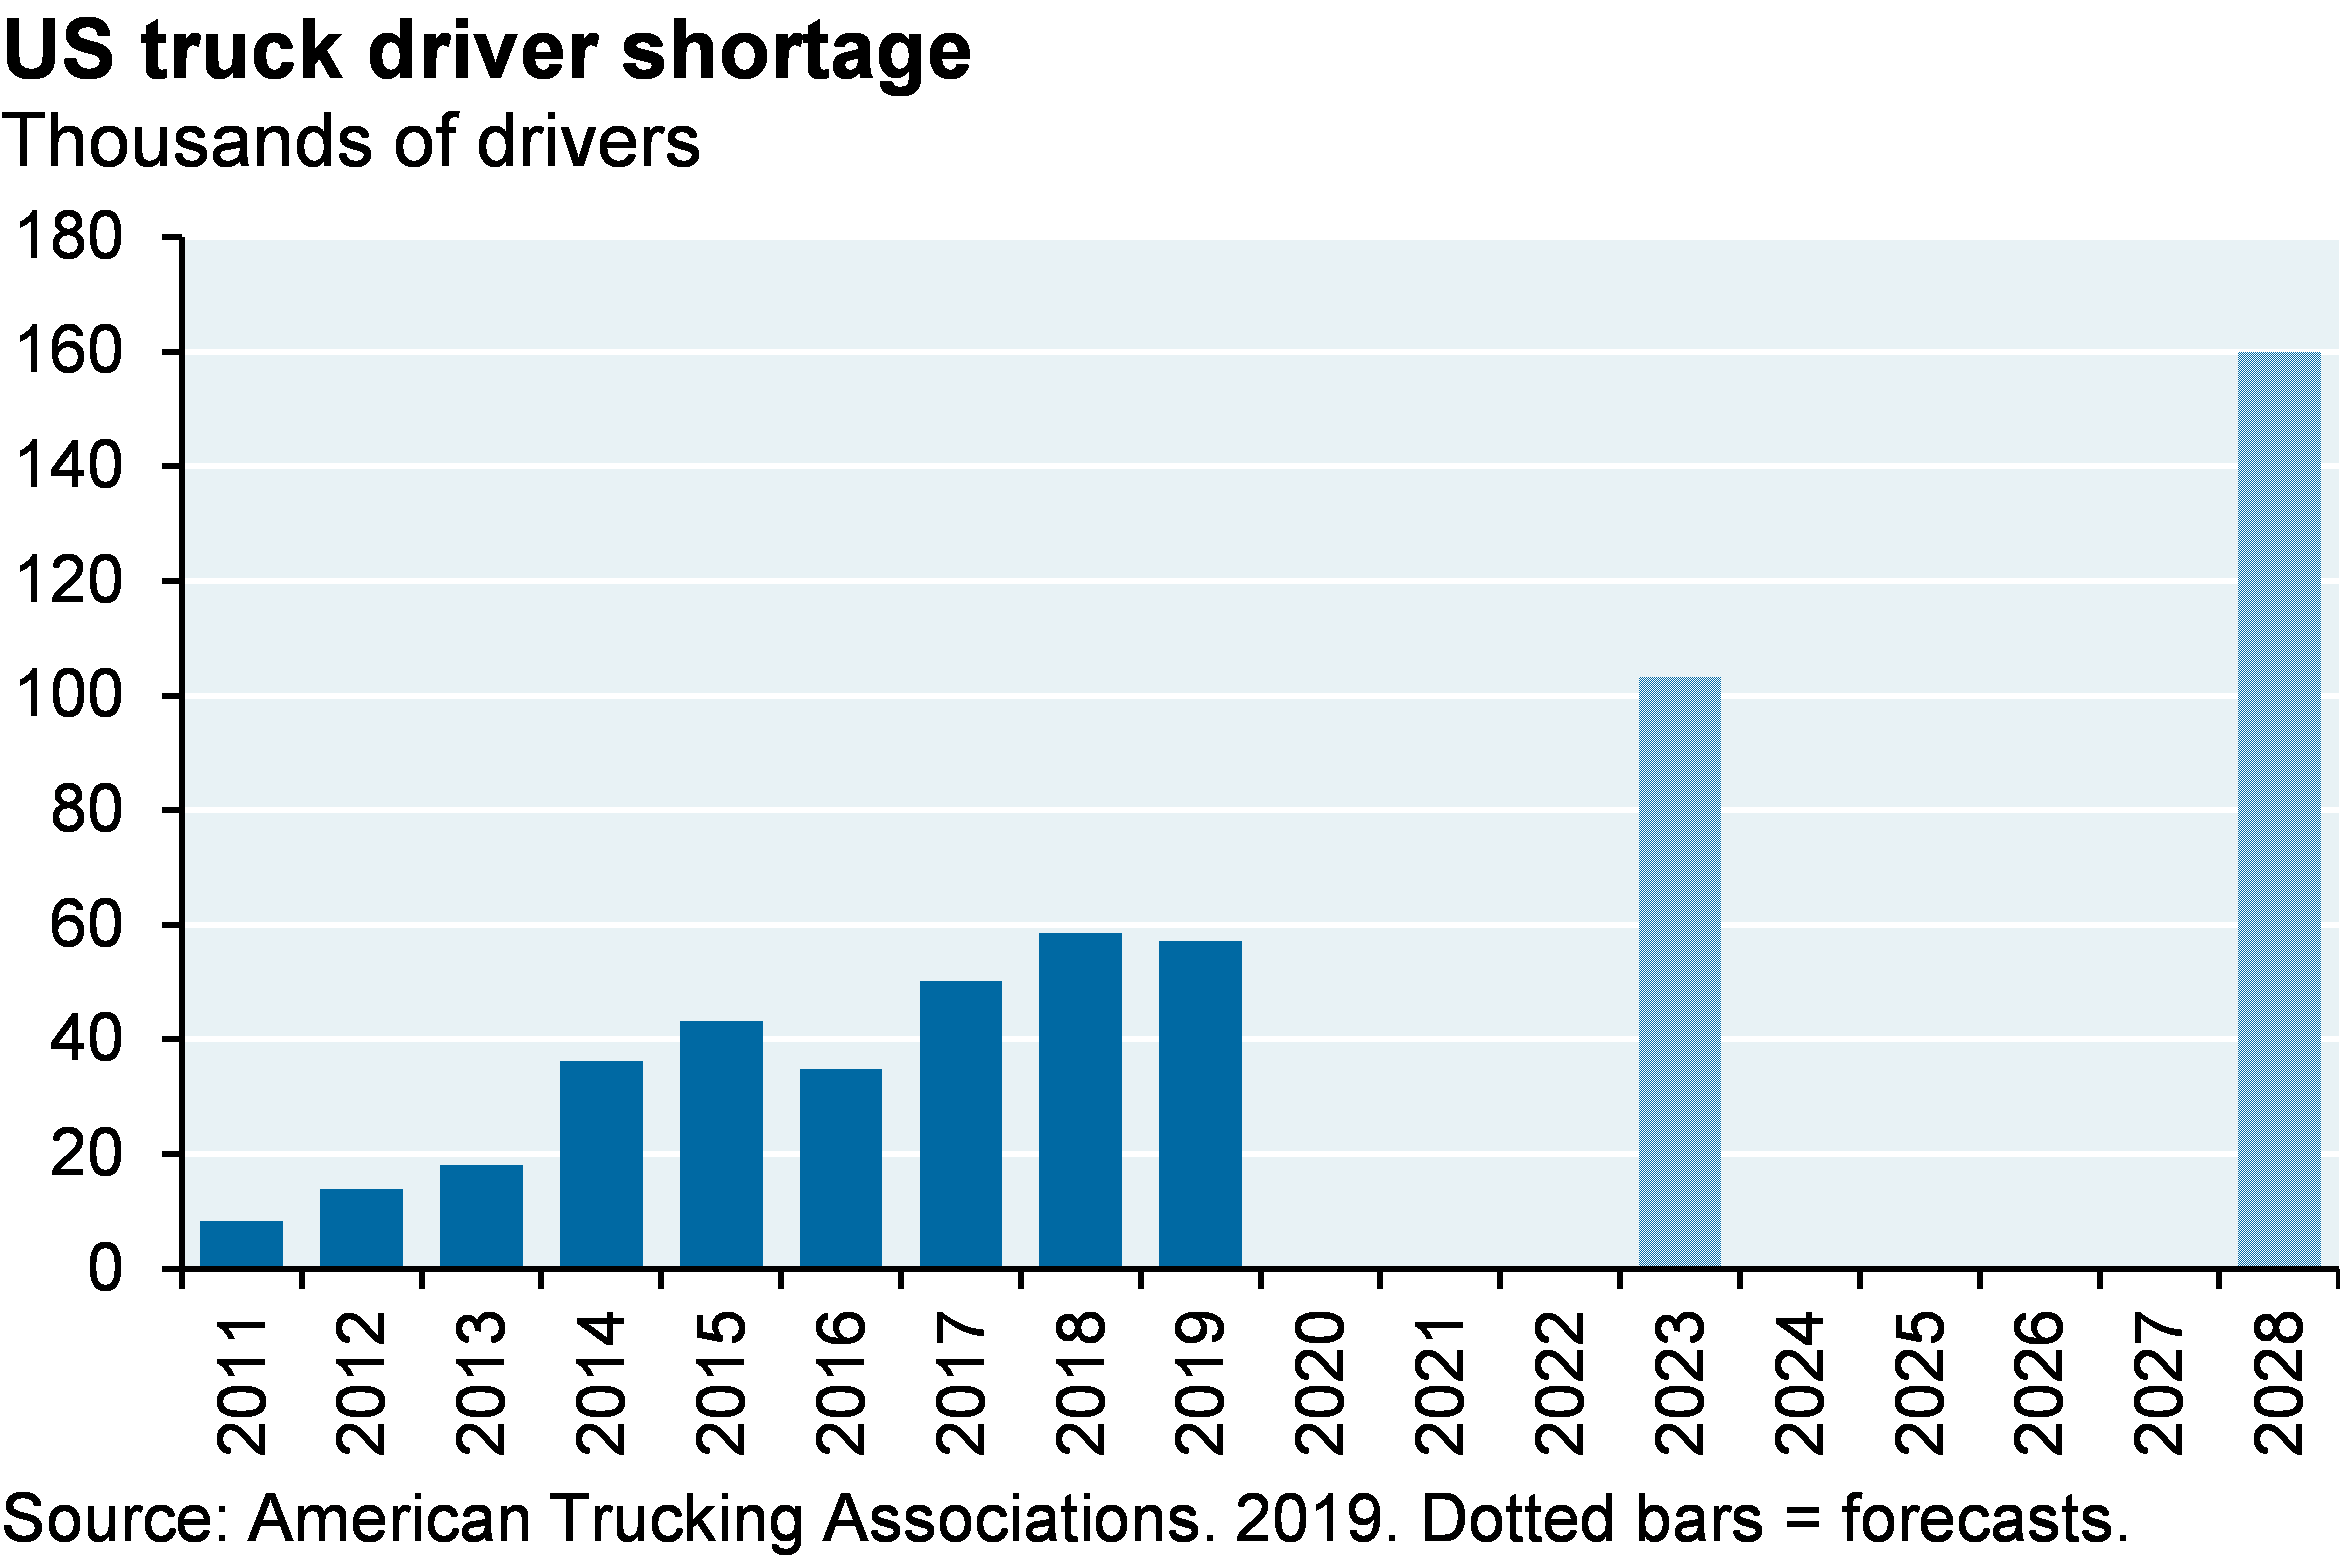
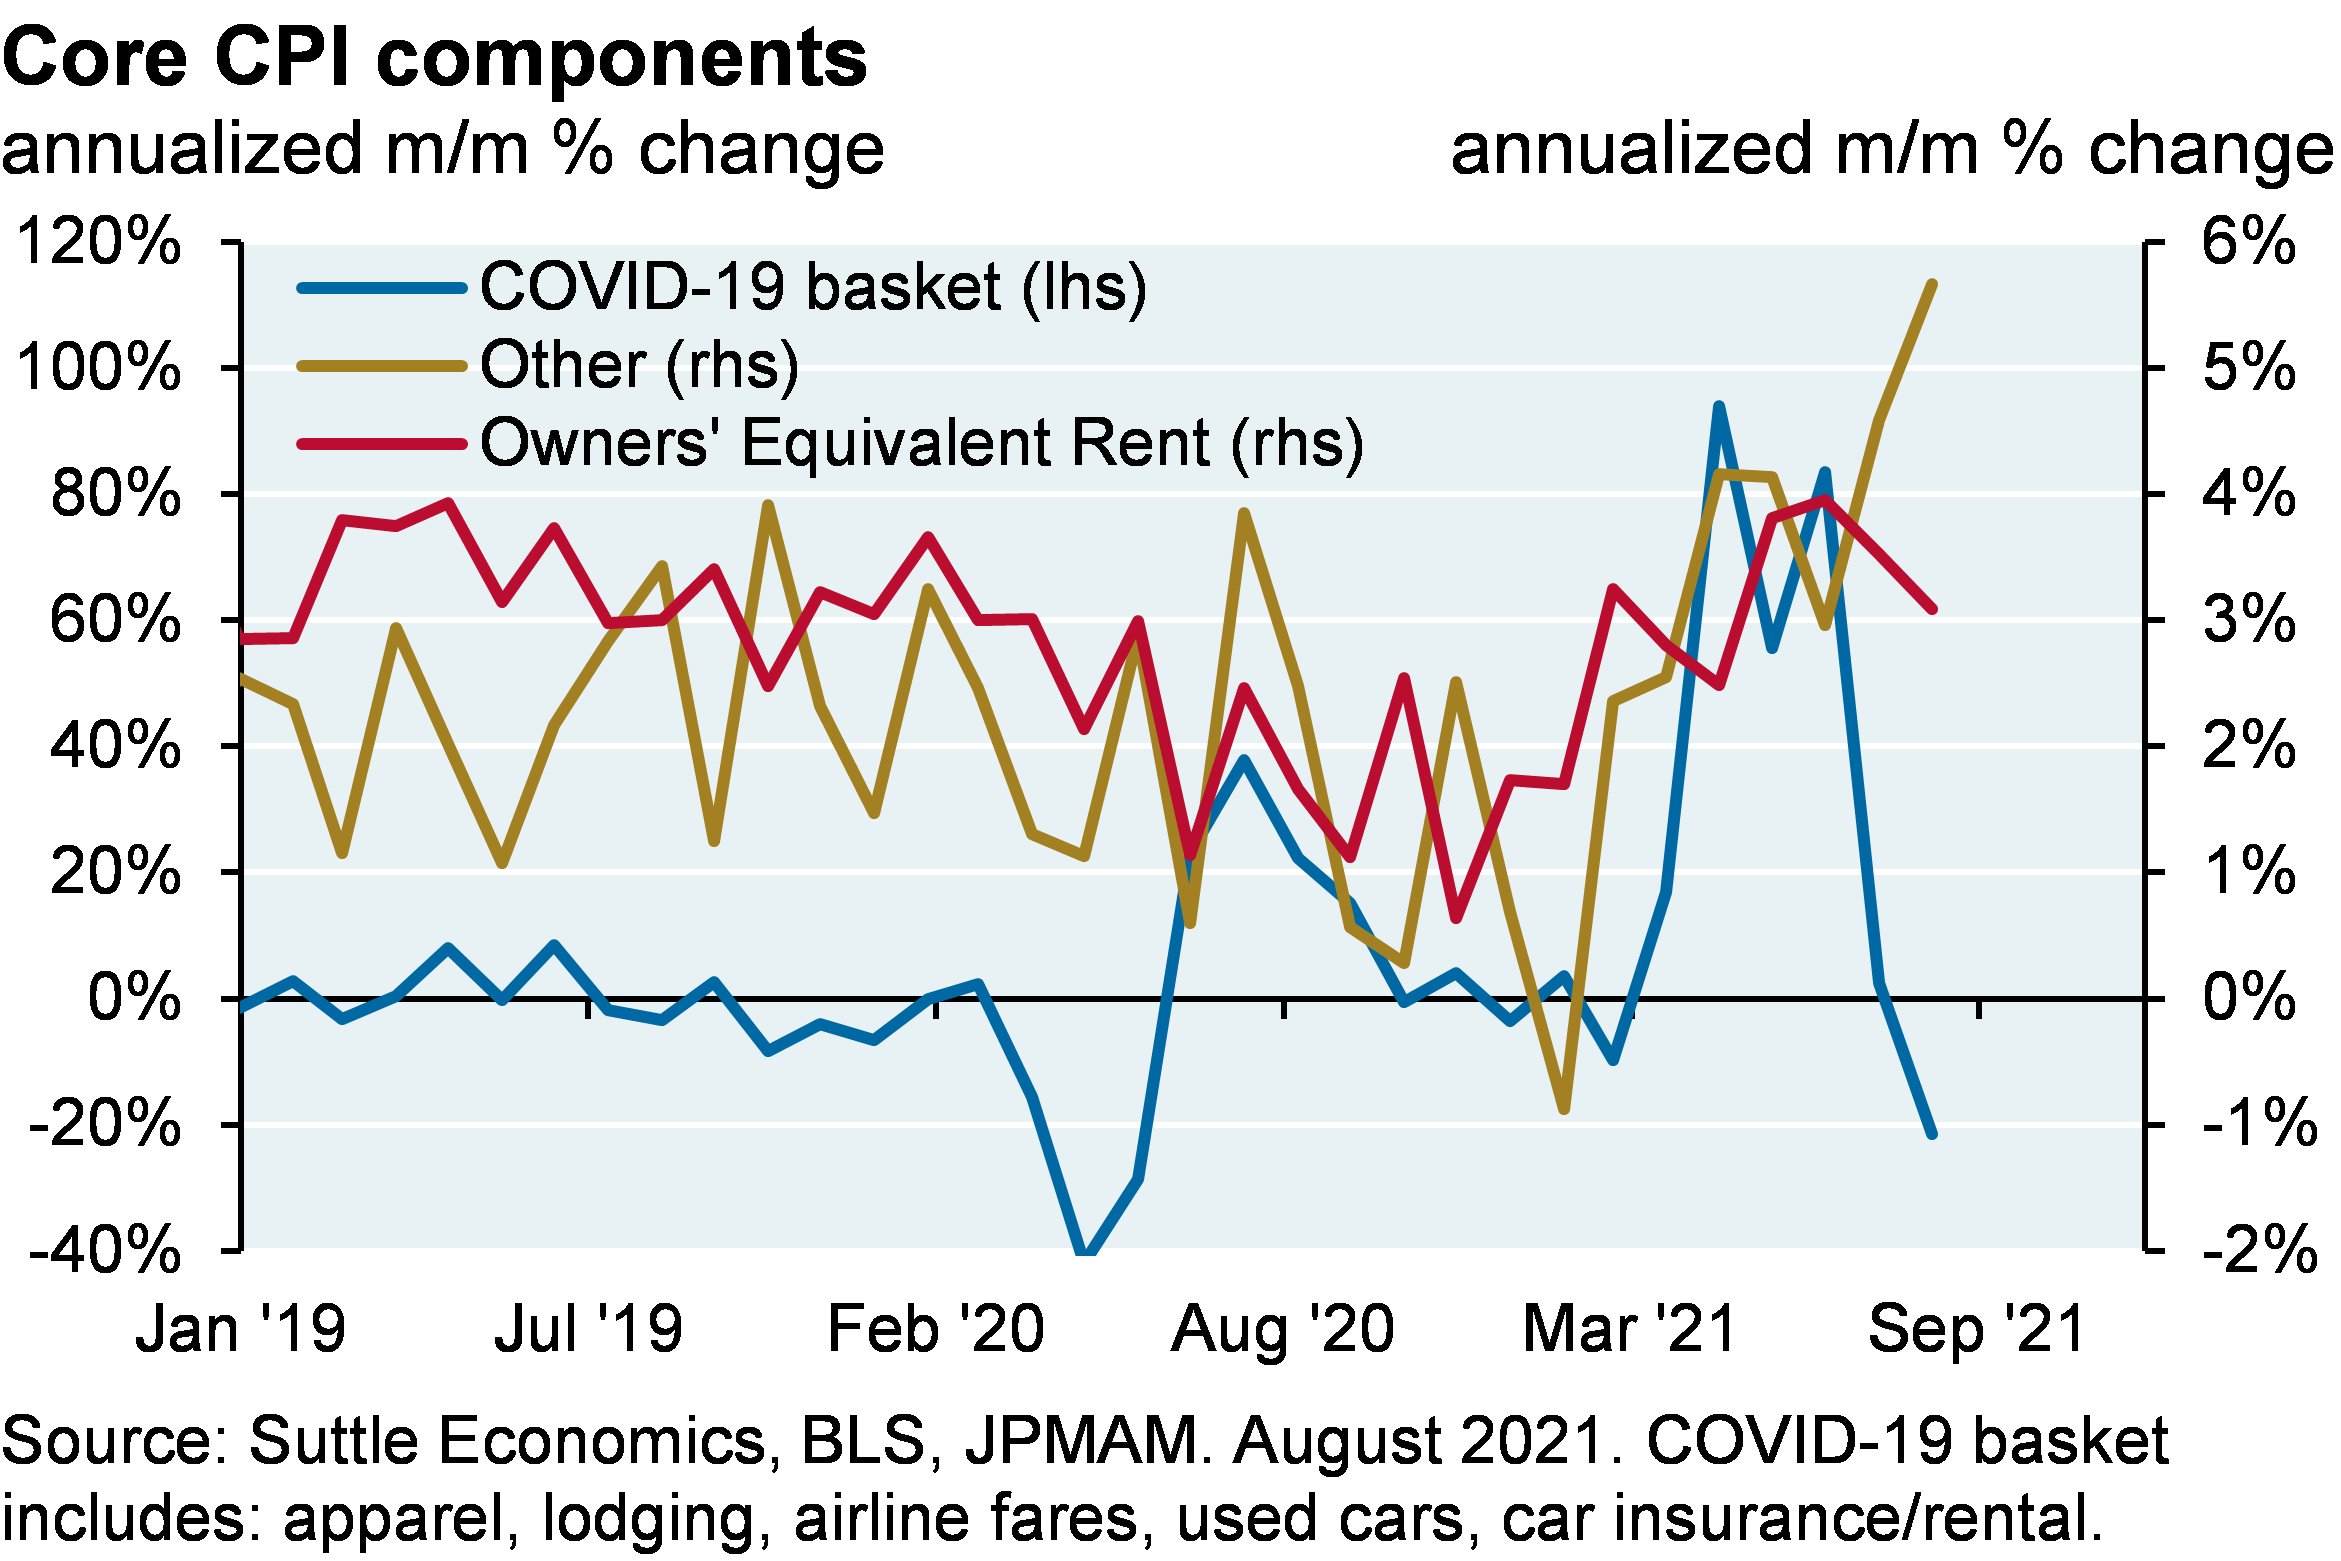
Note that global supply chain problems are not getting better as growth momentum slows, since production growth is declining as fast as new order growth. For all the clients that have asked me about the political and economic problems associated with the rise of autonomous vehicles and more unemployed truckers, I keep telling them they’ve got it backwards: the US has had a trucker shortage for the last few years, and it’s projected to get worse. In other words, COVID has worsened some existing vulnerabilities in the US supply chain, just as global trade is surging. As for the August US inflation report in which CPI came in lower than expectations, that was mostly a function of COVID related declines in airfare, lodging and rental cars. These categories will probably bounce back when the Delta wave fades, and the other categories are still rising sharply.

Line chart shows global manufacturing PMI, where a value of 50+ represents an expansion. Chart shows that manufacturing new orders and manufacturing production dropped to a value of nearly 30, steadily increased to 55, and have recently slightly declined, with new orders slightly below 55 and production at around 53.
Bar chart which shows the truck driver shortage since 2011. The chart illustrates how there is a growing trucker shortage in the US, which is only projected to increase in the next few years. By 2028 the American Trucking Associations project the shortage will grow to 160,000 drivers.
Line chart shows global trade volume since 2007. The global trade index plummeted at the beginning of the pandemic, falling from ~110 to 90. Global trade has fully recovered and is now surging to the highest level since 2007.
Line chart showing the components of CPI grouped by COVID-19 impacted consumer goods and services, owners’ equivalent rent and all other goods and services in the Core Consumer Price Index. The COVID-19 basket includes apparel, lodging, airline fares, used cars, car insurance and car rentals. The August CPI report came in lower than expectations, which was mostly a function of COVID related declines in airfare, lodging and rental cars. These categories will probably bounce back when the Delta wave fades, and the other categories are still rising sharply.


Bottleneck resolution

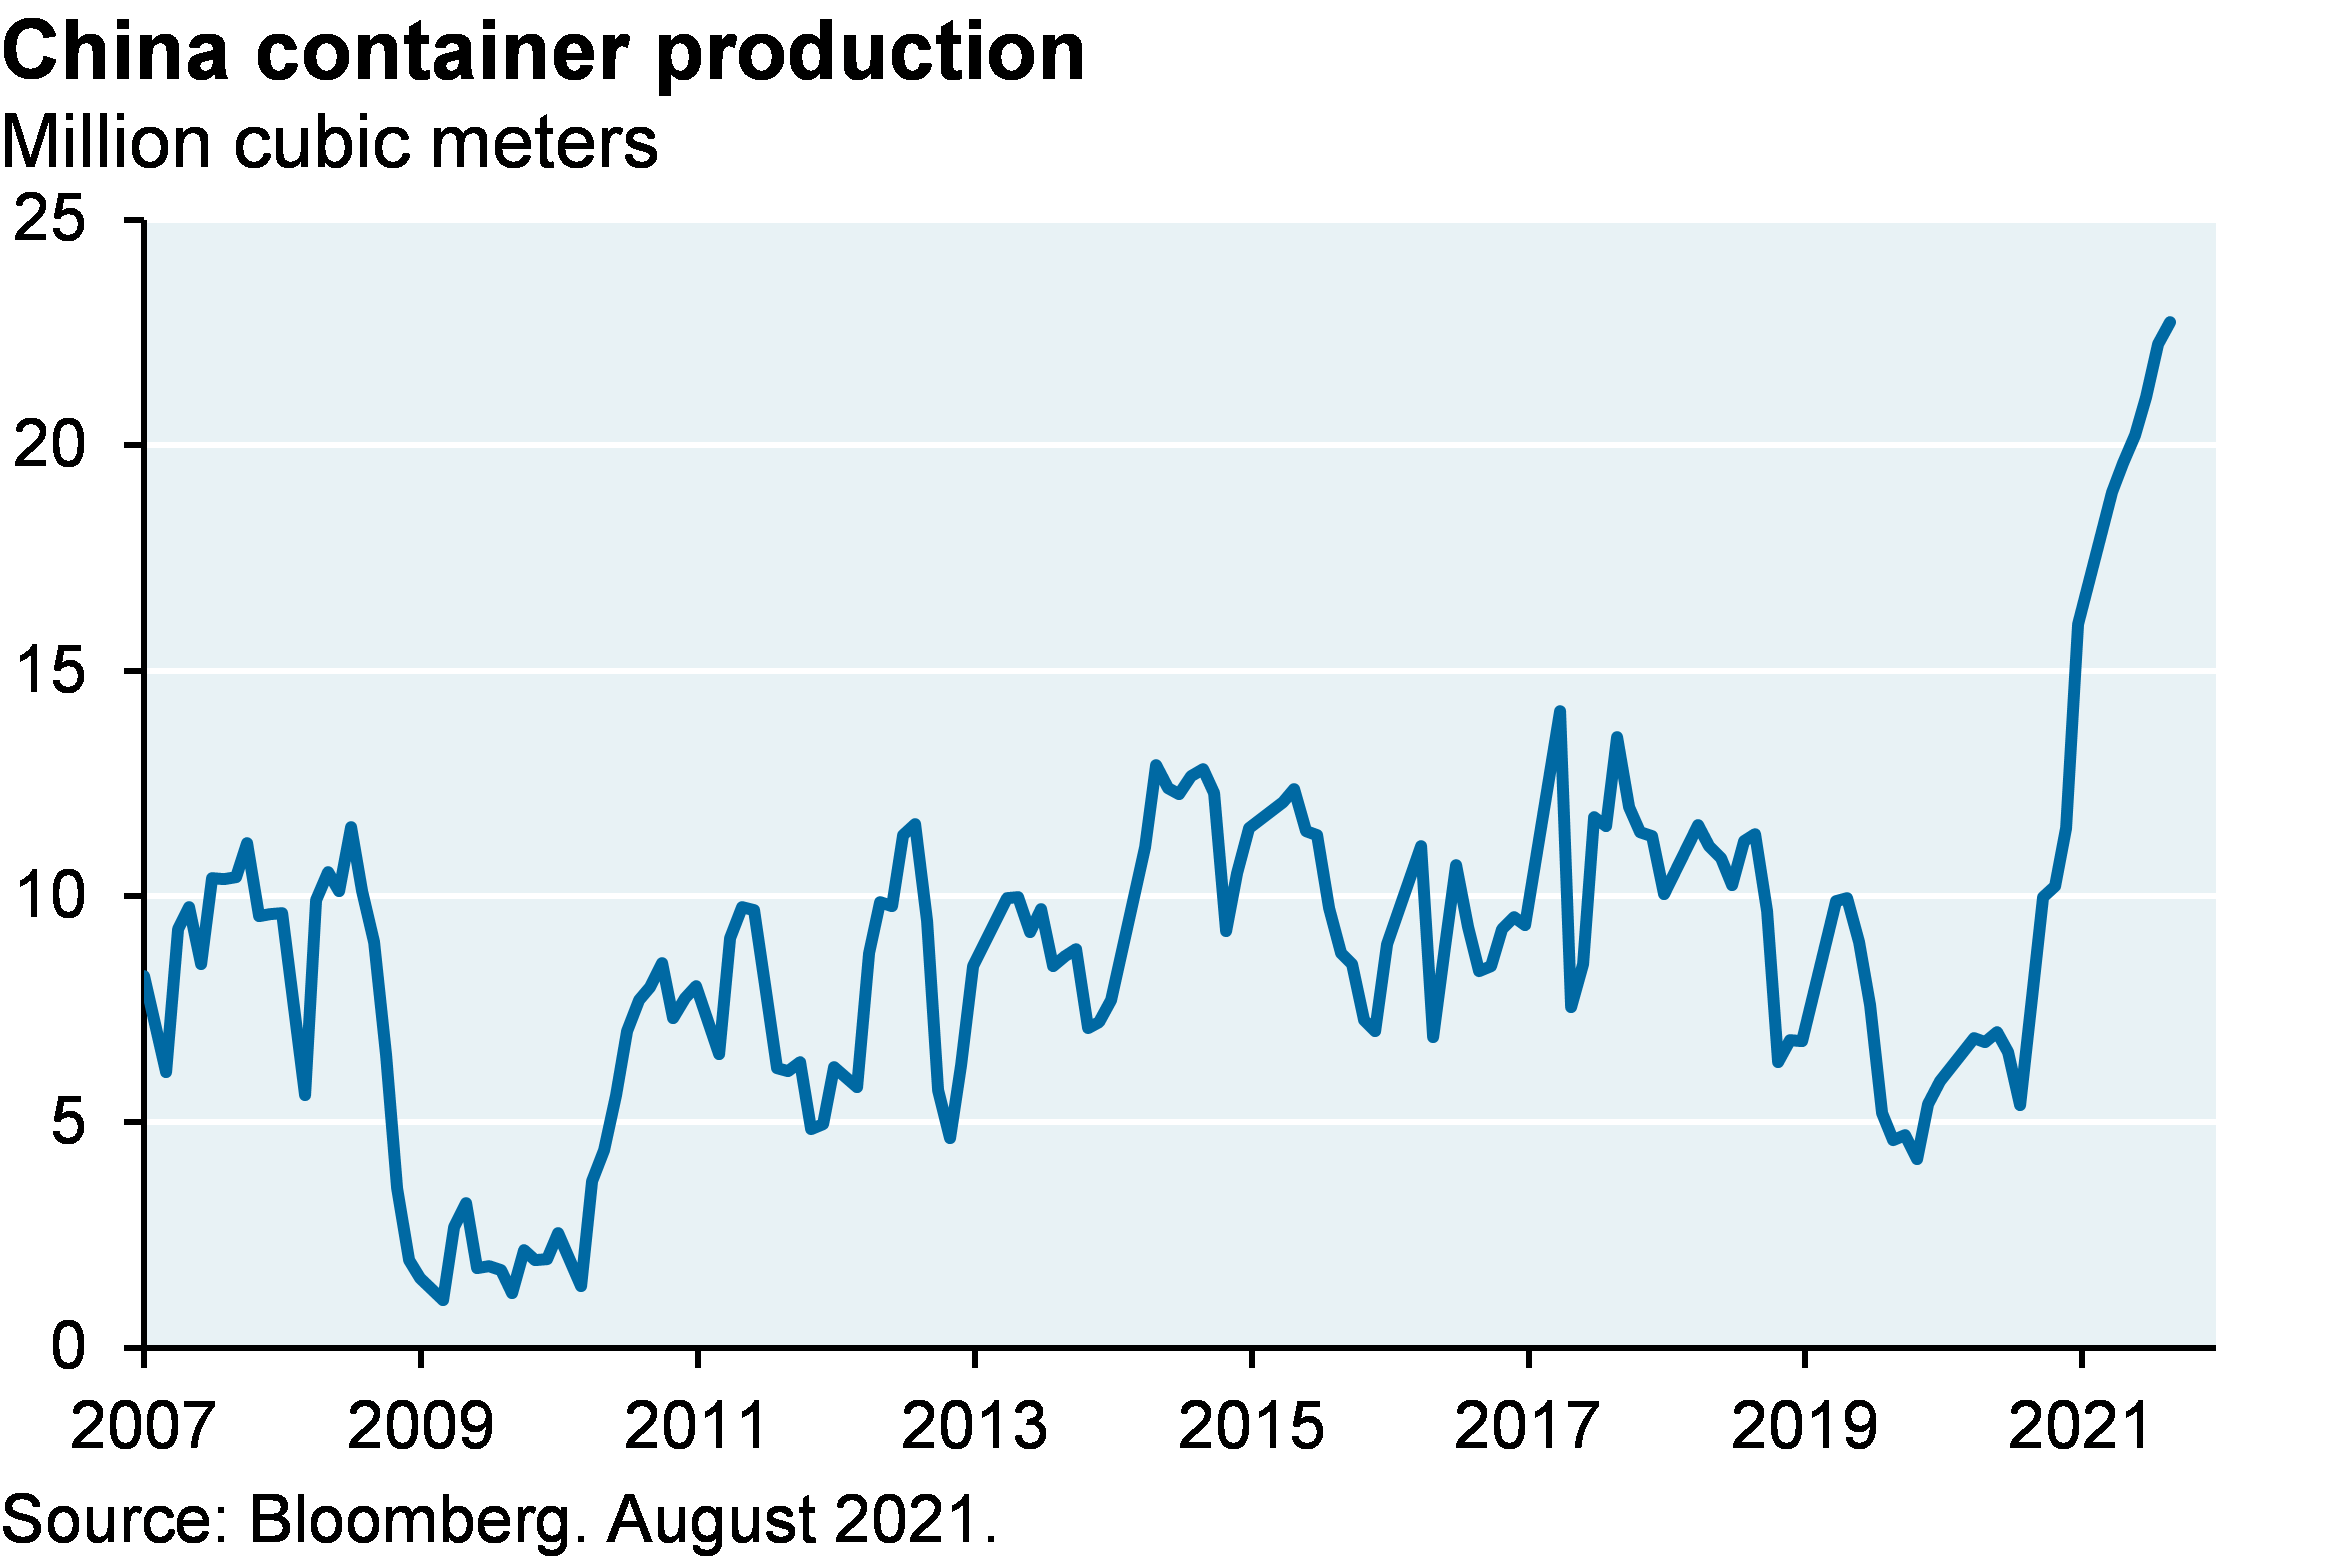
First, the world is going to need more containers, which carry more than 90% of the world’s traded goods. Chinese companies affiliated with its government make 95% of the world’s containers and have ramped up production. The number of containerships in service is rising as well, albeit more slowly; again, China stands to benefit as the world’s largest shipbuilder (37% of the shipbuilding market in 2019 by deadweight, and 45% of all new shipbuilding orders). Another example of how China continues to reap unforeseen economic gains from COVID; another is the rise in global export market share that China has gained vs its Asian export competitors.

Line chart shows China container production in million cubic meters. The chart illustrates that China has already ramped up container production substantially to around ~22mm cubic meters.
Line chart shows an index of containerships in service globally. The number of containerships in service has been gradually rising since the beginning of the pandemic and is currently 7% above 2015 levels.


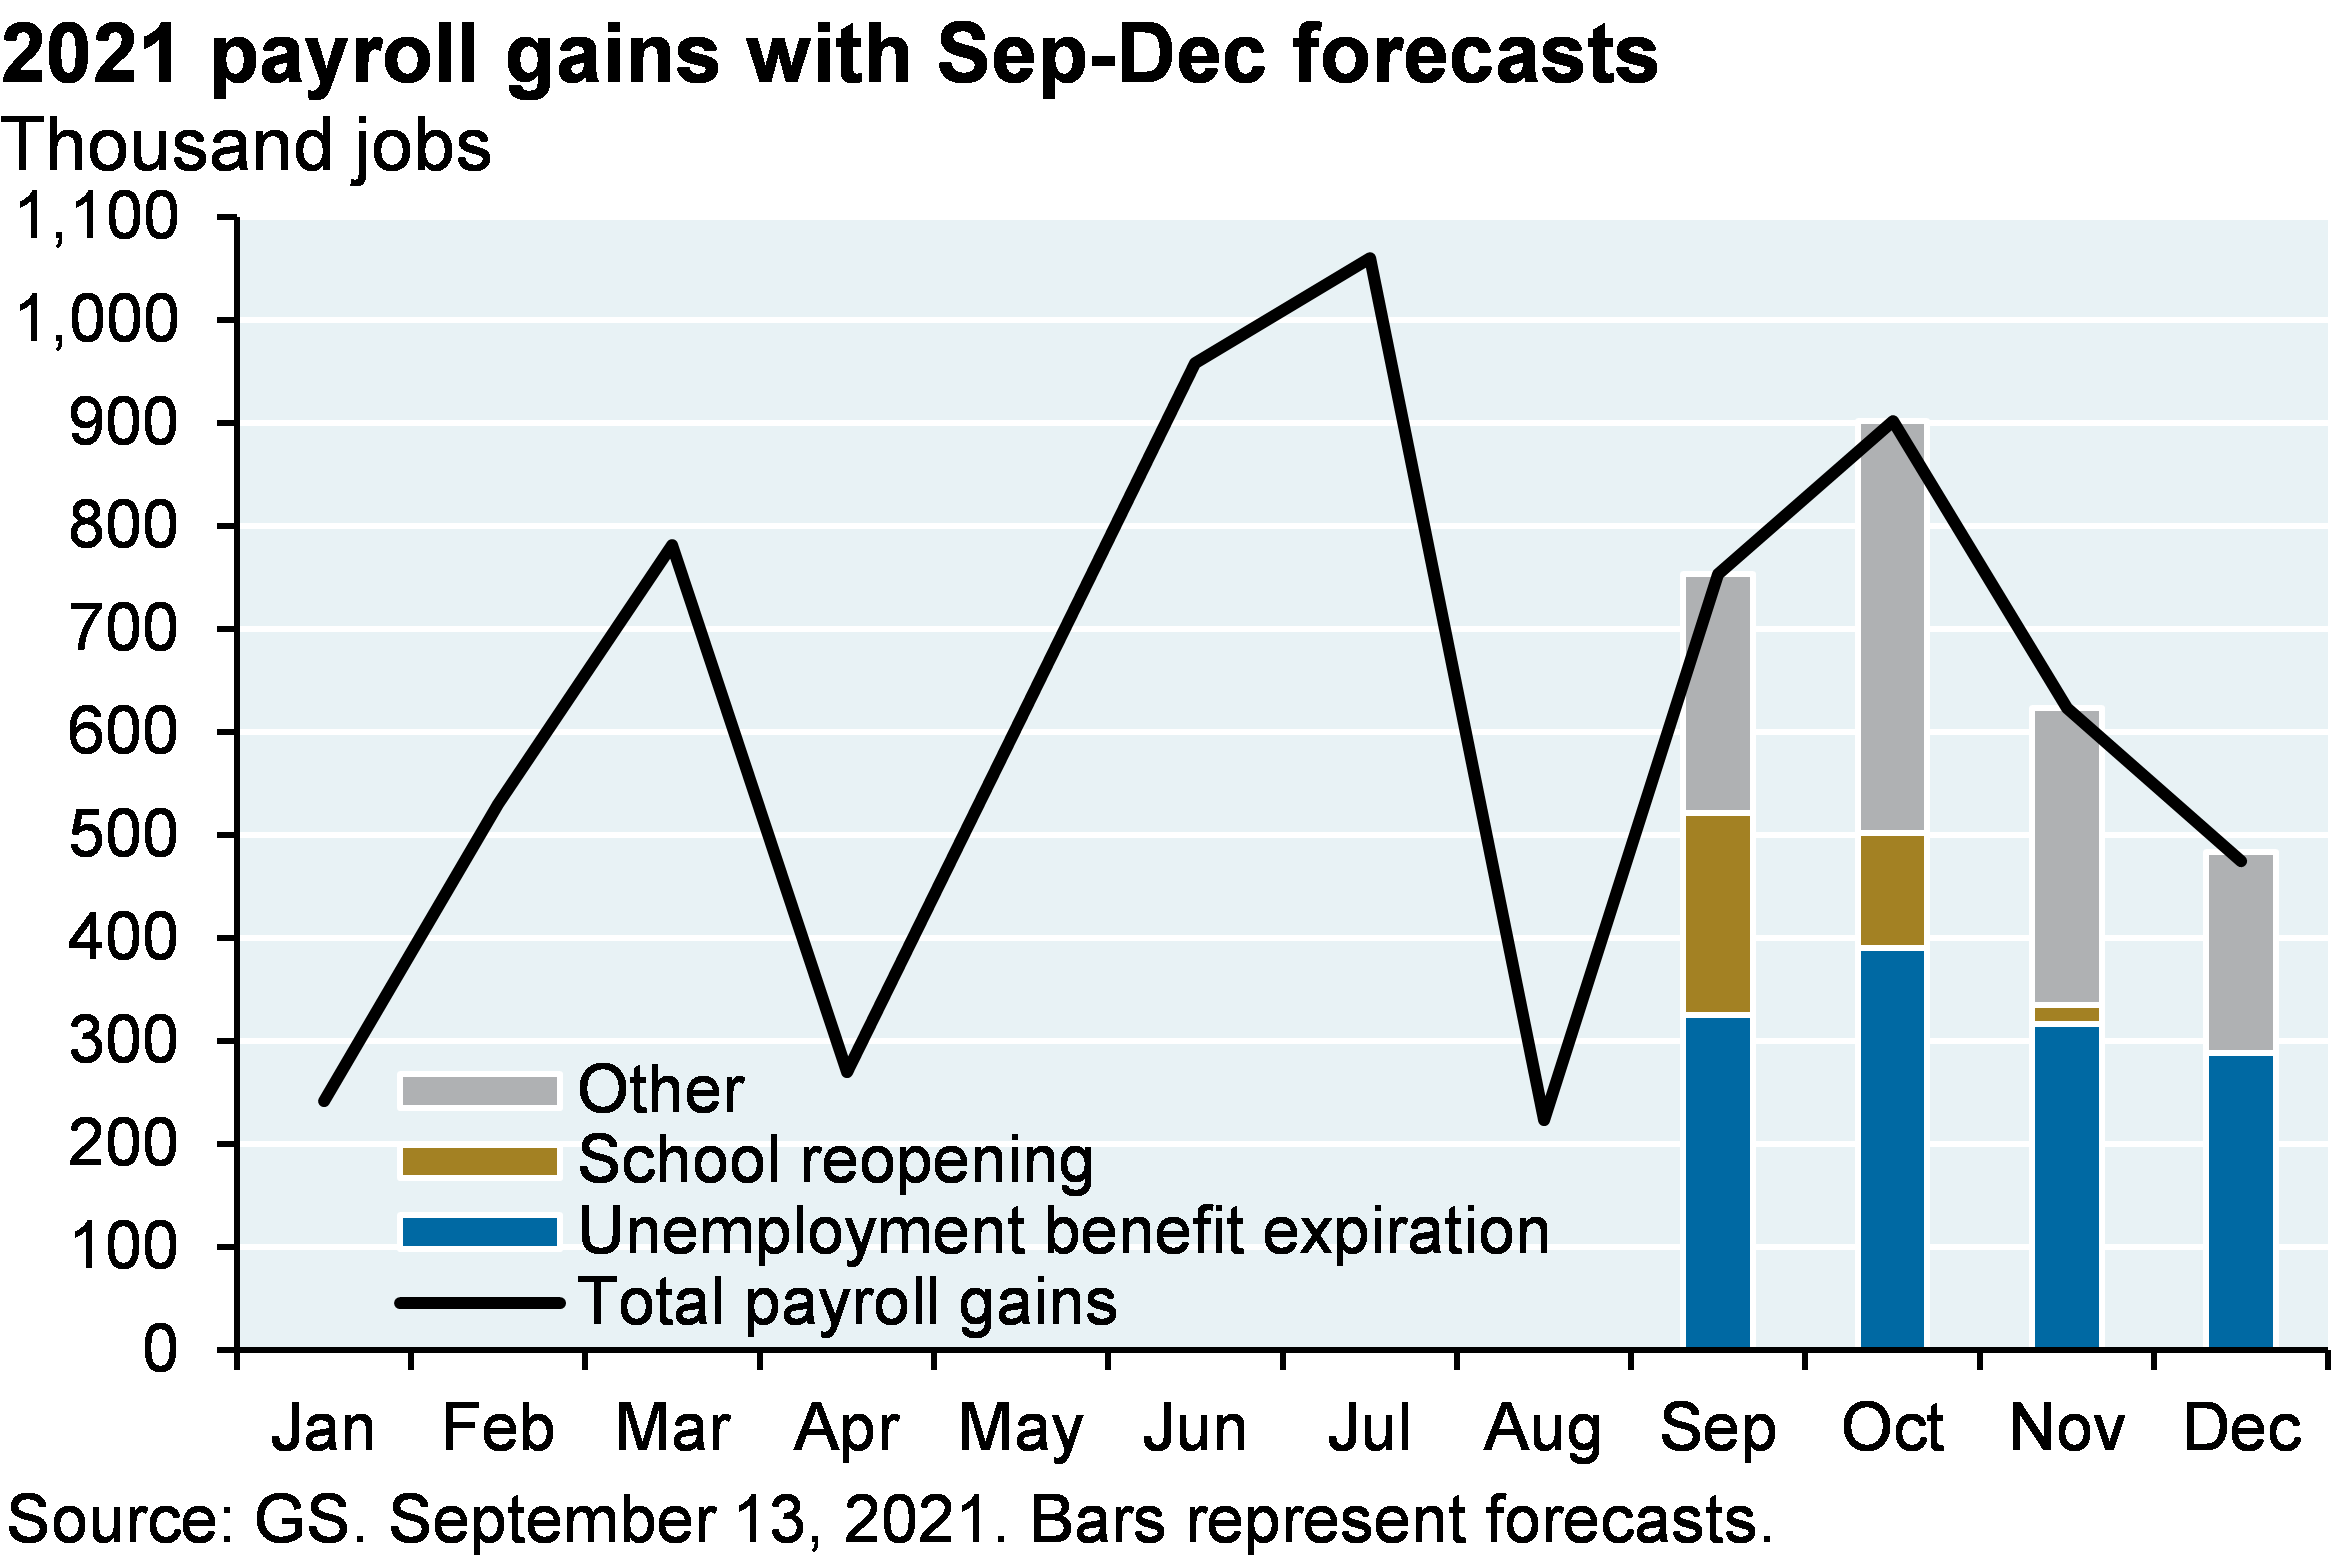
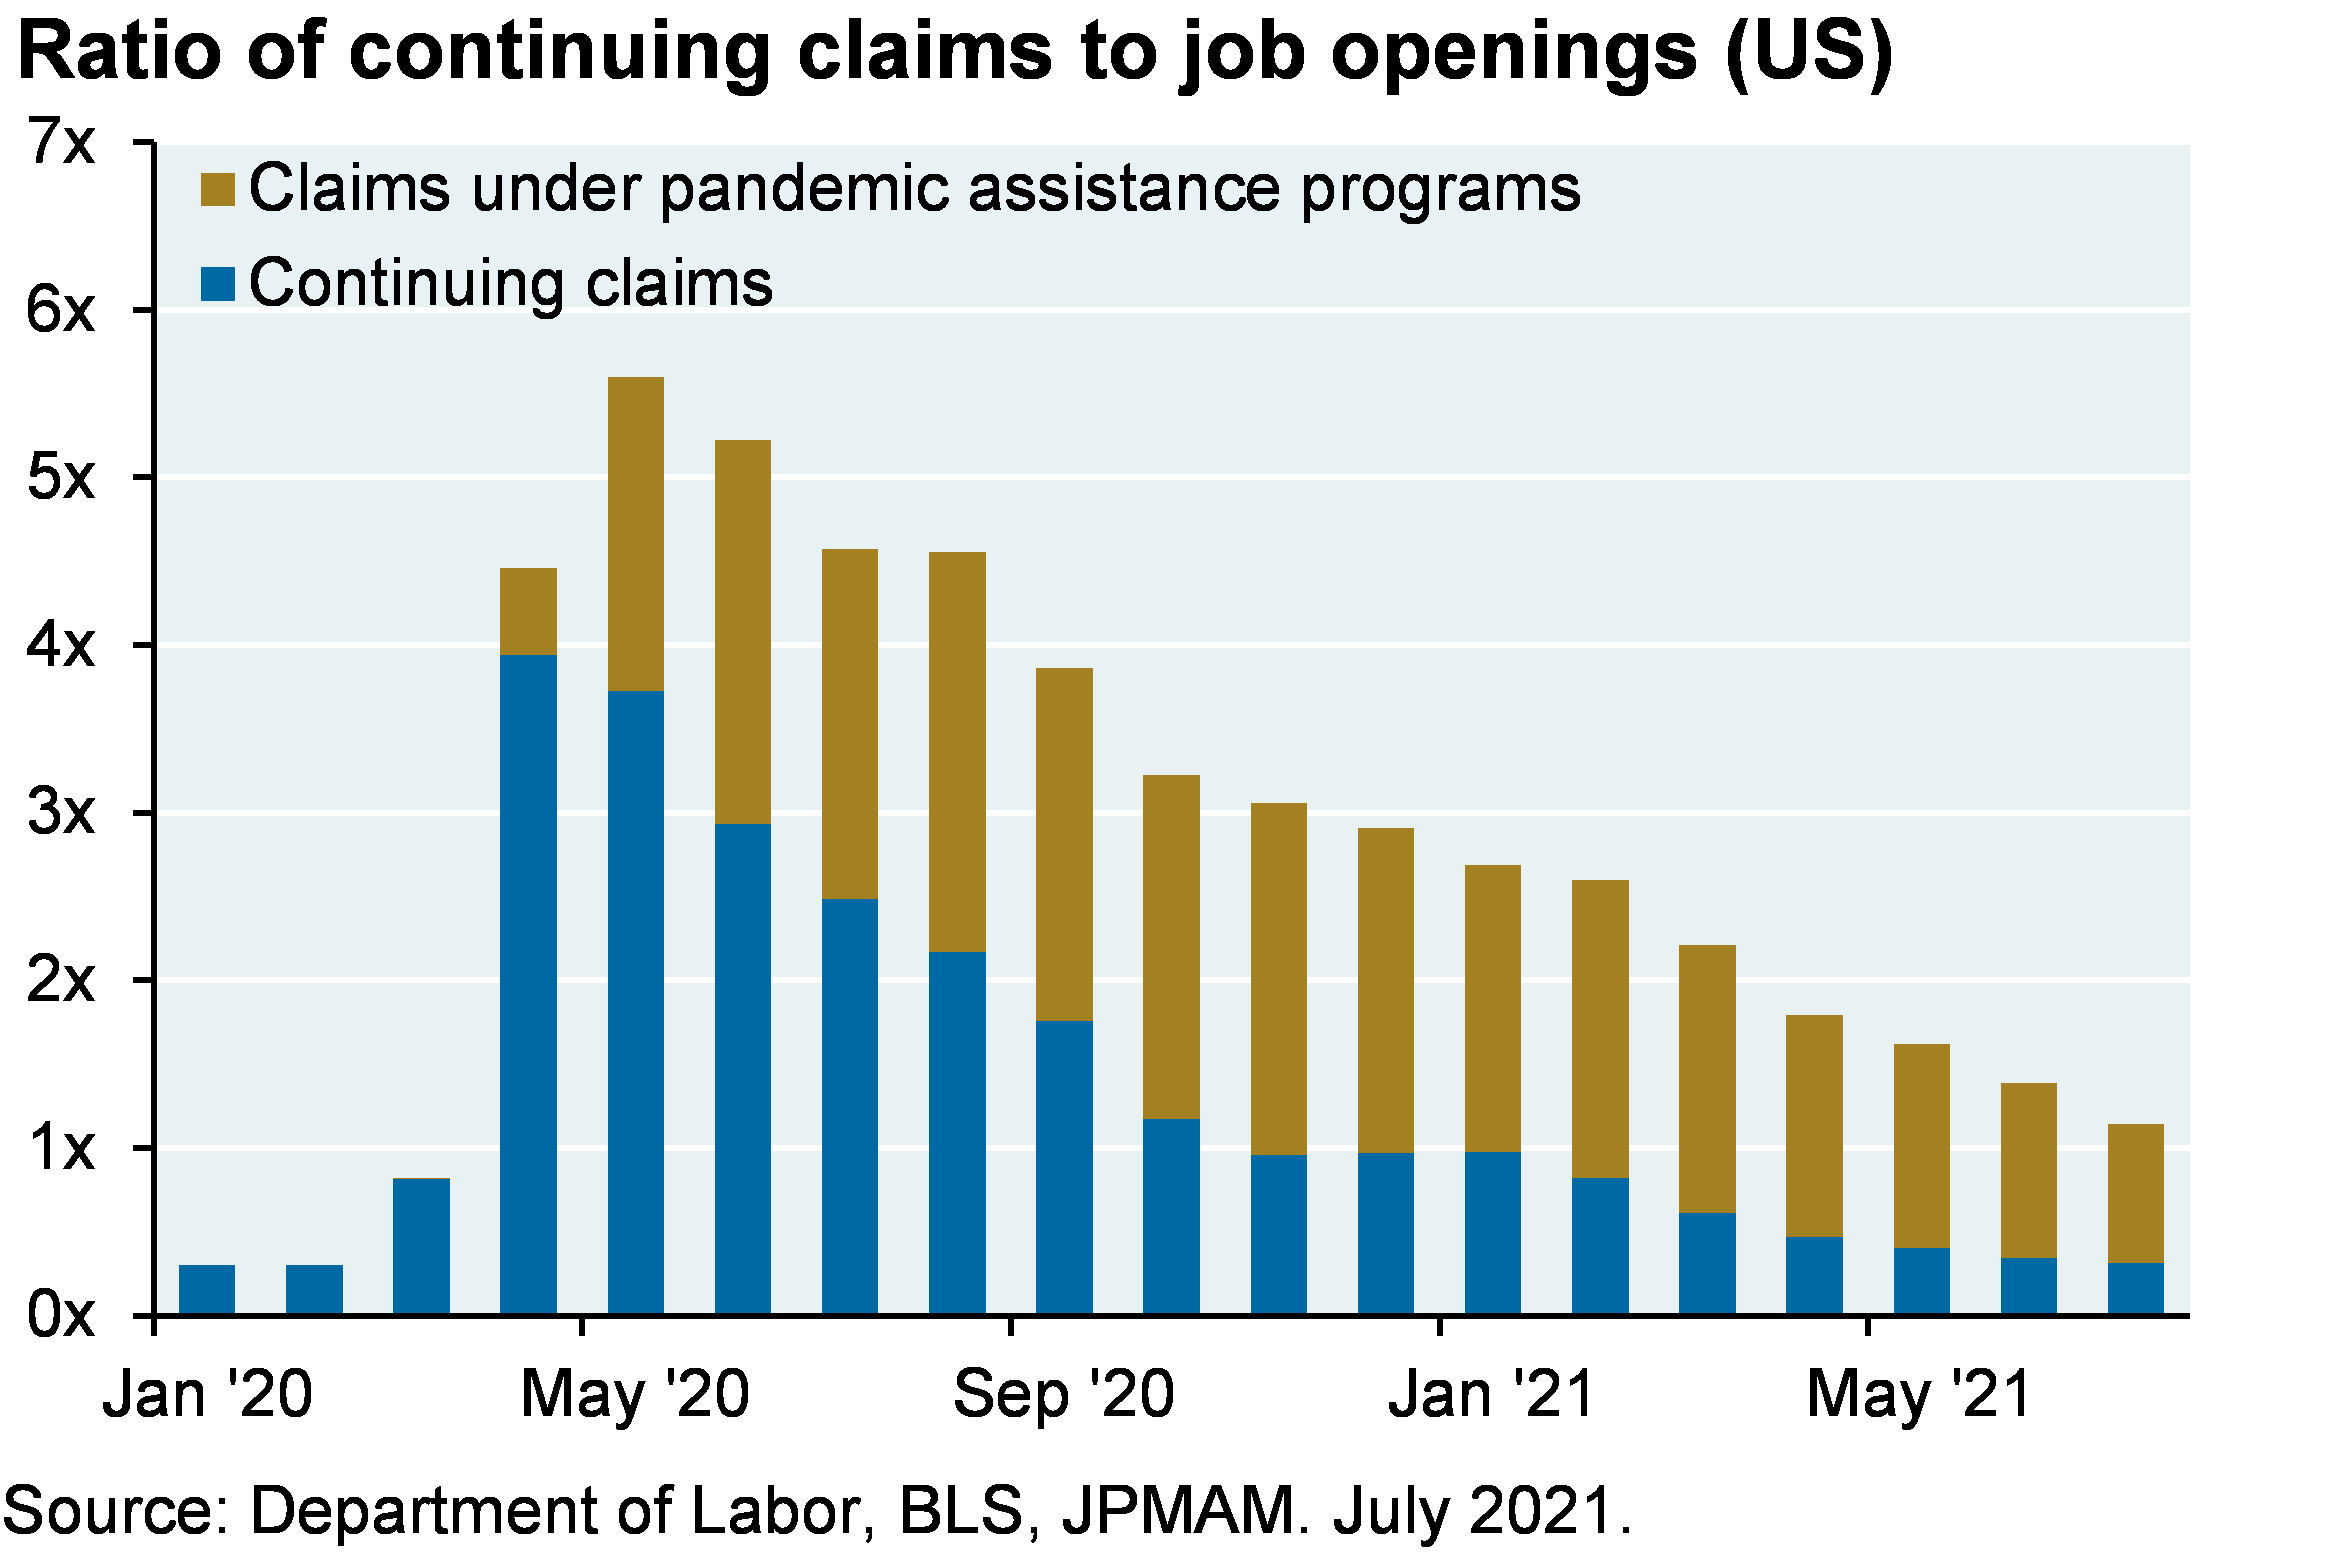
But more containers and containerships won’t solve problems in the West unless other supply chain issues are resolved as well. That will probably require (a) an end to extraordinary housing and income support measures, and (b) less community spread and concern about COVID. So far, most analyses show very little job growth differentials between US states that terminated subsidies vs those that didn’t1. That said, some forecasts call for 1.3 million new jobs by year-end due to expiring unemployment benefits and another 300,000 new jobs due to school reopening. Around 2/3 of continuing claimants receive some pandemic unemployment assistance, which is another sign that such benefits are impacting the labor force participation rate.

Line chart shows 2021 payroll gains with bars illustrating estimates of the payroll gains due to unemployment benefits expiring, schools reopening and all other causes. Forecasts call for 1.3 million new jobs by year end due to expiring unemployment benefits and another 300k due to school reopening.
 Stacked bar chart shows the ratio of continuing claims to job openings since the beginning of 2021. The chart breaks down all claims into two categories: claims under pandemic assistance programs and all other. The chart shows that 2/3 of those showing up in continuing claims are receiving some form of pandemic unemployment assistance.


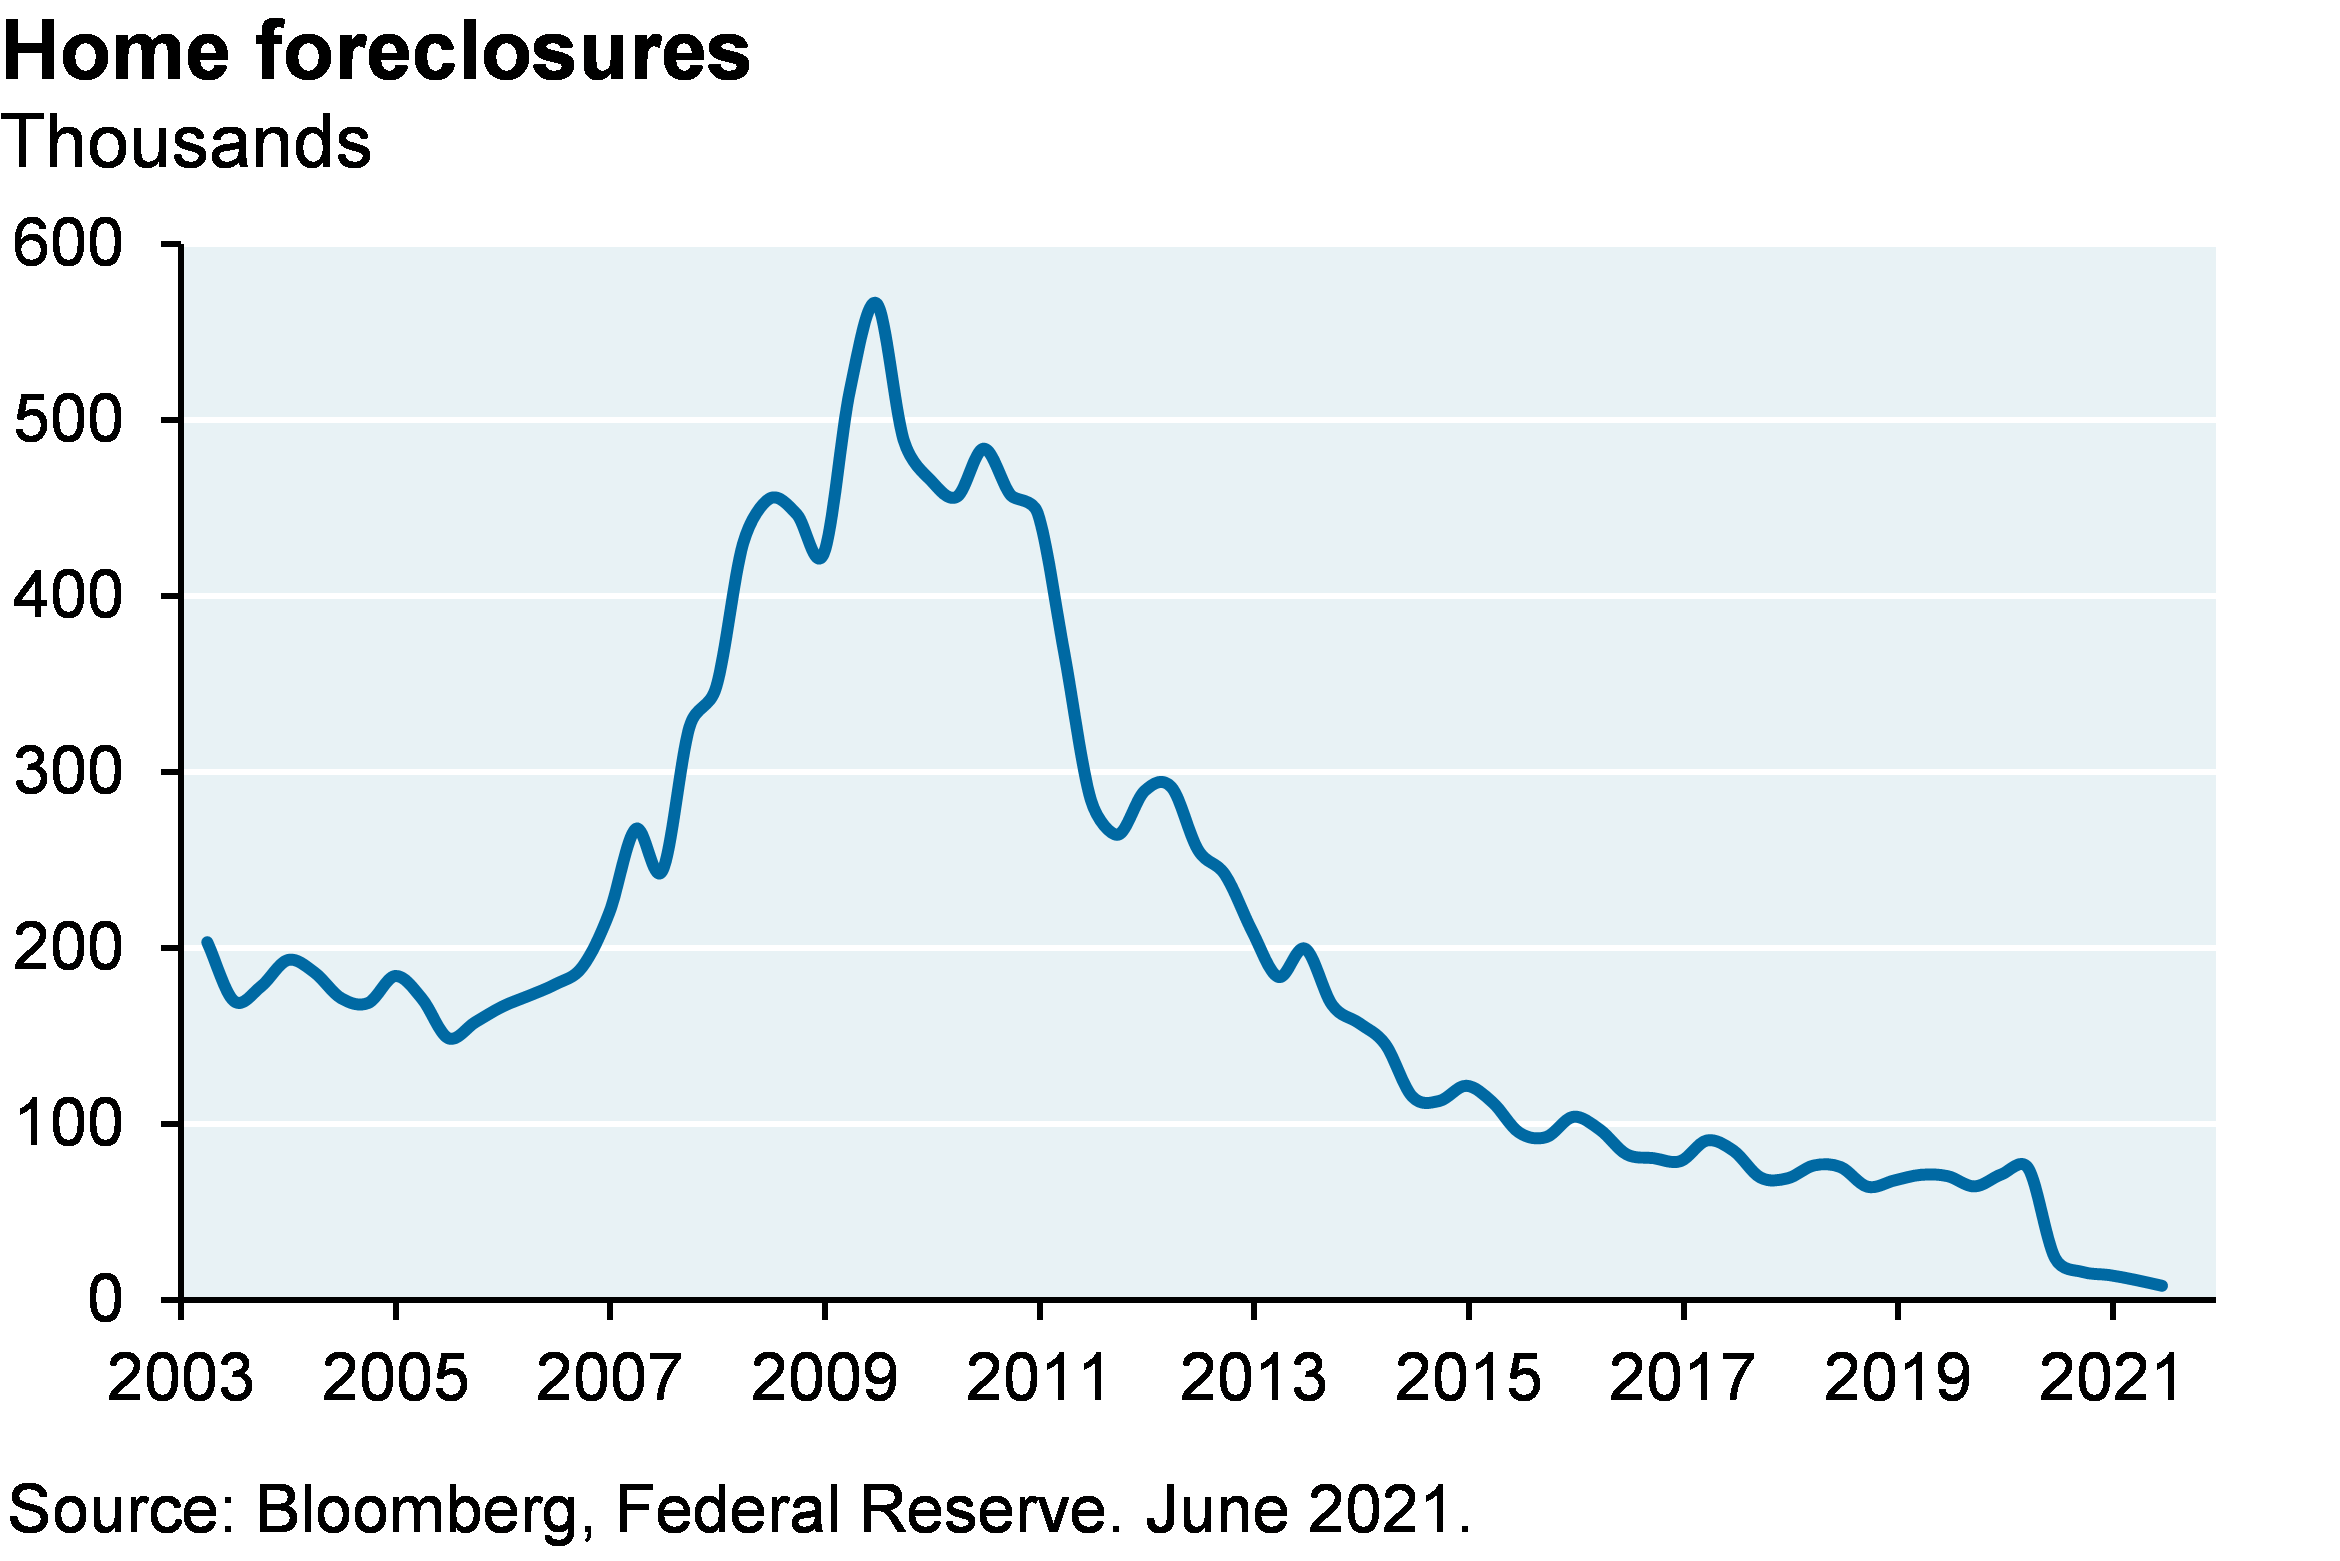
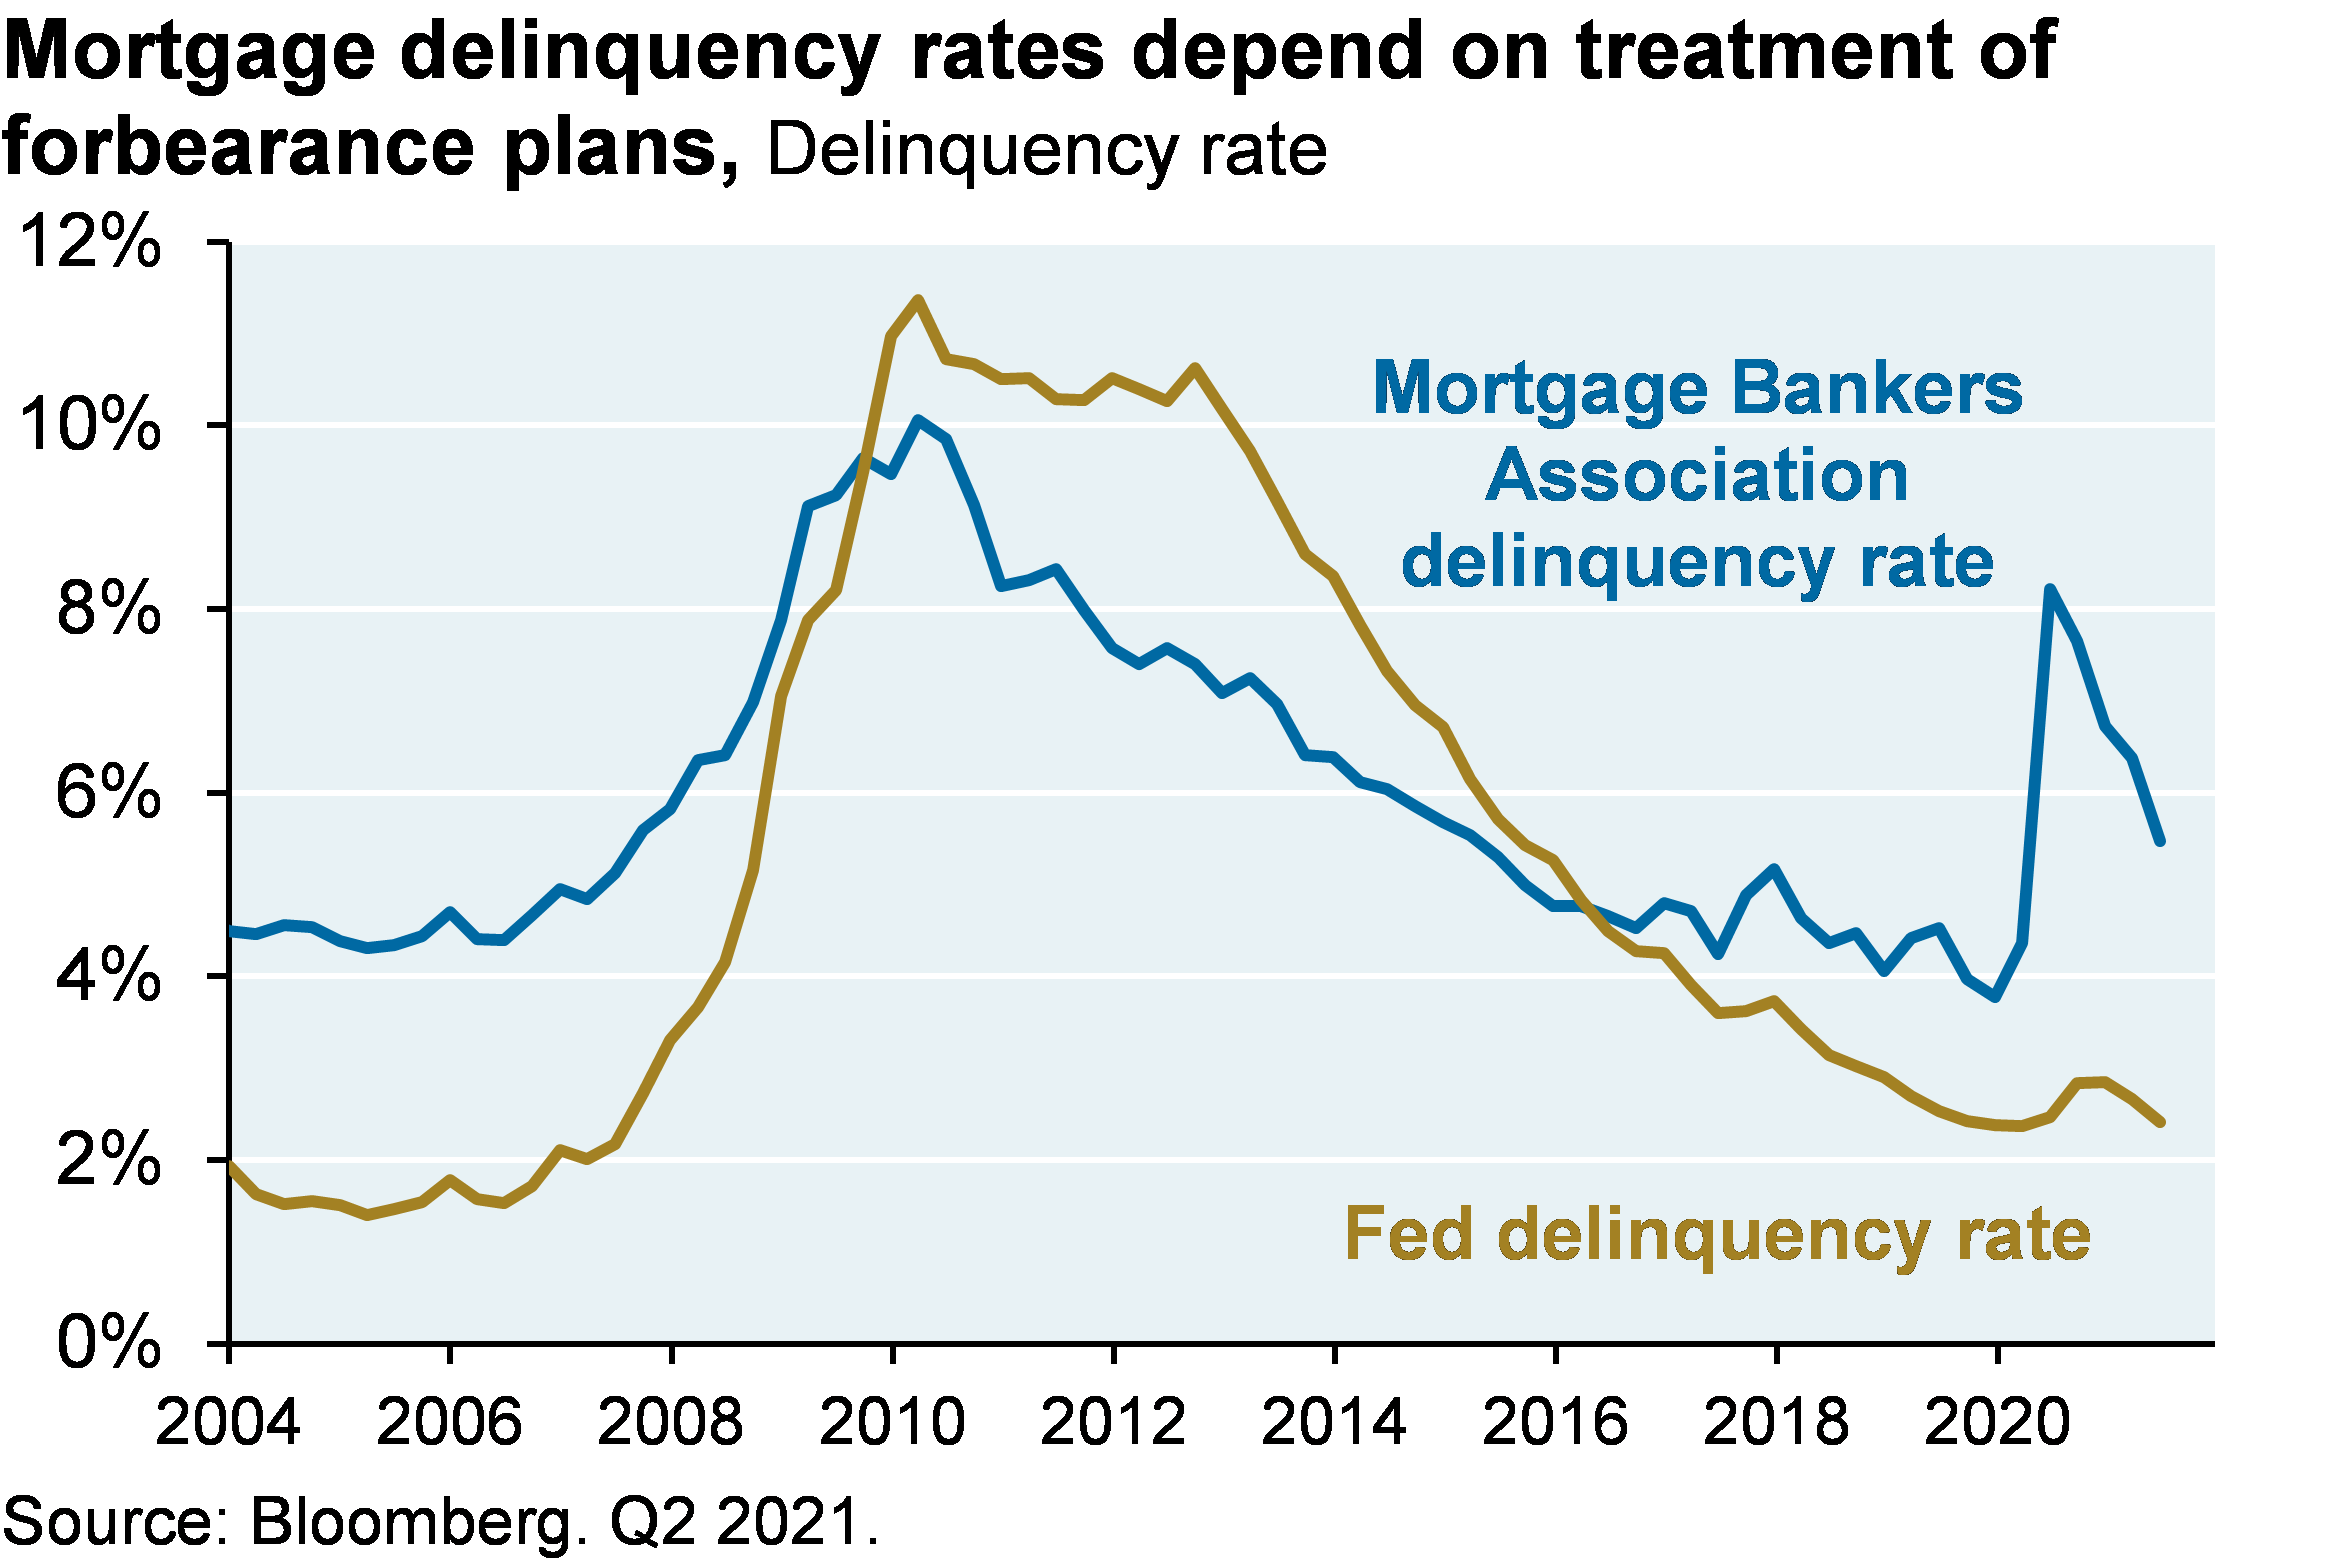
The federal foreclosure moratorium officially ended on July 31. However, we don’t anticipate a sharp rise in new foreclosure filings due to a CFPB rule issued in June that established procedural safeguards that have to be met before foreclosures can begin (hurdles are hard to meet and include provisions that a property has to be abandoned, or that the servicer hasn’t heard from the borrower for an extended period). The new rule expires in December 2021, after which normal foreclosure patterns might resume. Foreclosures fell close to zero in the US once the moratorium was put in place. The second chart shows the gap between the MBA definition of delinquency which defines deferred payments as delinquent, and the Fed definition which does not. See appendix for a discussion of homeowner vs renter treatment.  

One more thing on housing: read about the issues with LoanDepot. So, one of many undercapitalized fintech lenders (most of whom have limited special servicing capabilities) allegedly processed thousands of loans without required documents such as employment and income verifications? Color me unsurprised2


 Line chart shows home foreclosures since 2003. The chart illustrates the impact of the foreclosure moratorium; once the moratorium was put in place foreclosures essentially fell to zero.
Line chart shows the gap between the Mortgage Bankers Association delinquency rate and the Fed delinquency rate. The MBA defines people deferring payments as delinquent whereas the Fed definition does not.


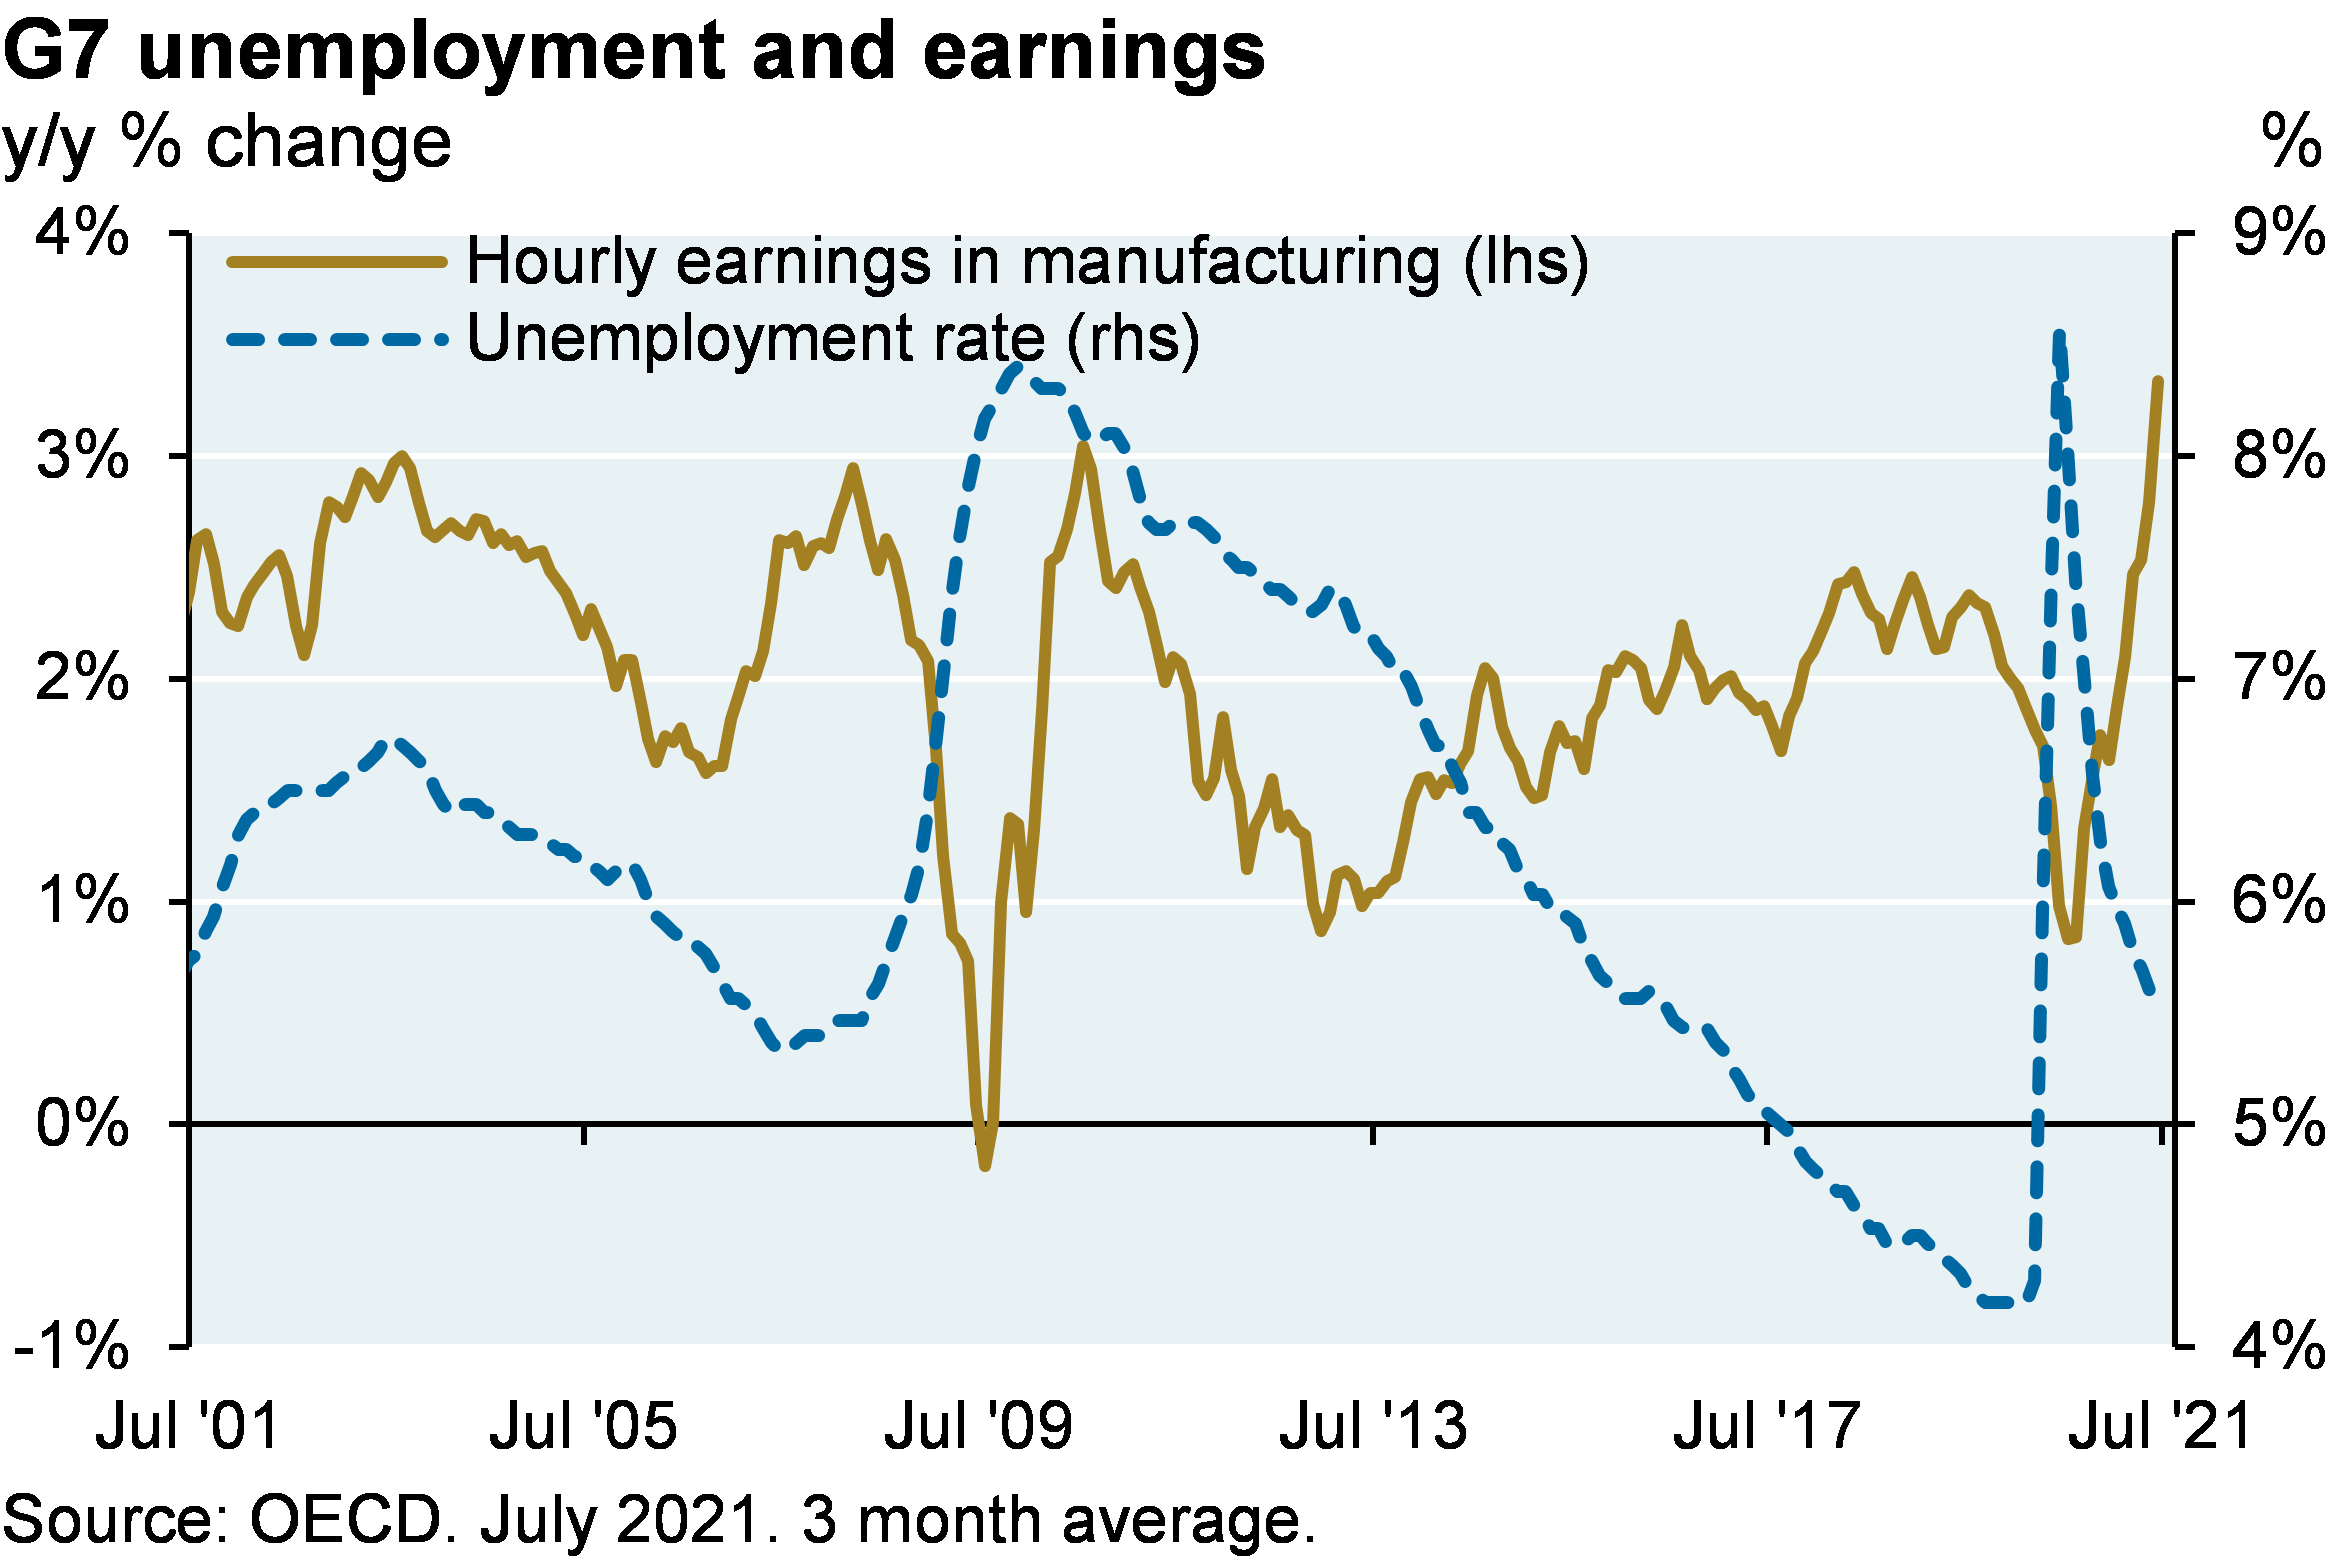
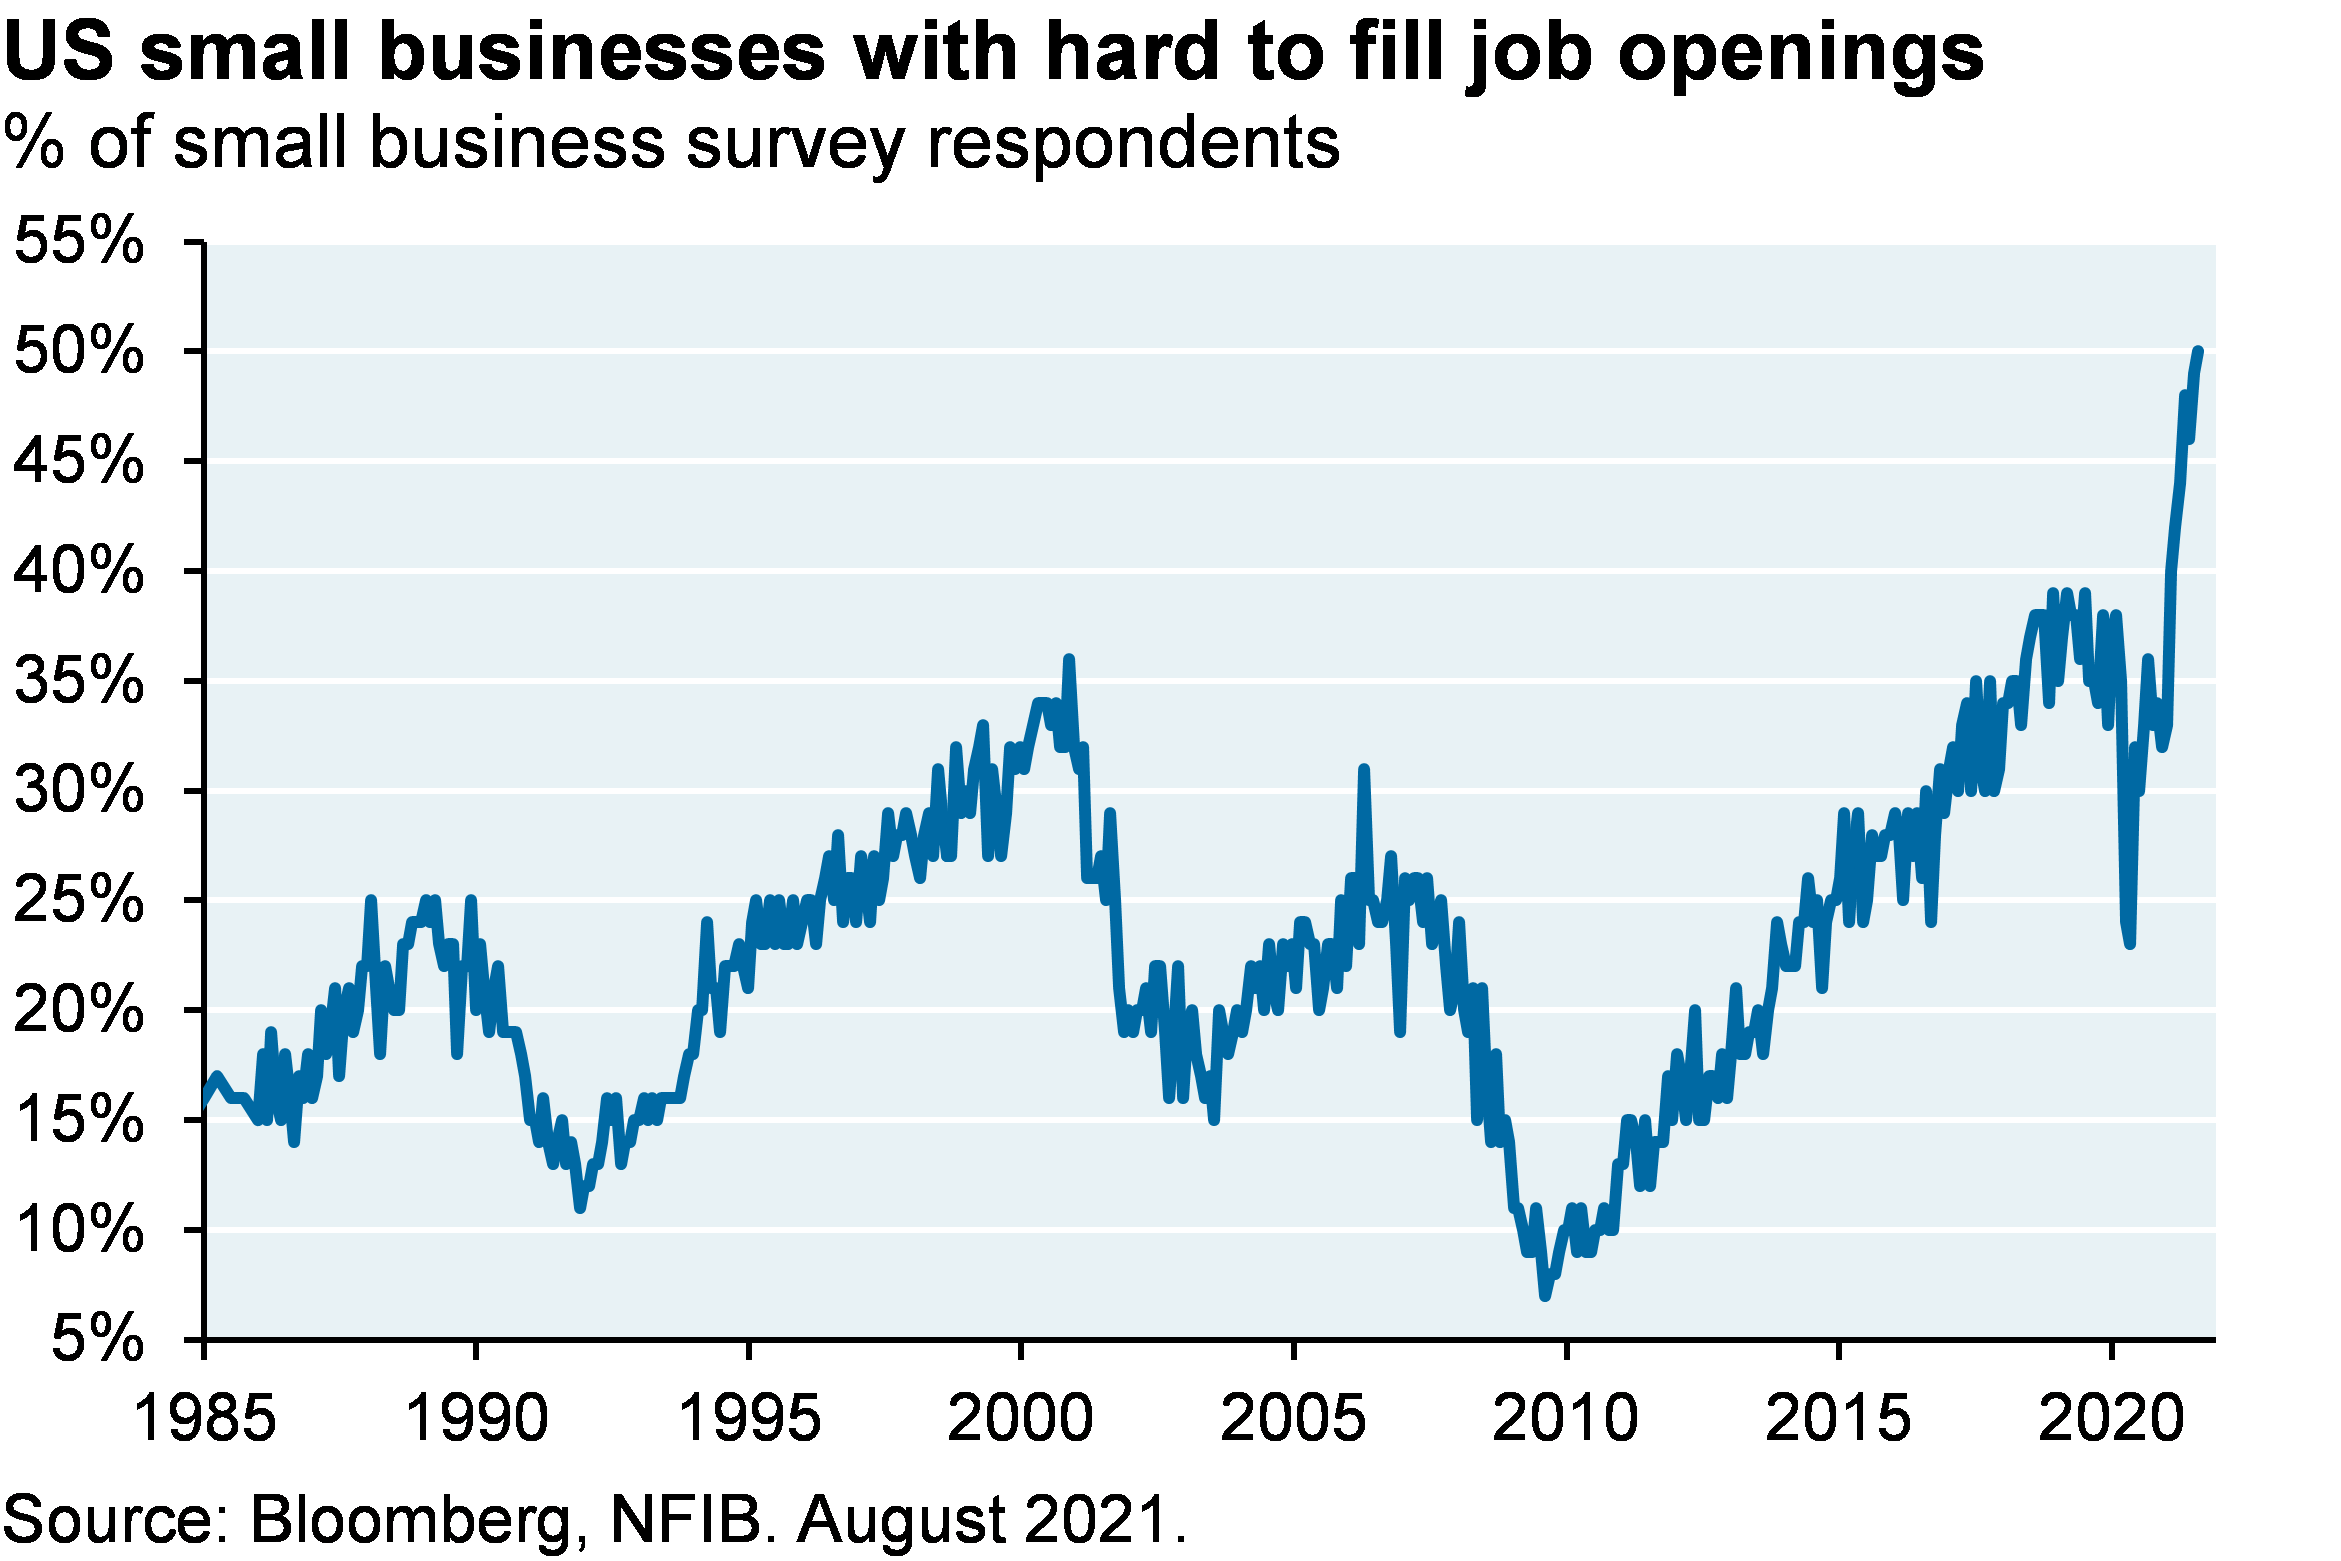
Housing and income policy may have to normalize before labor supplies do. As shown below, G7 manufacturing wages are rising at a very high rate given the prevailing level of unemployment, another sign of labor markets whose supply-demand equilibrium has shifted. By the way, I find it interesting that some people arguing for continued extension of COVID benefits also argue for the largest amount of new Congressional spending ($3.5 trillion), without explaining what that might do to current labor shortages, where all these new workers are supposed to come from and how all that spending might impact inflation and Fed policy. In August, 50% of small business owners said they had job openings they already couldn’t fill, the highest level on record.

 Line chart which plots manufacturing wages versus the unemployment rate in the G7. The chart shows that manufacturing wages are rising at a very high level (~3% since last year) given the prevailing level of unemployment.
 Line chart which should the percent of small businesses with hard to fill job openings. In August, 50% of small business owners said they had job openings they already couldn’t fill, the highest level on record


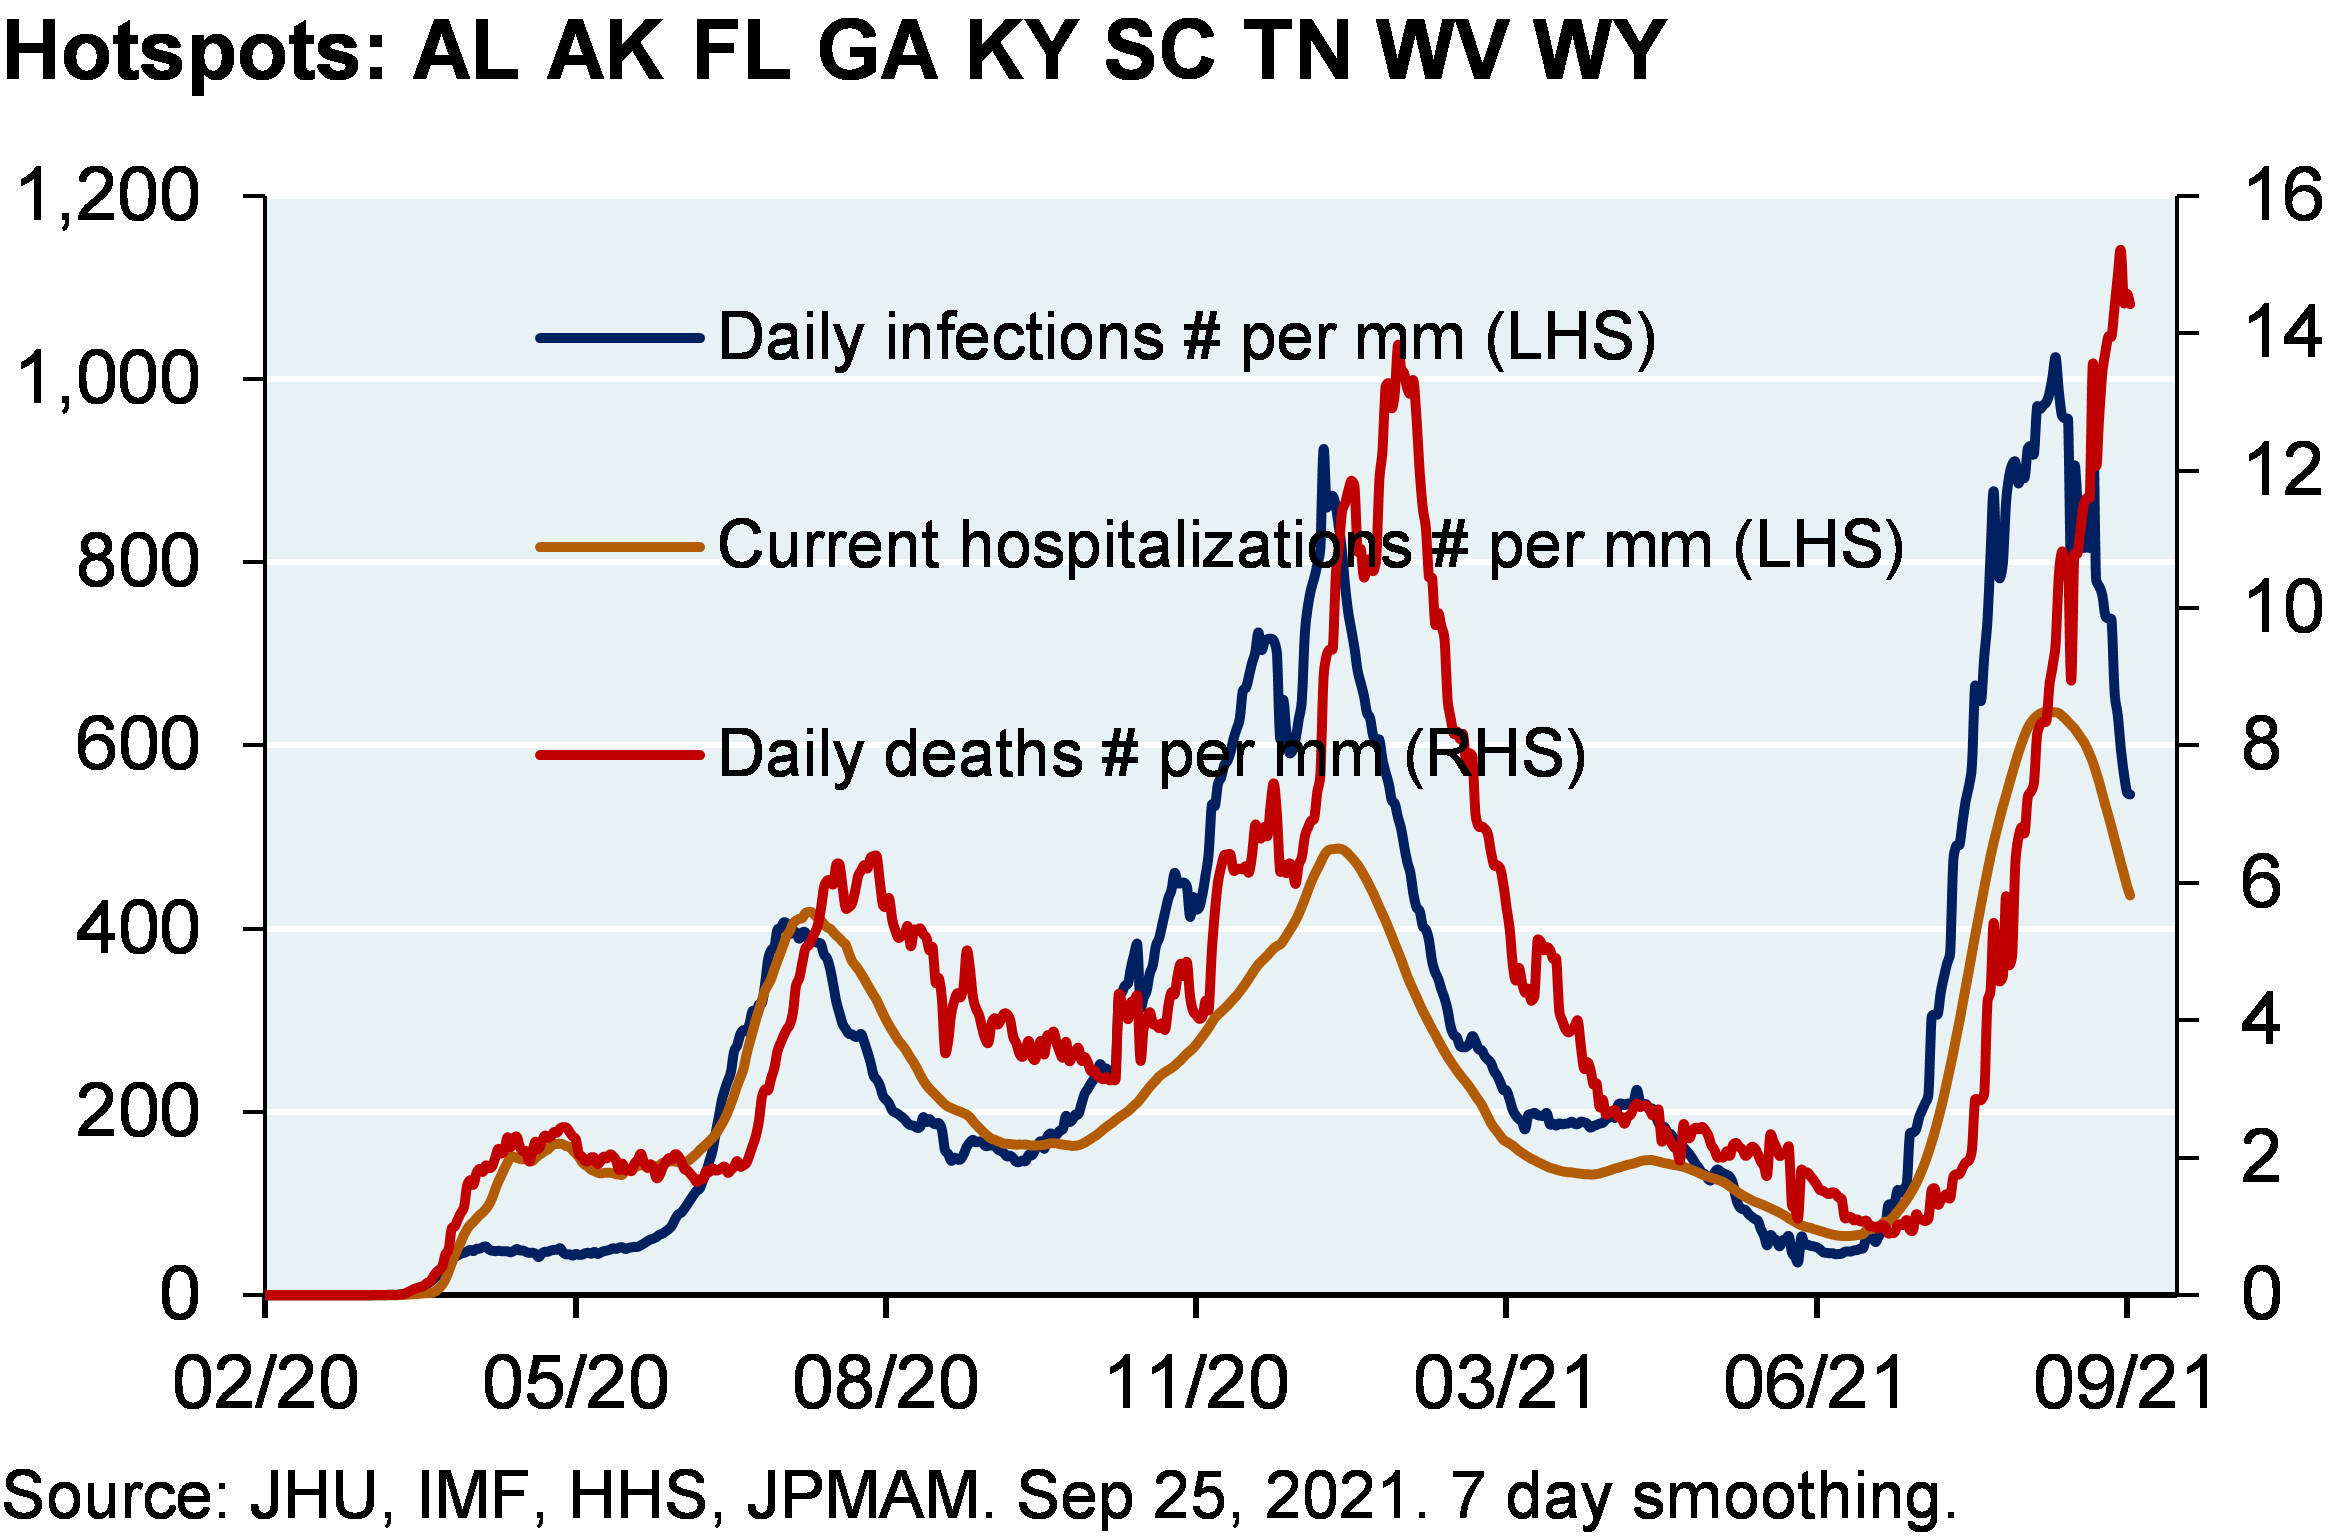
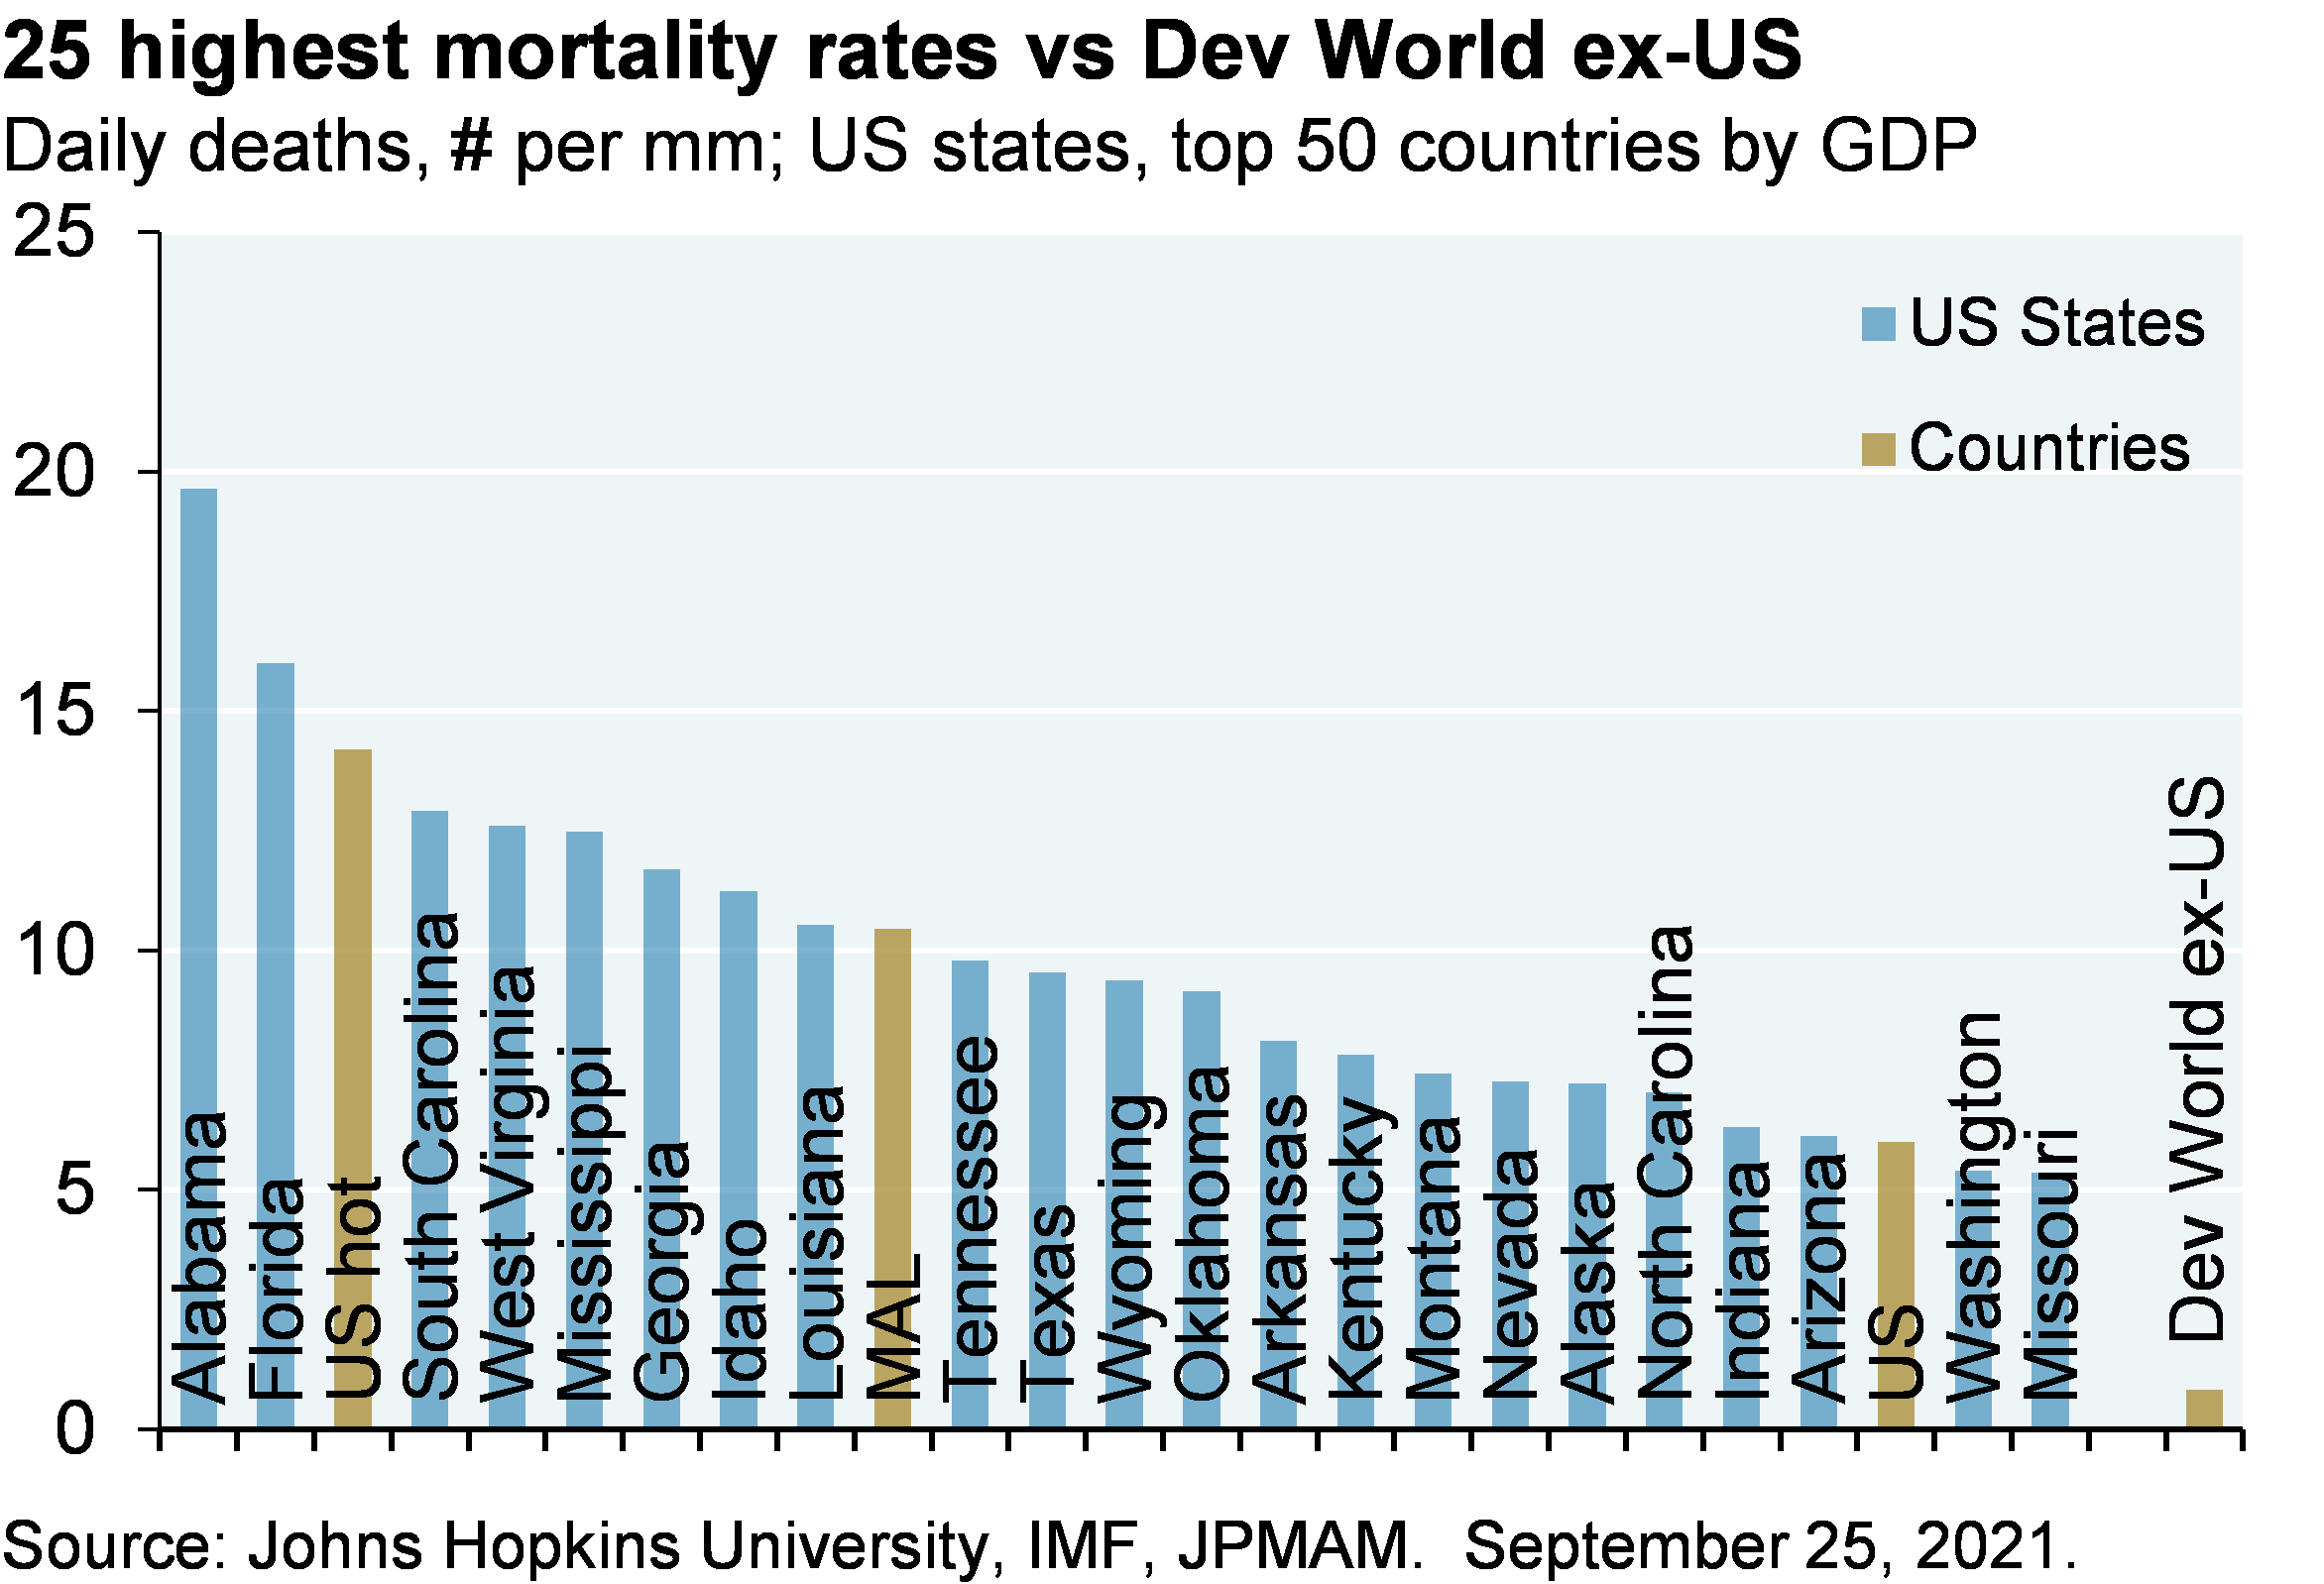
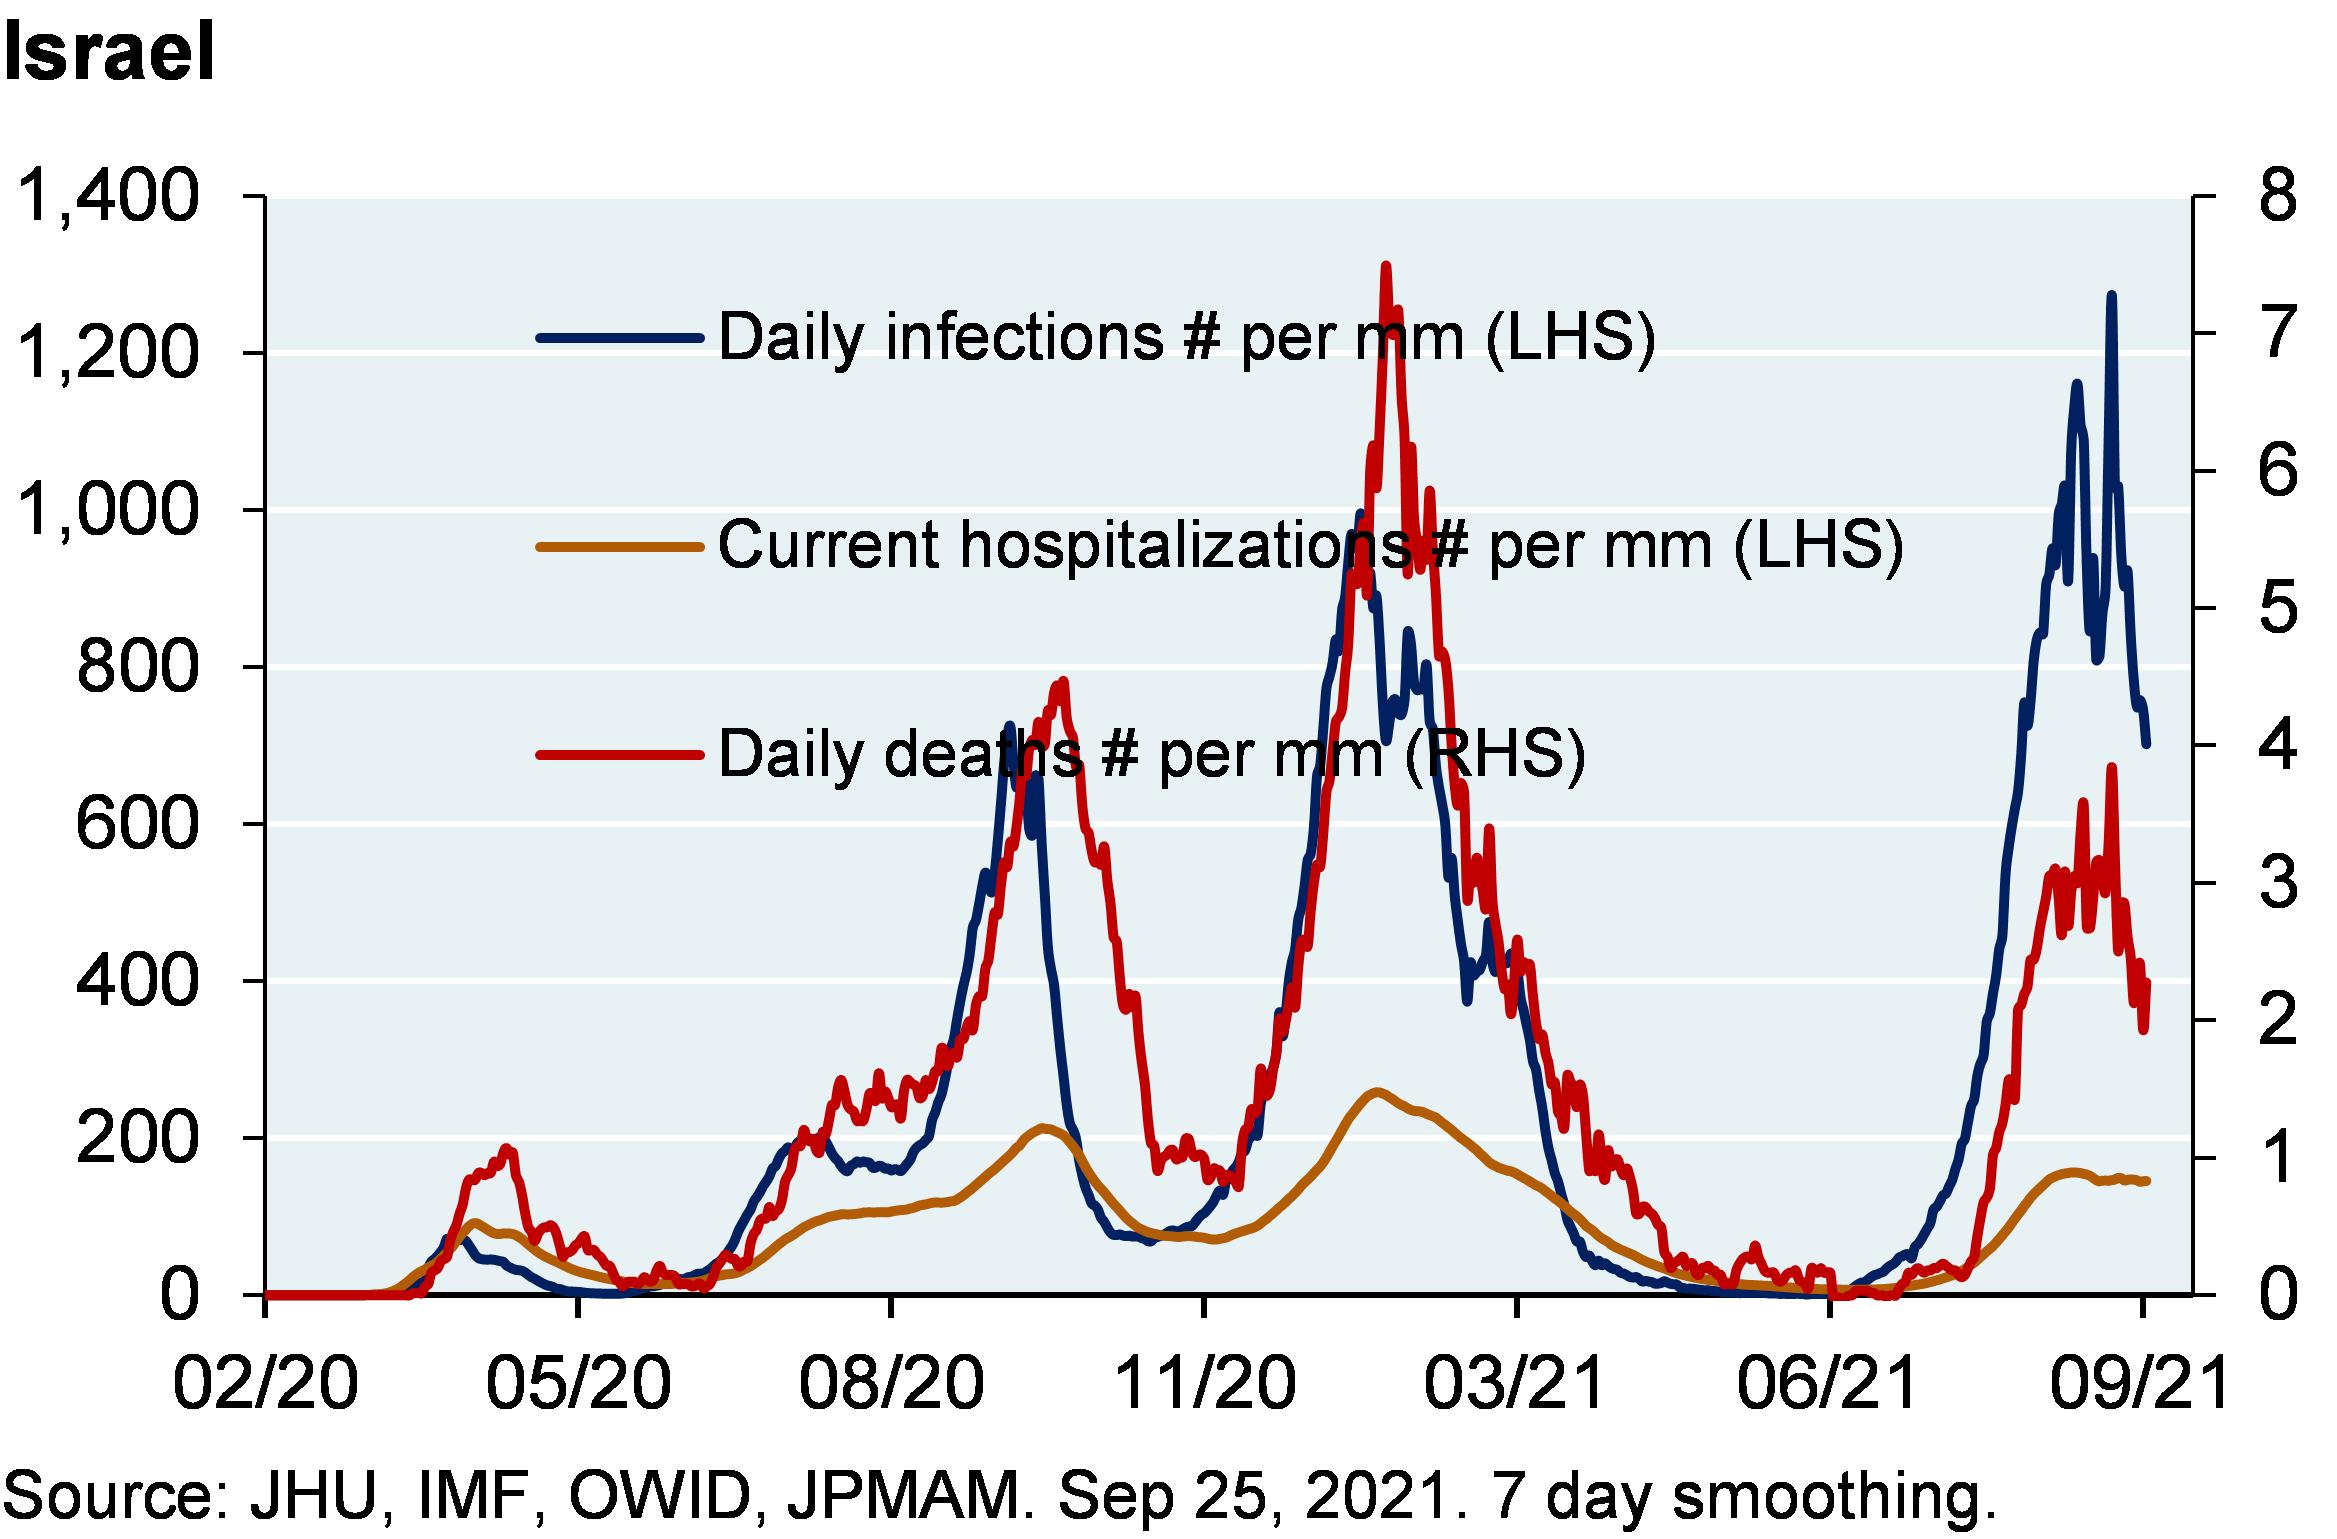
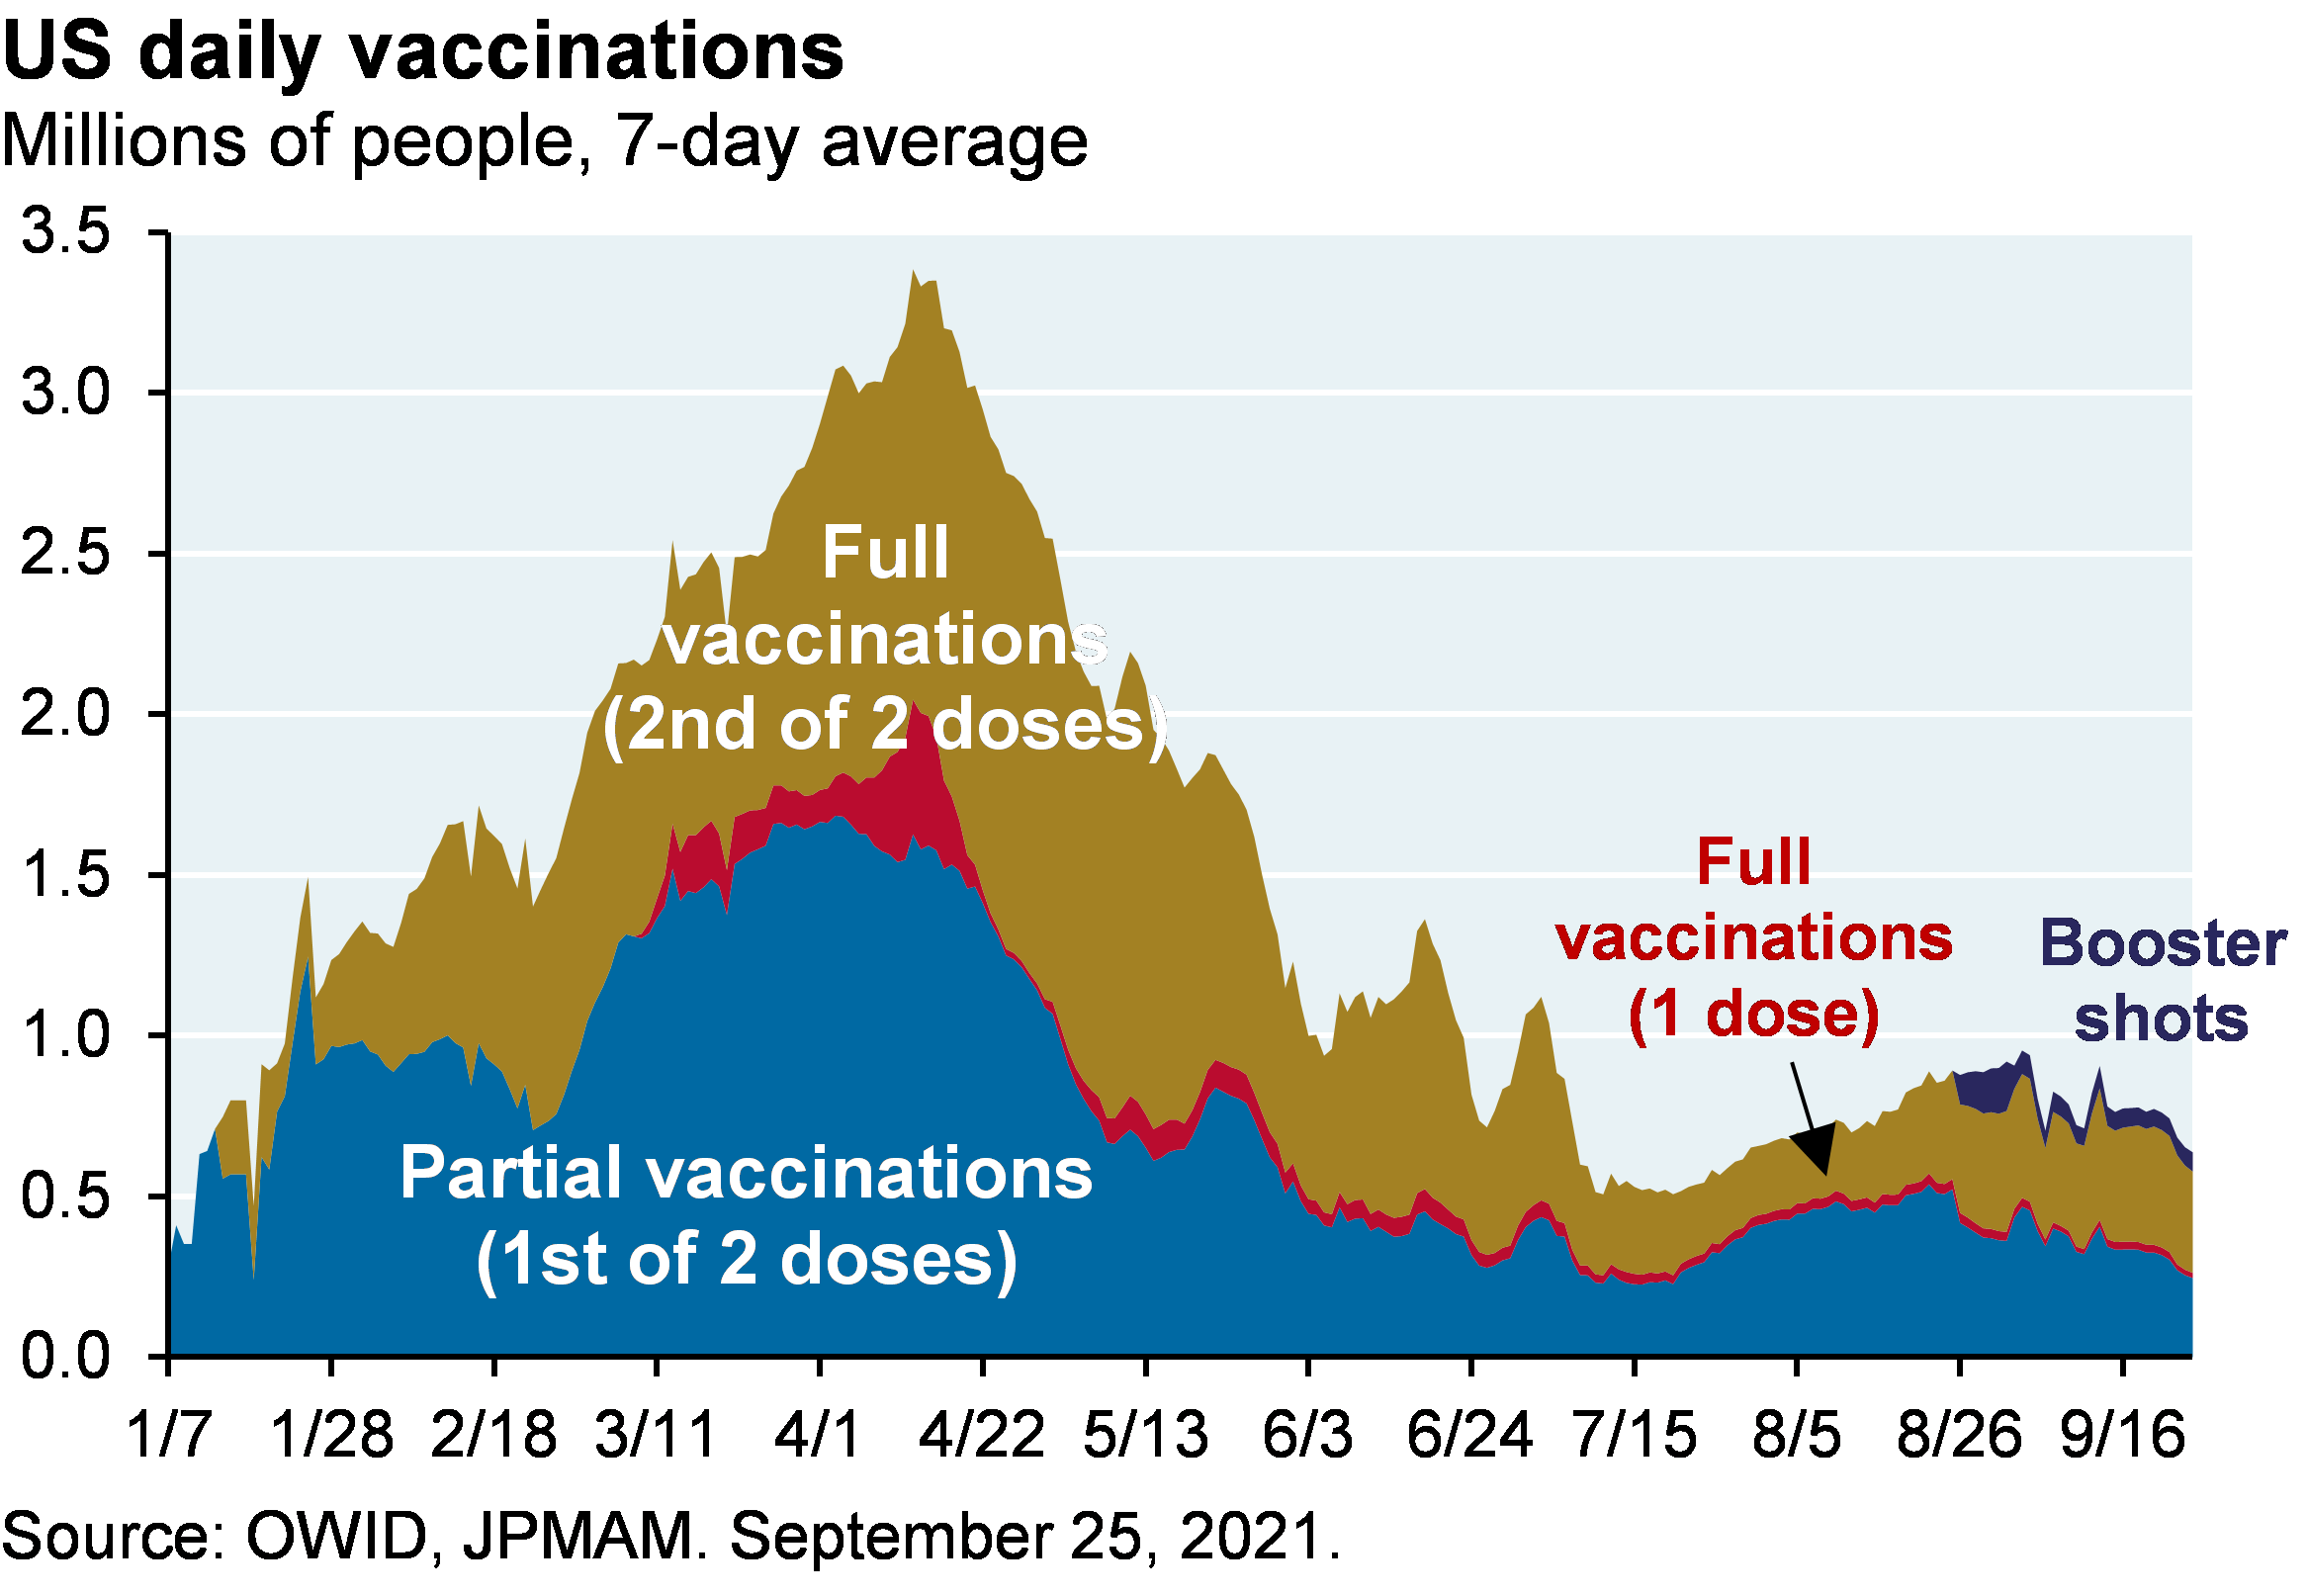
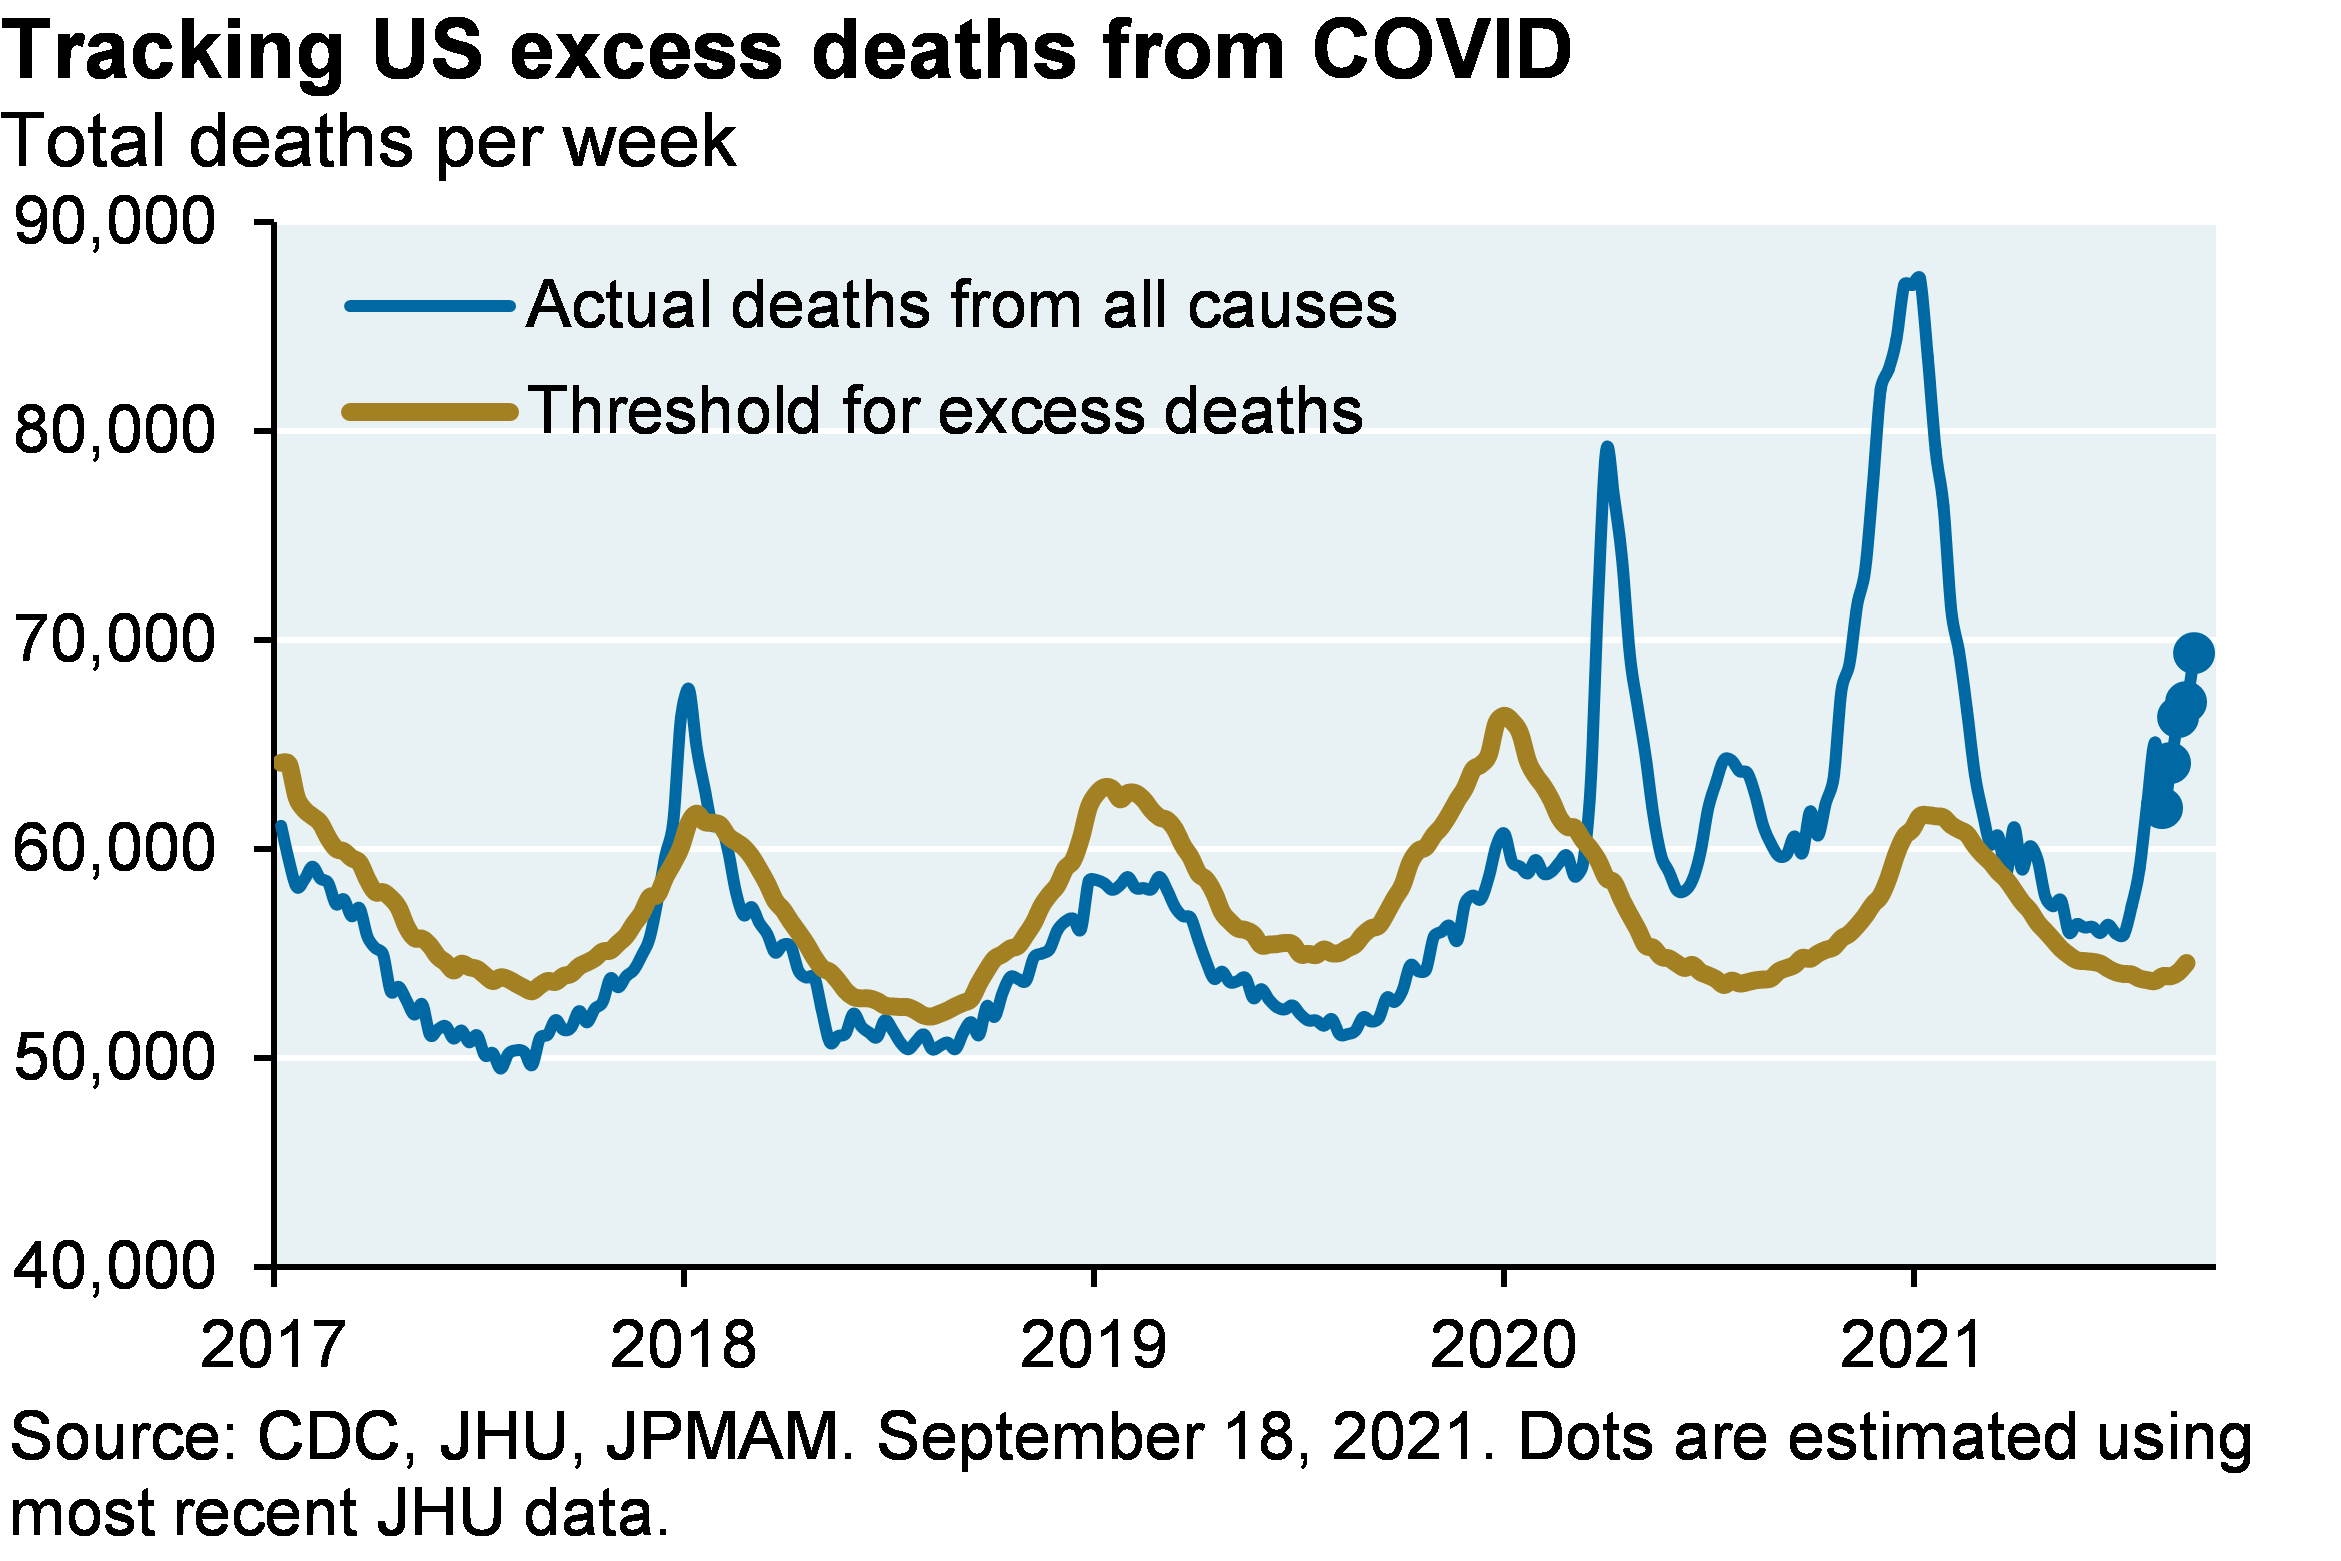
As for COVID, concerns may dissipate in the next few months. As we explained on our August webcast, this fall was going to be a very bad one in the US. Even so, given the high degree of Delta variant contagiousness, a combination of vaccination and acquired immunity should drive down pandemic measures substantially by November. The latest infection and hospitalization data from Hotspot states, horrific as they are (i.e., the world’s highest reported mortality rate) are beginning to roll over; mortality should follow. For anyone that disbelieves COVID mortality data, see the sixth chart below: there has been another surge in mortality from all causes in the US relative to seasonal trends. If you can think of another reason for this other than COVID, please let me know. The biggest risk to this outlook is fading immunity of vaccinated people; we will know over the next couple of months how this plays out in the US. Booster shots in Israel appear to drive antibody levels up substantially, and also result in Pfizer efficacy vs severe infection that rises above 90% again.

Line chart shows daily infections per million and daily deaths per million for the developed world. The rise in infections and mortality are much higher than was anticipated when the vaccination programs began. Daily infections are above 200 per mm and daily deaths are above 2 per mm.
Line chart shows daily infections per million, current hospitalizations and daily deaths per million for US COVID hotspot states.  Daily infections and hospitalizations have begun to roll over from the latest surge, while mortality is still rising.
Line chart shows countries and US states with the 25 highest mortality rates. US hotspot mortality rates are now the highest in the world, alongside Malaysia, and are more than 10x higher than mortality rates in the rest of the developed world. Of US states, Alabama now has the highest mortality rate, edging out Florida.
30.	Line chart shows daily infections per million, current hospitalizations and daily deaths per million for Israel. The COVID surge in Israel has been higher than anticipated given Israel’s ~70% vaccination rate. Daily infections are just below 800 per mm and daily deaths are close to 2 per mm.
 Area chart shows partial, 1-dose full, 2-dose full, and booster dose US daily vaccinations. At the April peak, about 3.3 million people were getting vaccinated a day. More recently, about 500k people are getting vaccinated a day, split evenly between partial and full vaccinations, with a small portion of doses going to booster shots and 1-dose vaccinations.
Line chart shows actual deaths per week from all causes vs the threshold for excess deaths from 2017 to 2021. Actual deaths from all causes were below the threshold from 2017 to the start of COVID, with the exception of a brief spike in 2018. Actual deaths from all causes spiked at the end of 2020 at about 90,000 before dropping to the threshold. Recently, however, actual deaths have started to pick up again and are well above seasonal trends (about 70,000 actual deaths per week)


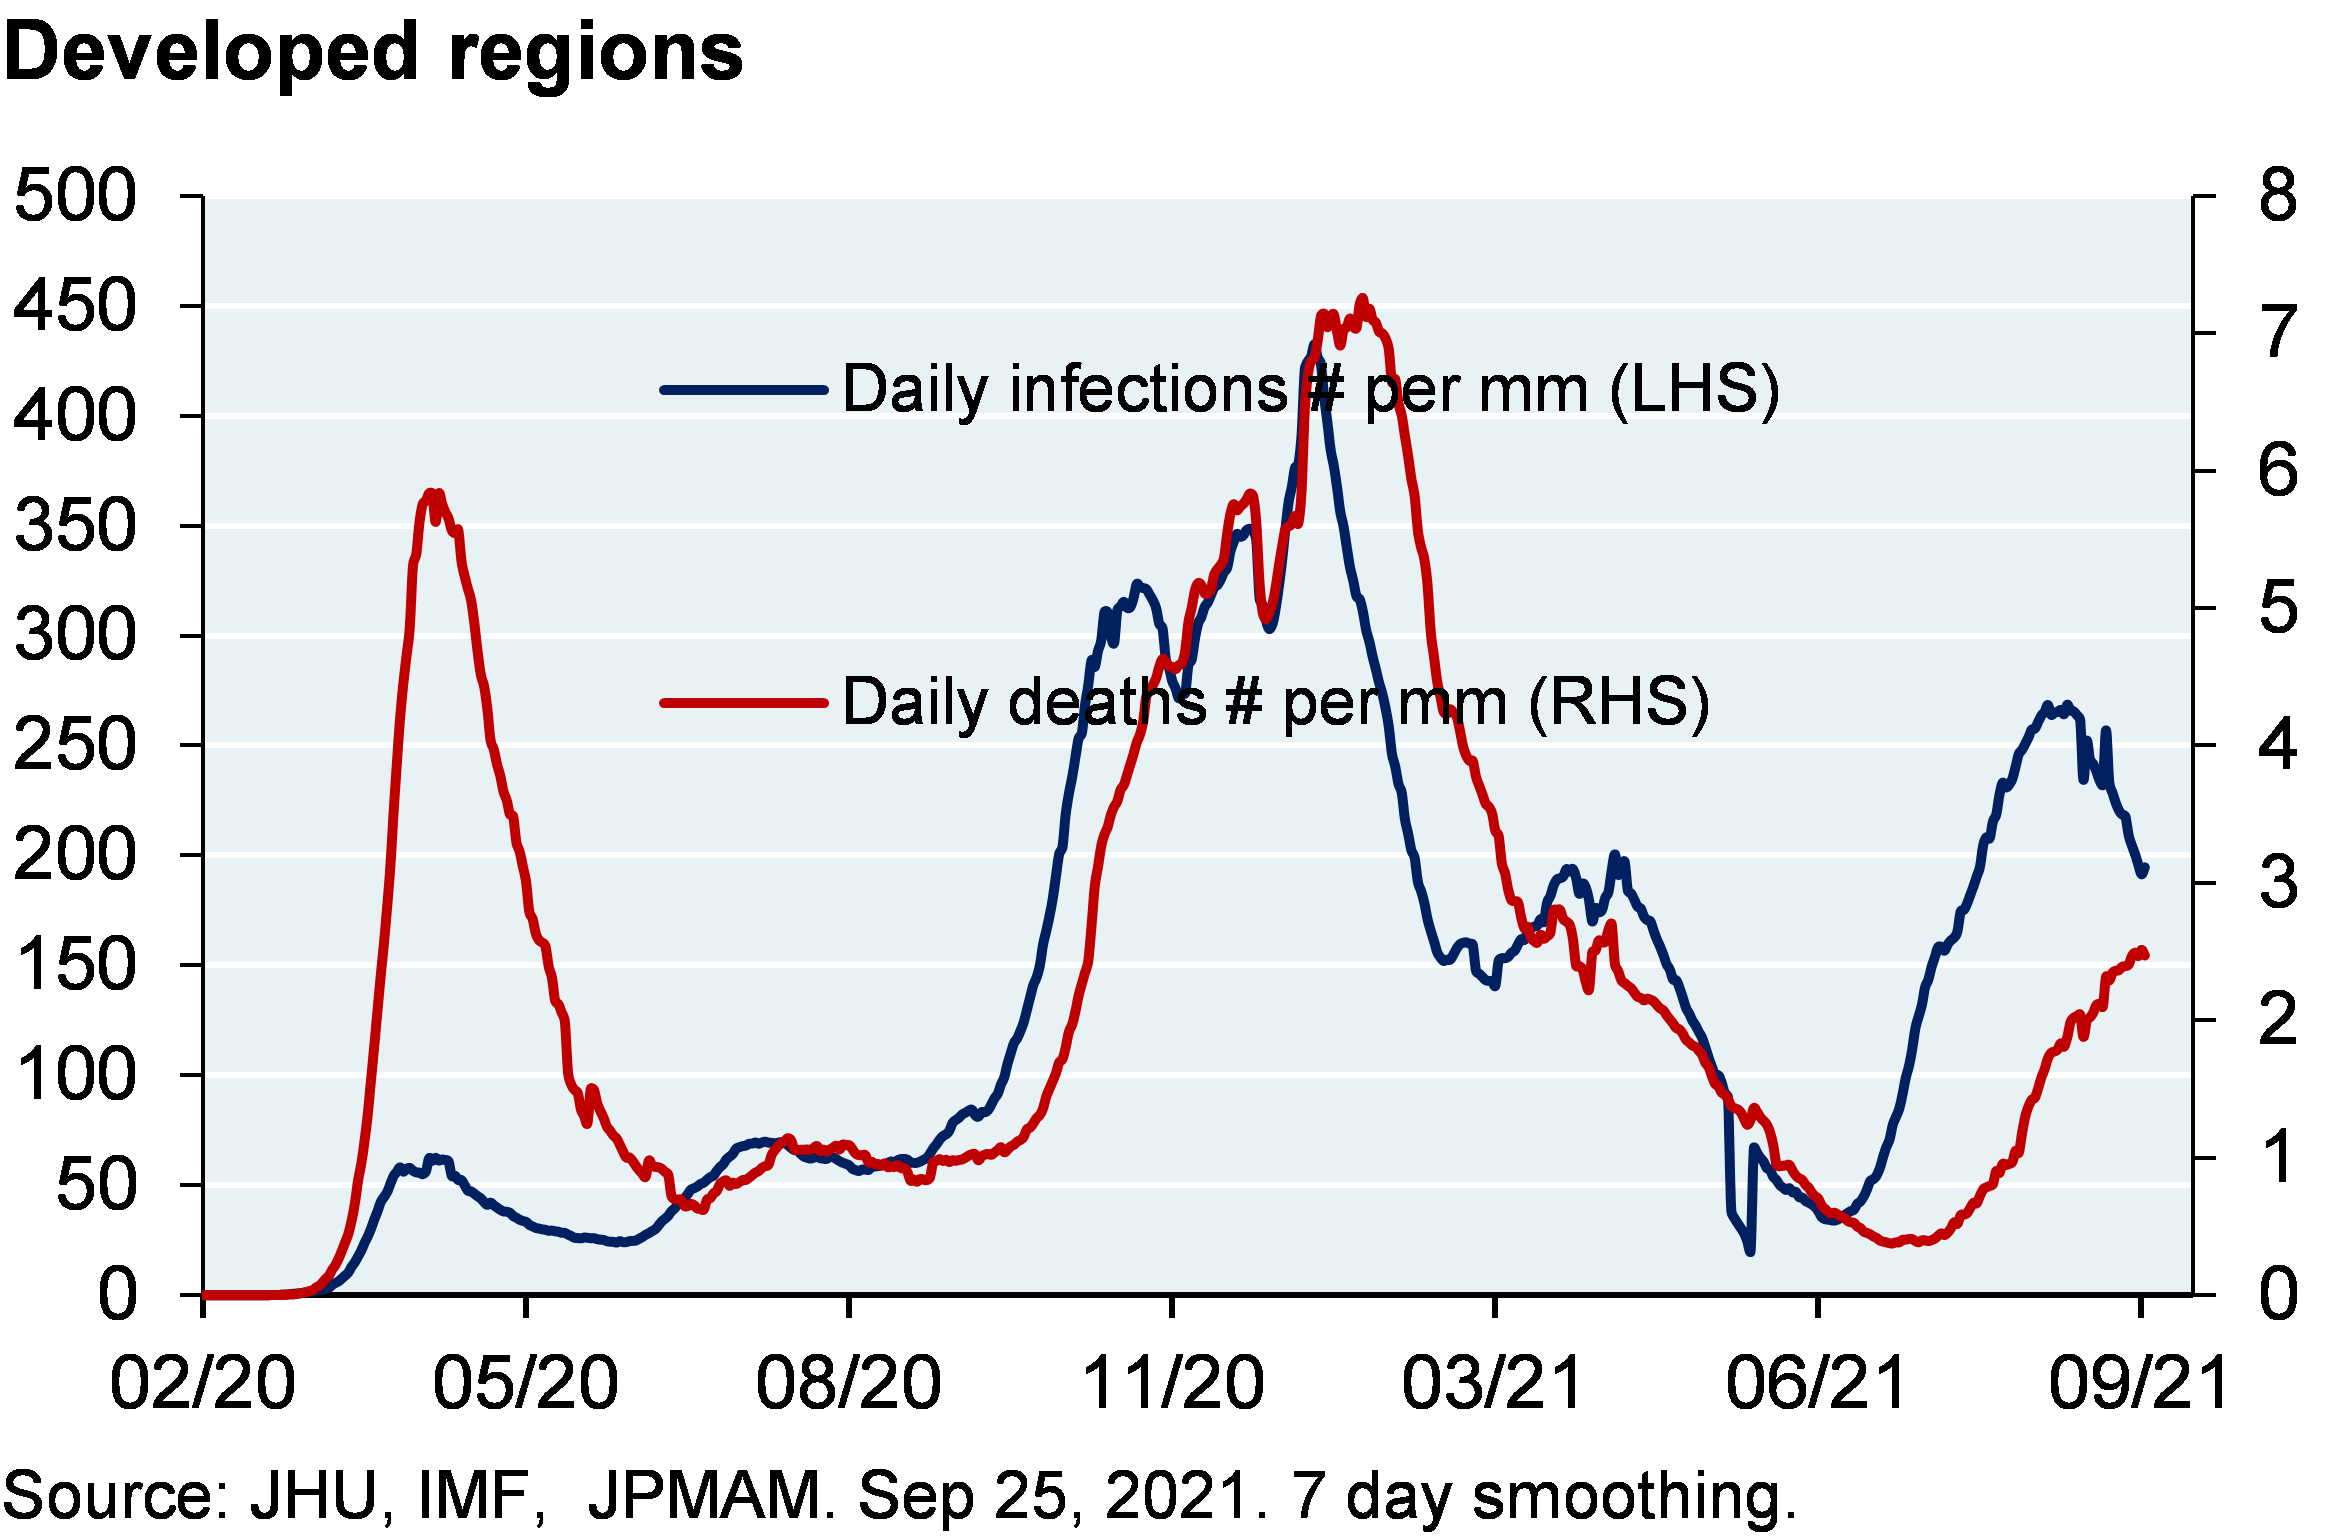
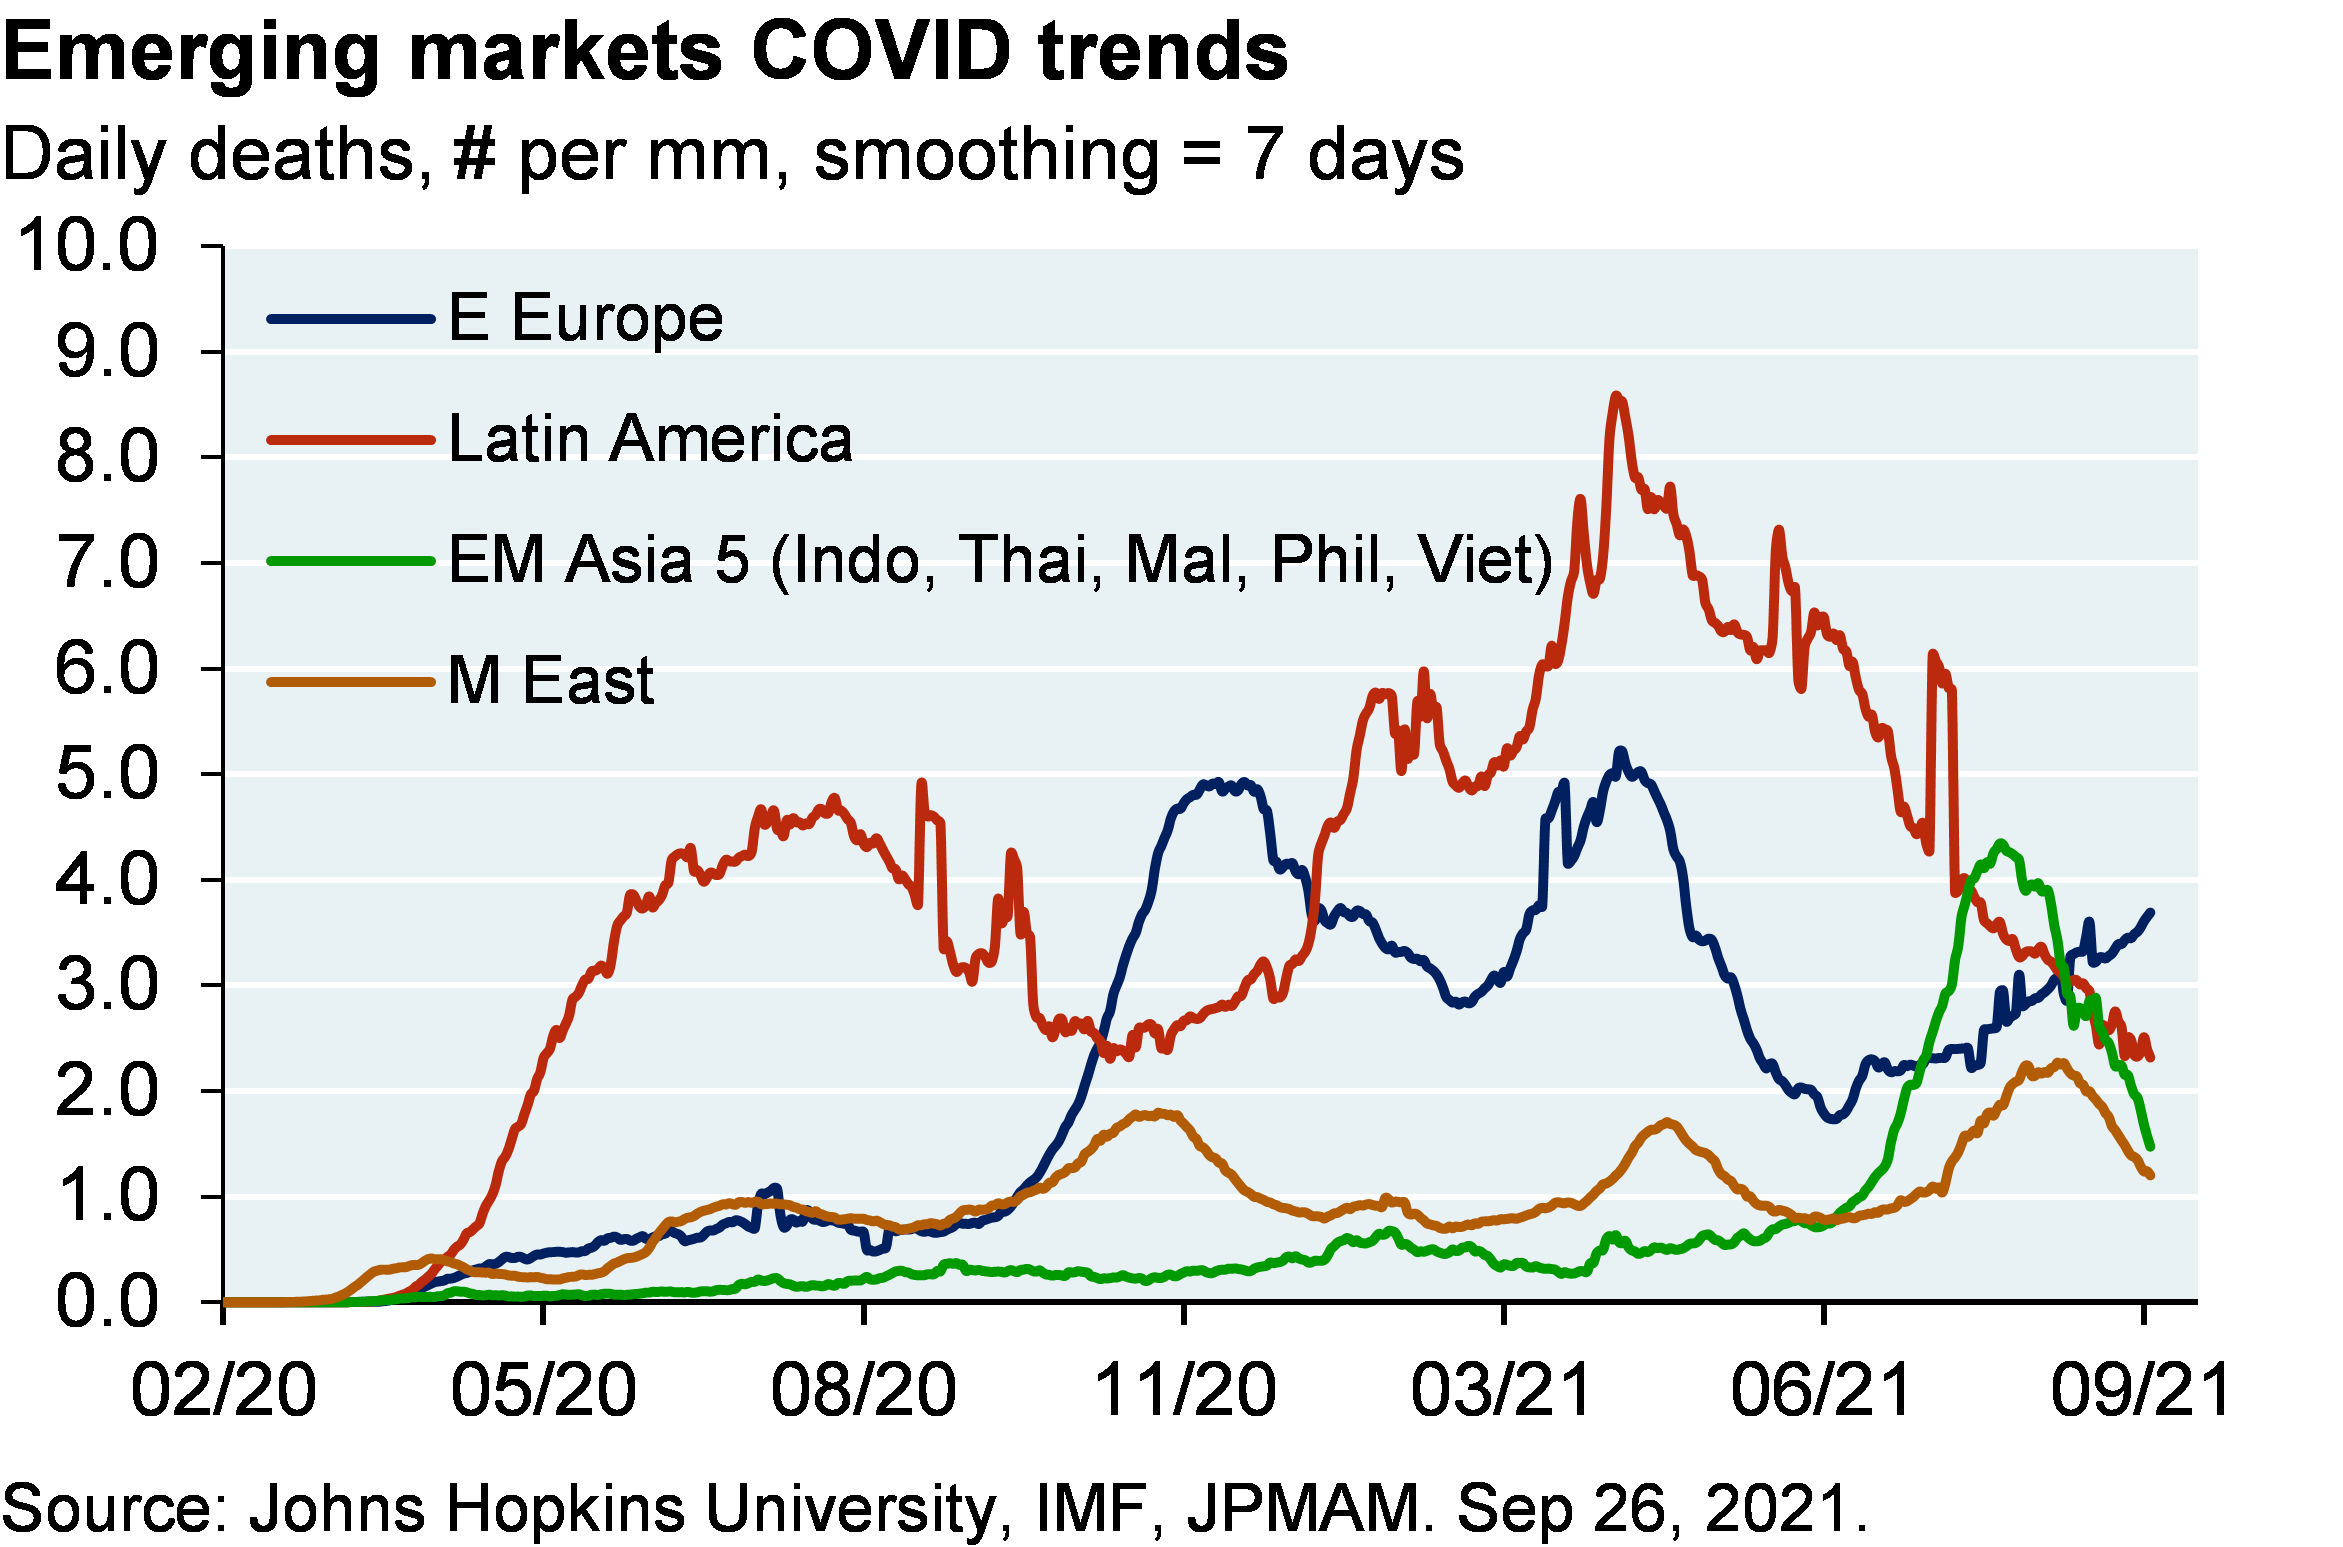
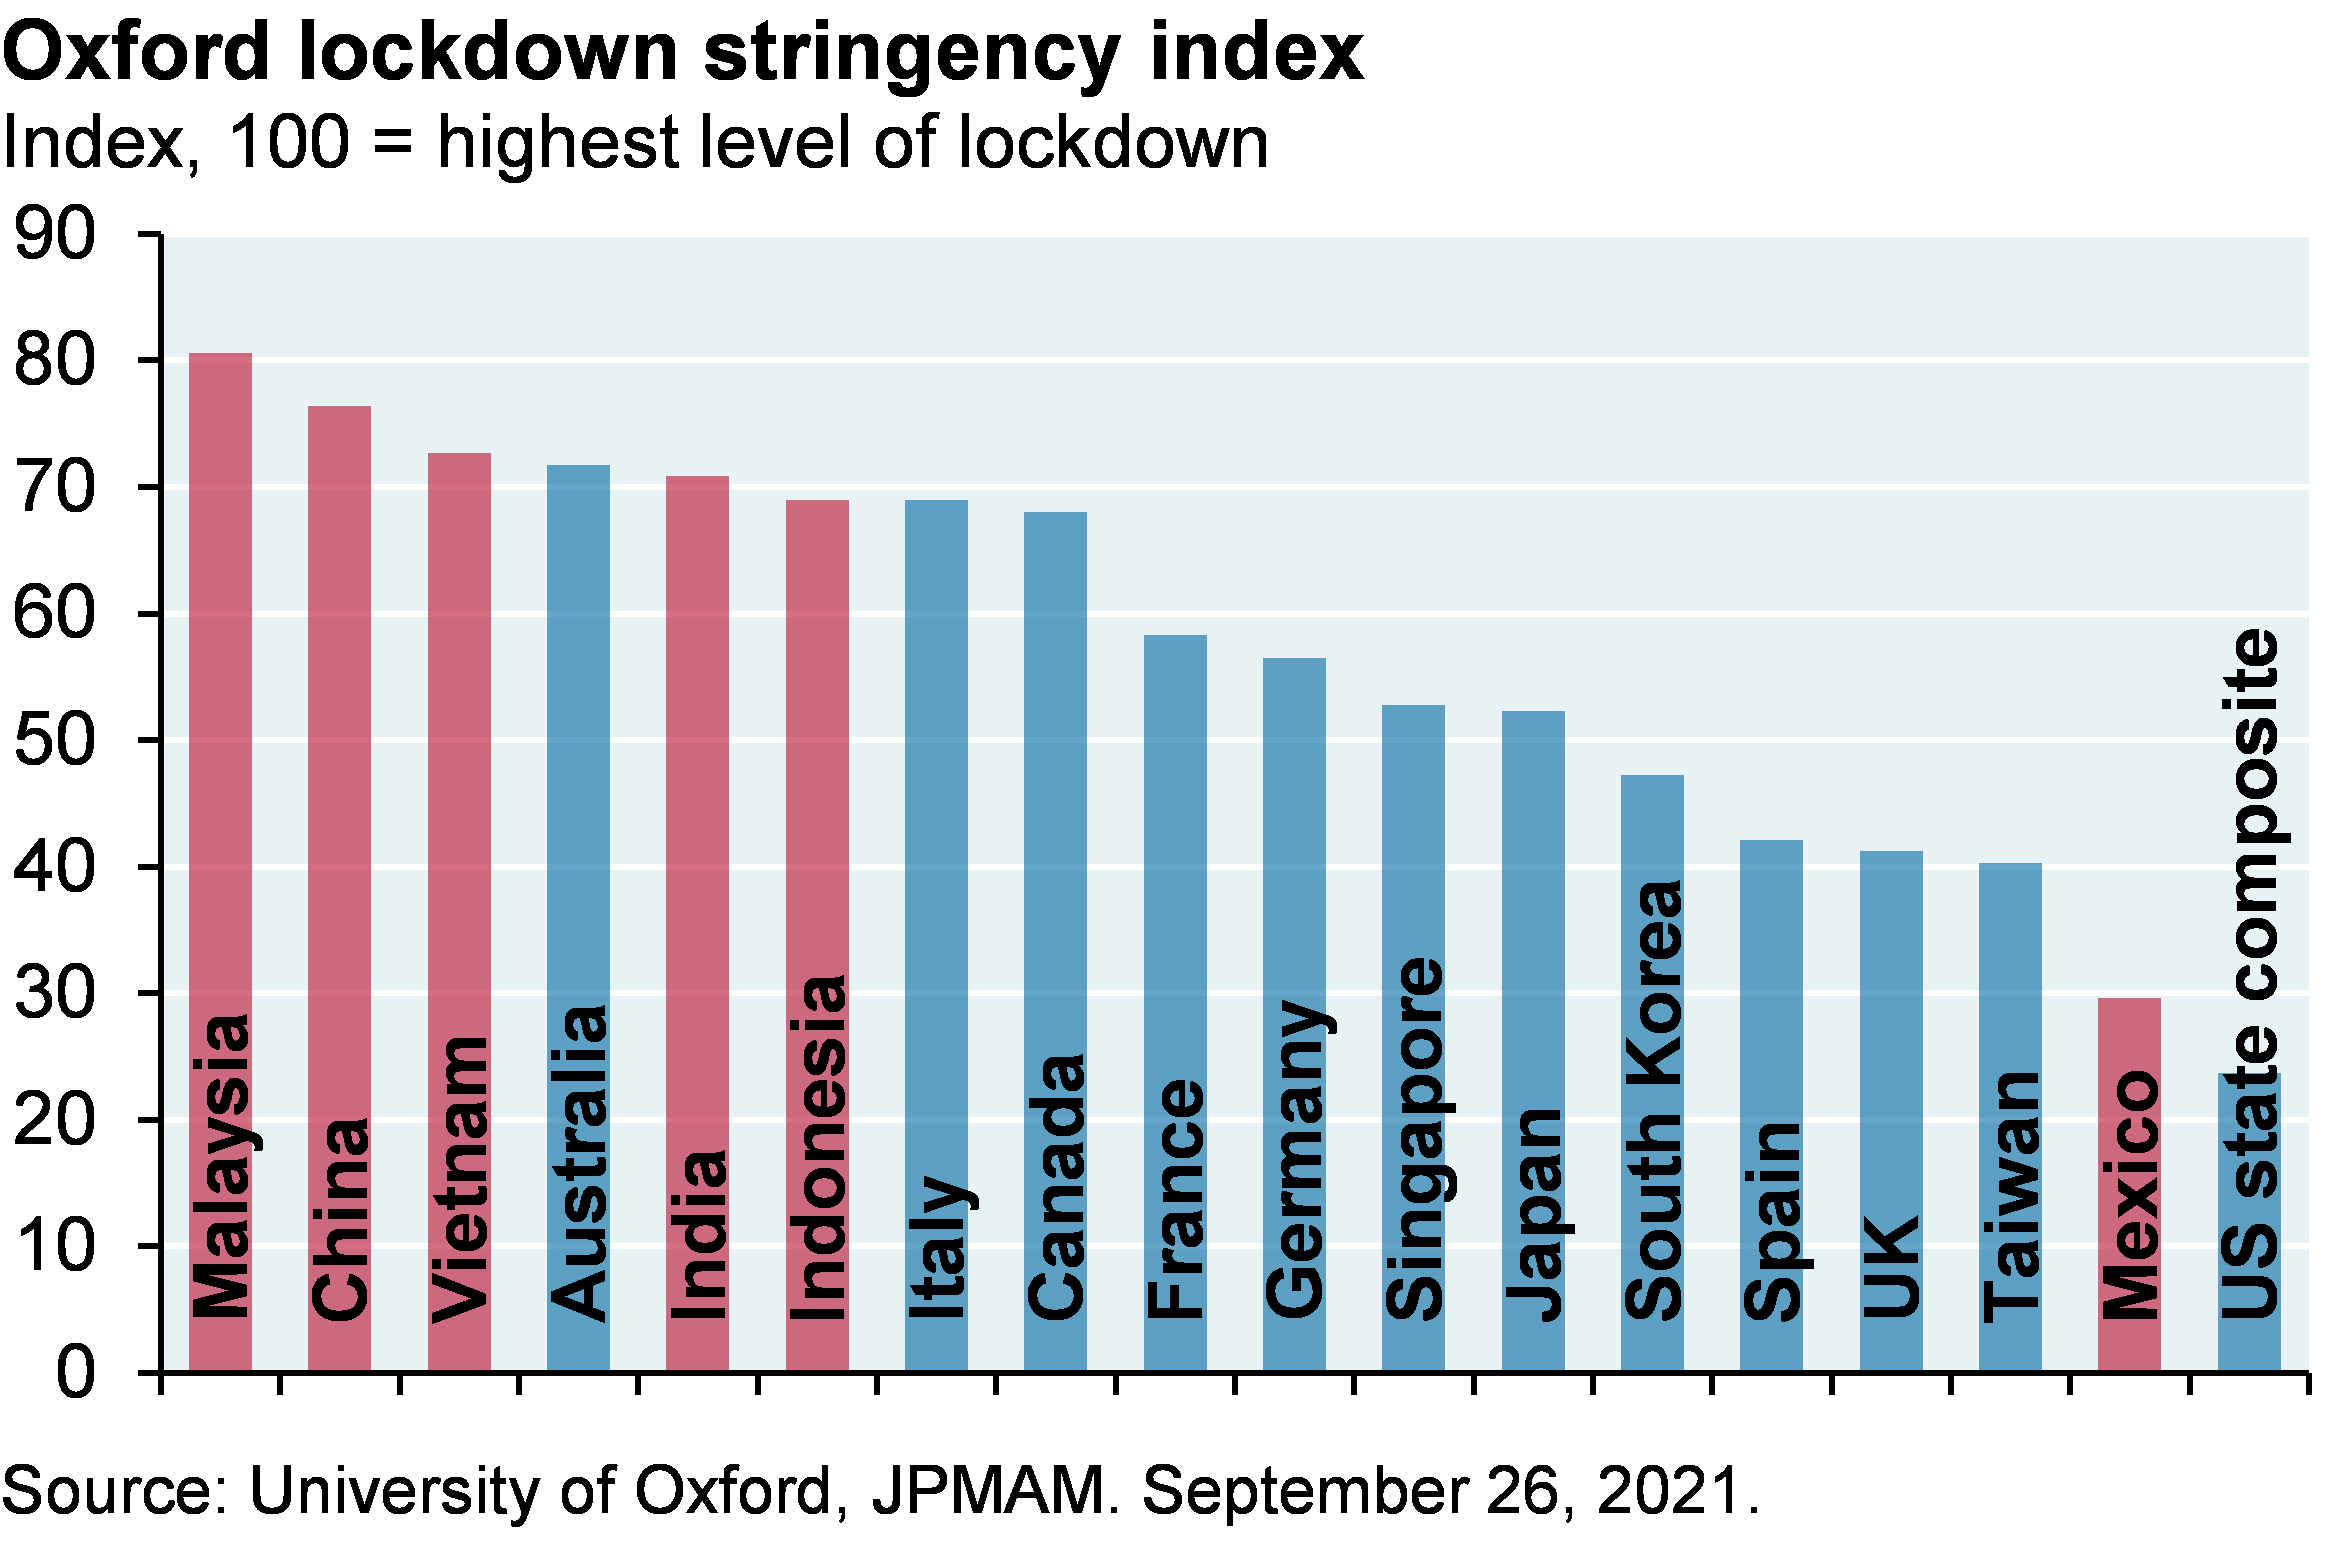
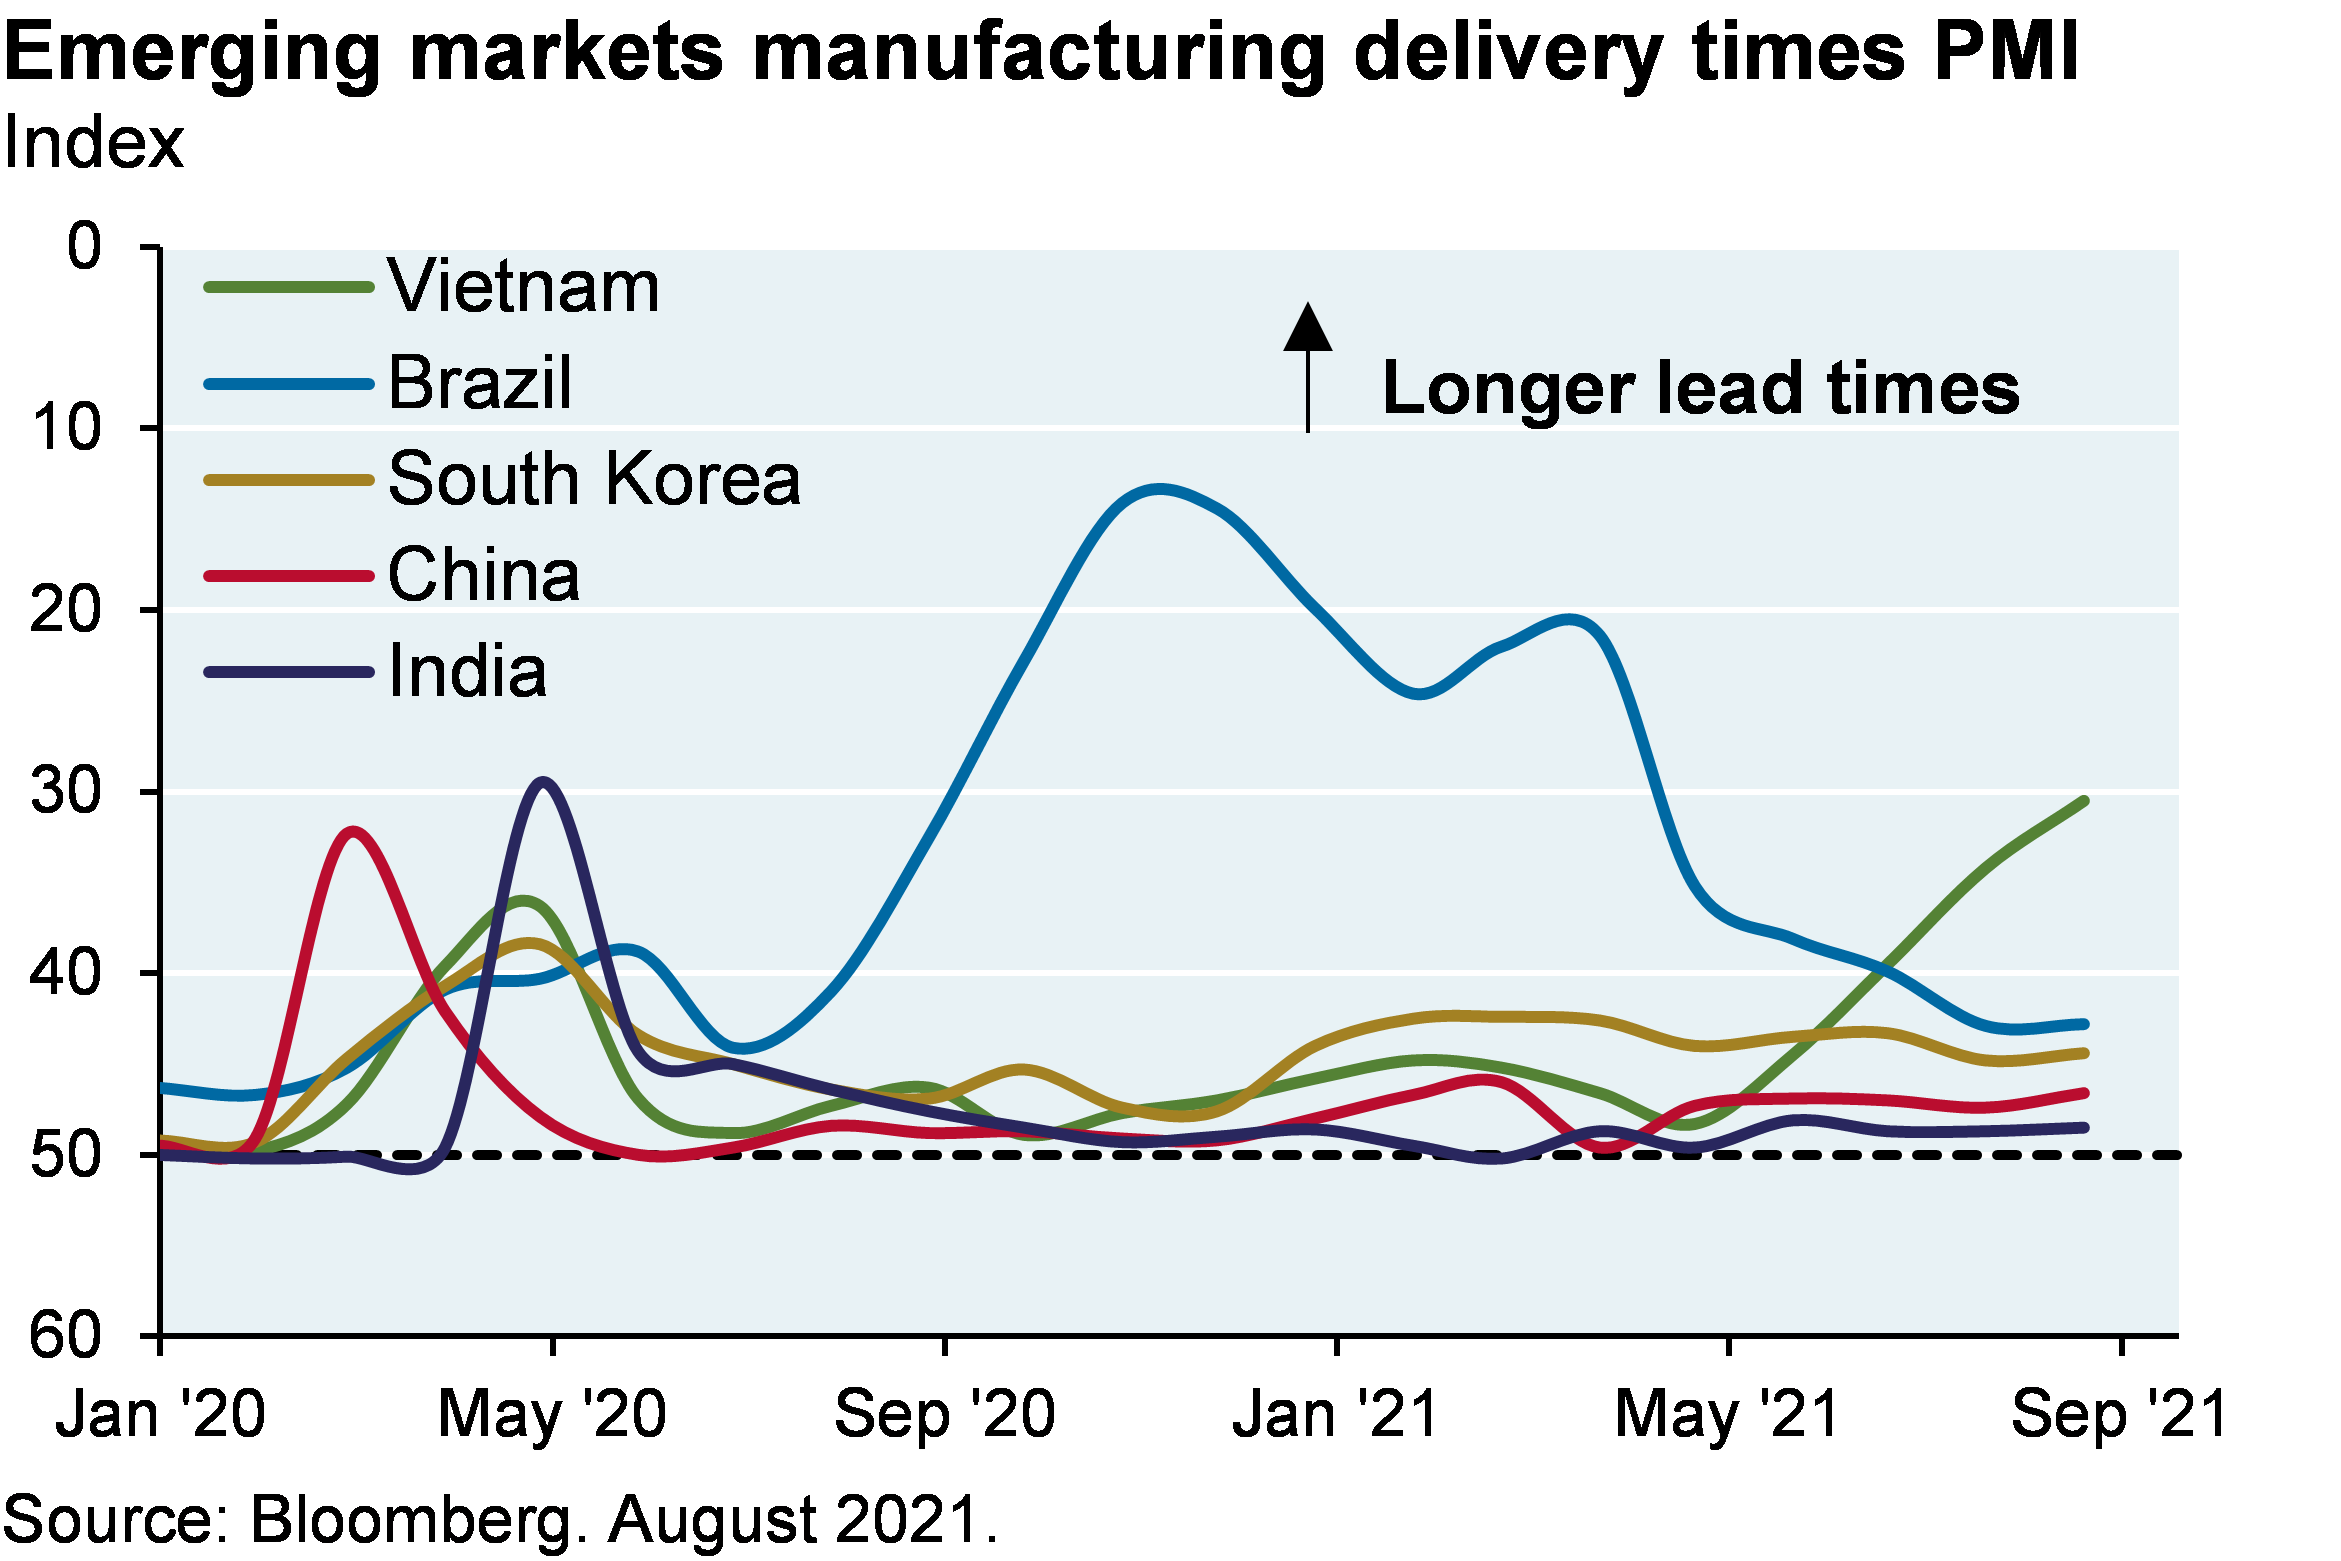
Developing world infections and mortality are declining due to exhaustion of Lambda and Gamma variants in Latin America and the decline in the Delta variant in Asia (although mortality is rising in Eastern Europe again). Many Asian countries have higher COVID stringency rules than developed countries, an indication of how seriously govt’s view the risks and the ability of their healthcare systems to respond to it. Emerging markets are not the epicenter of most supply chain problems, at least as measured by supplier delivery times. But countries like Malaysia play an outsized role in the semiconductor food chain due to its role as a major center for chip testing and packaging, the last step in the semiconductor food chain which is also more labor-intensive than automated wafer fabrication. The delta variant has caused Infineon, NXP and STMicroelectronics shutdowns in Asia, which resulted in component shortages at Nissan, Toyota, Ford and GM operations elsewhere. Malaysia is also a large producer of multilayer ceramic capacitors, used in smartphones and cars.

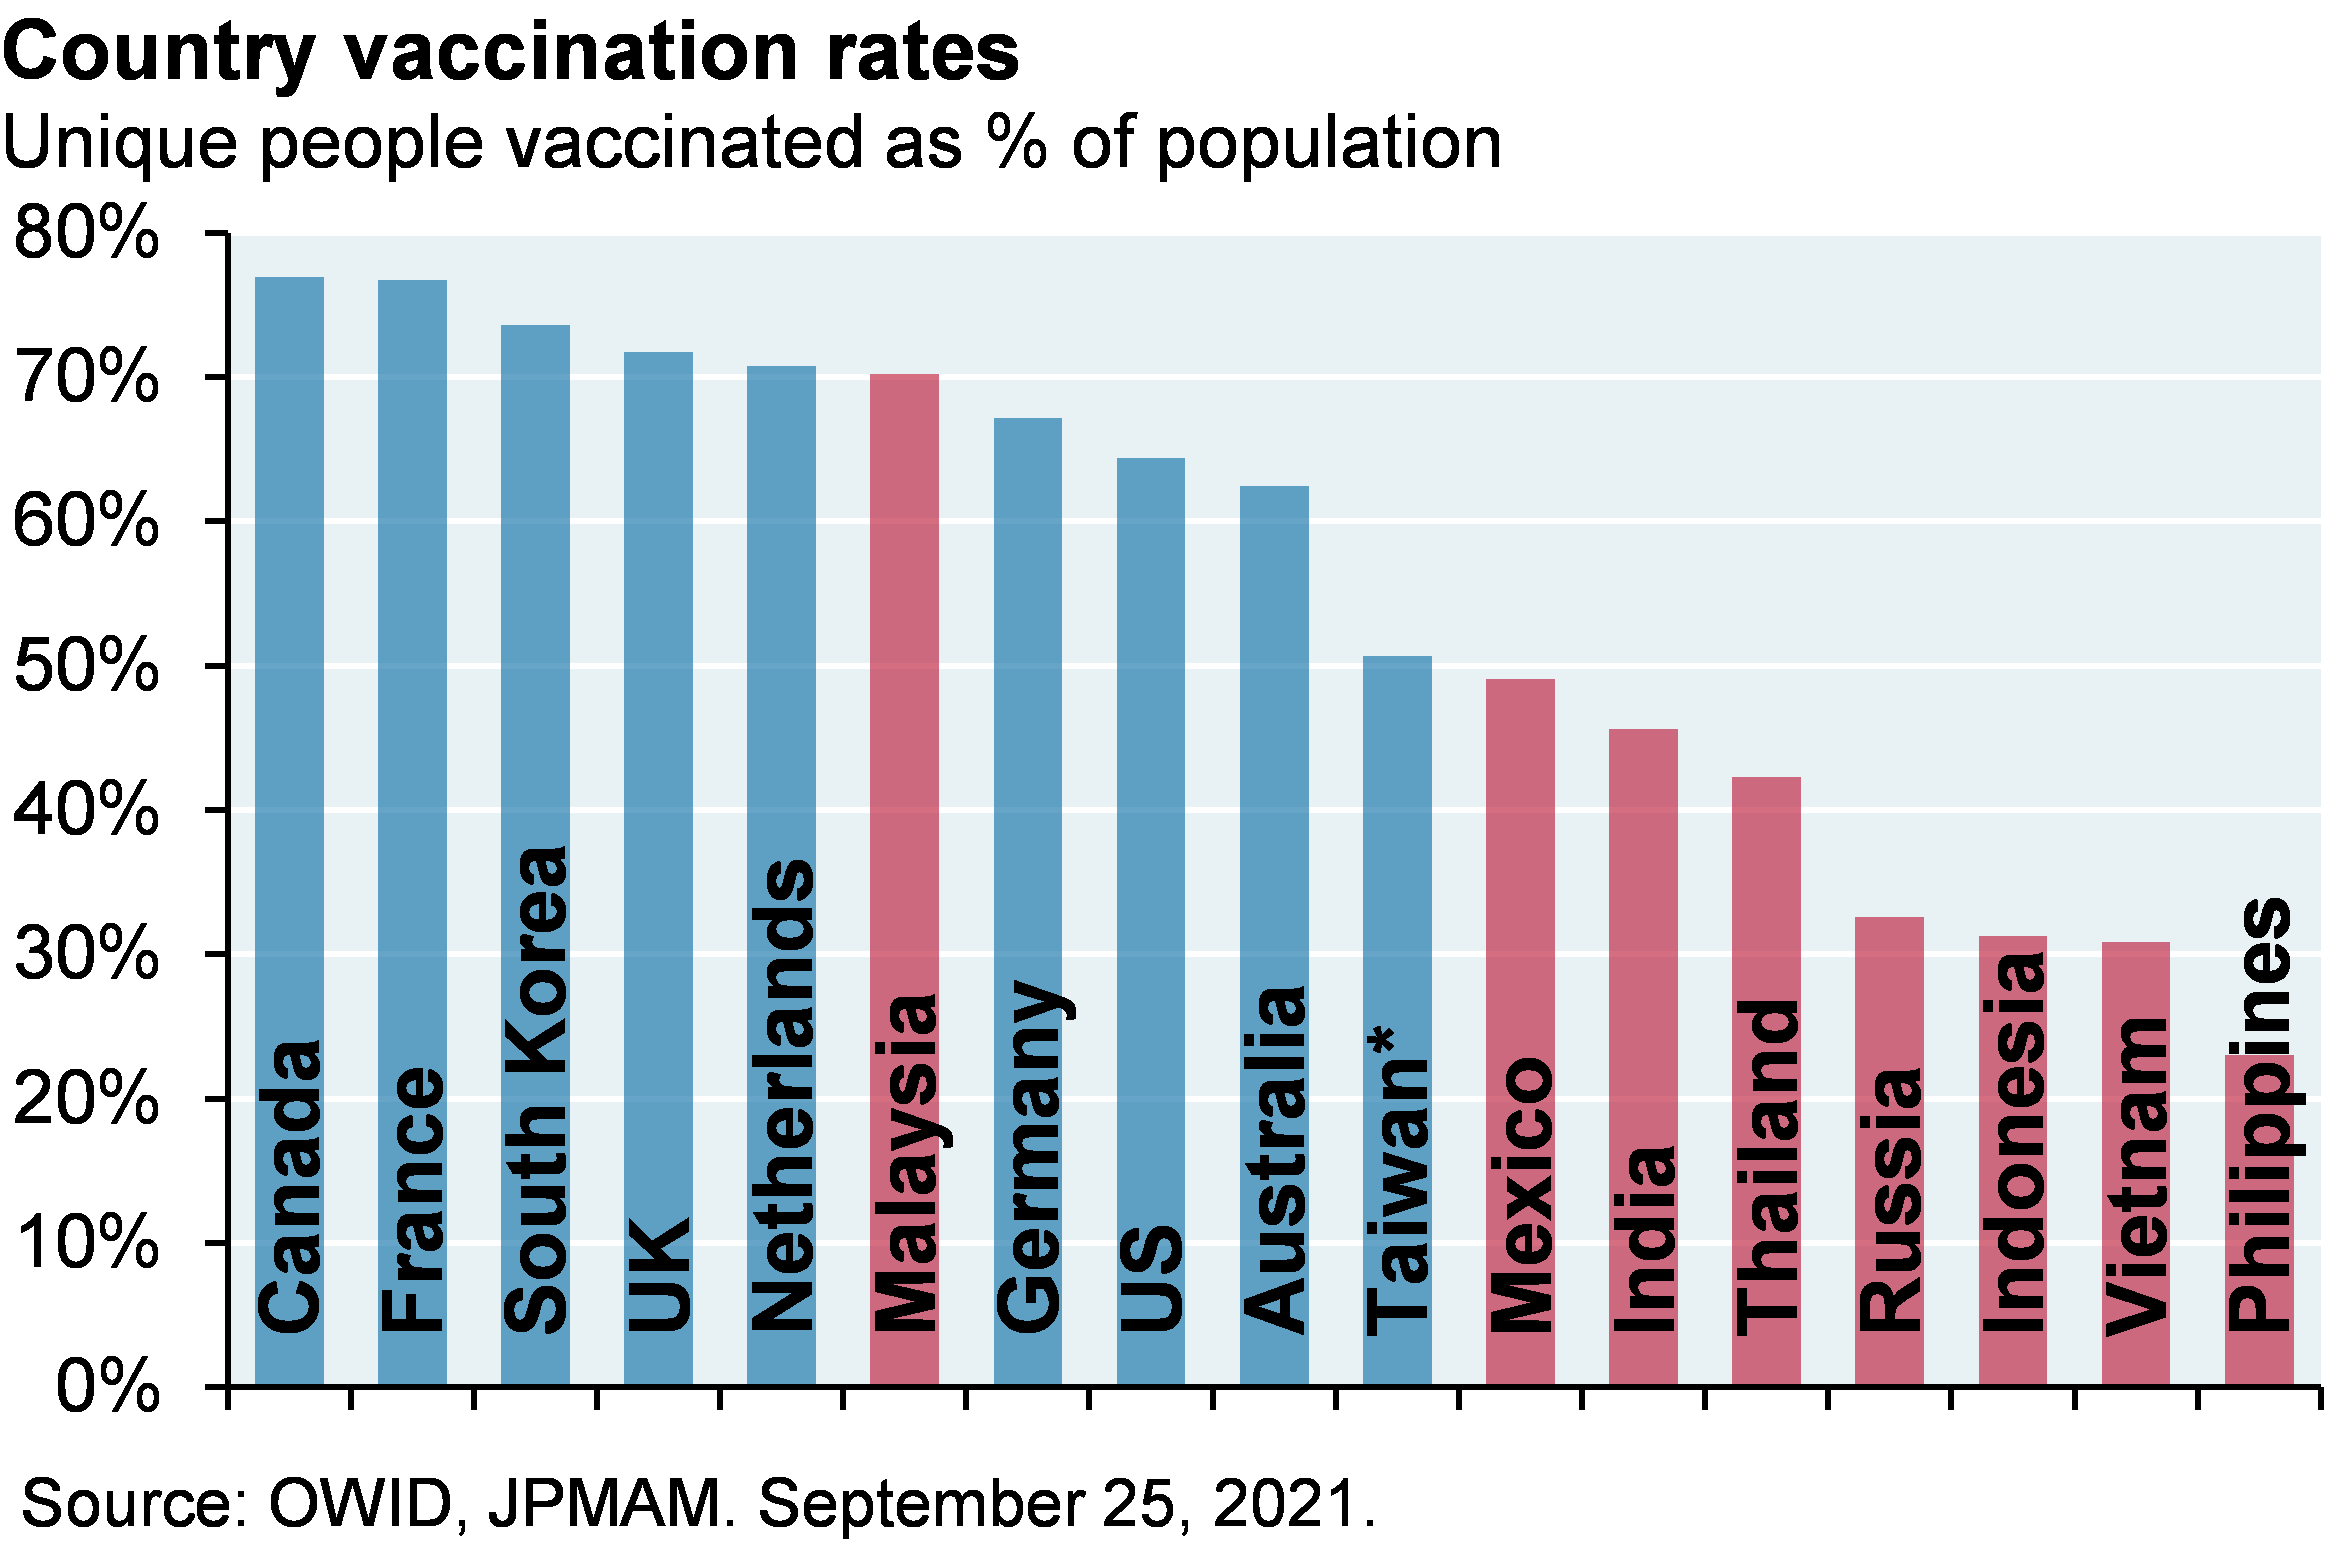
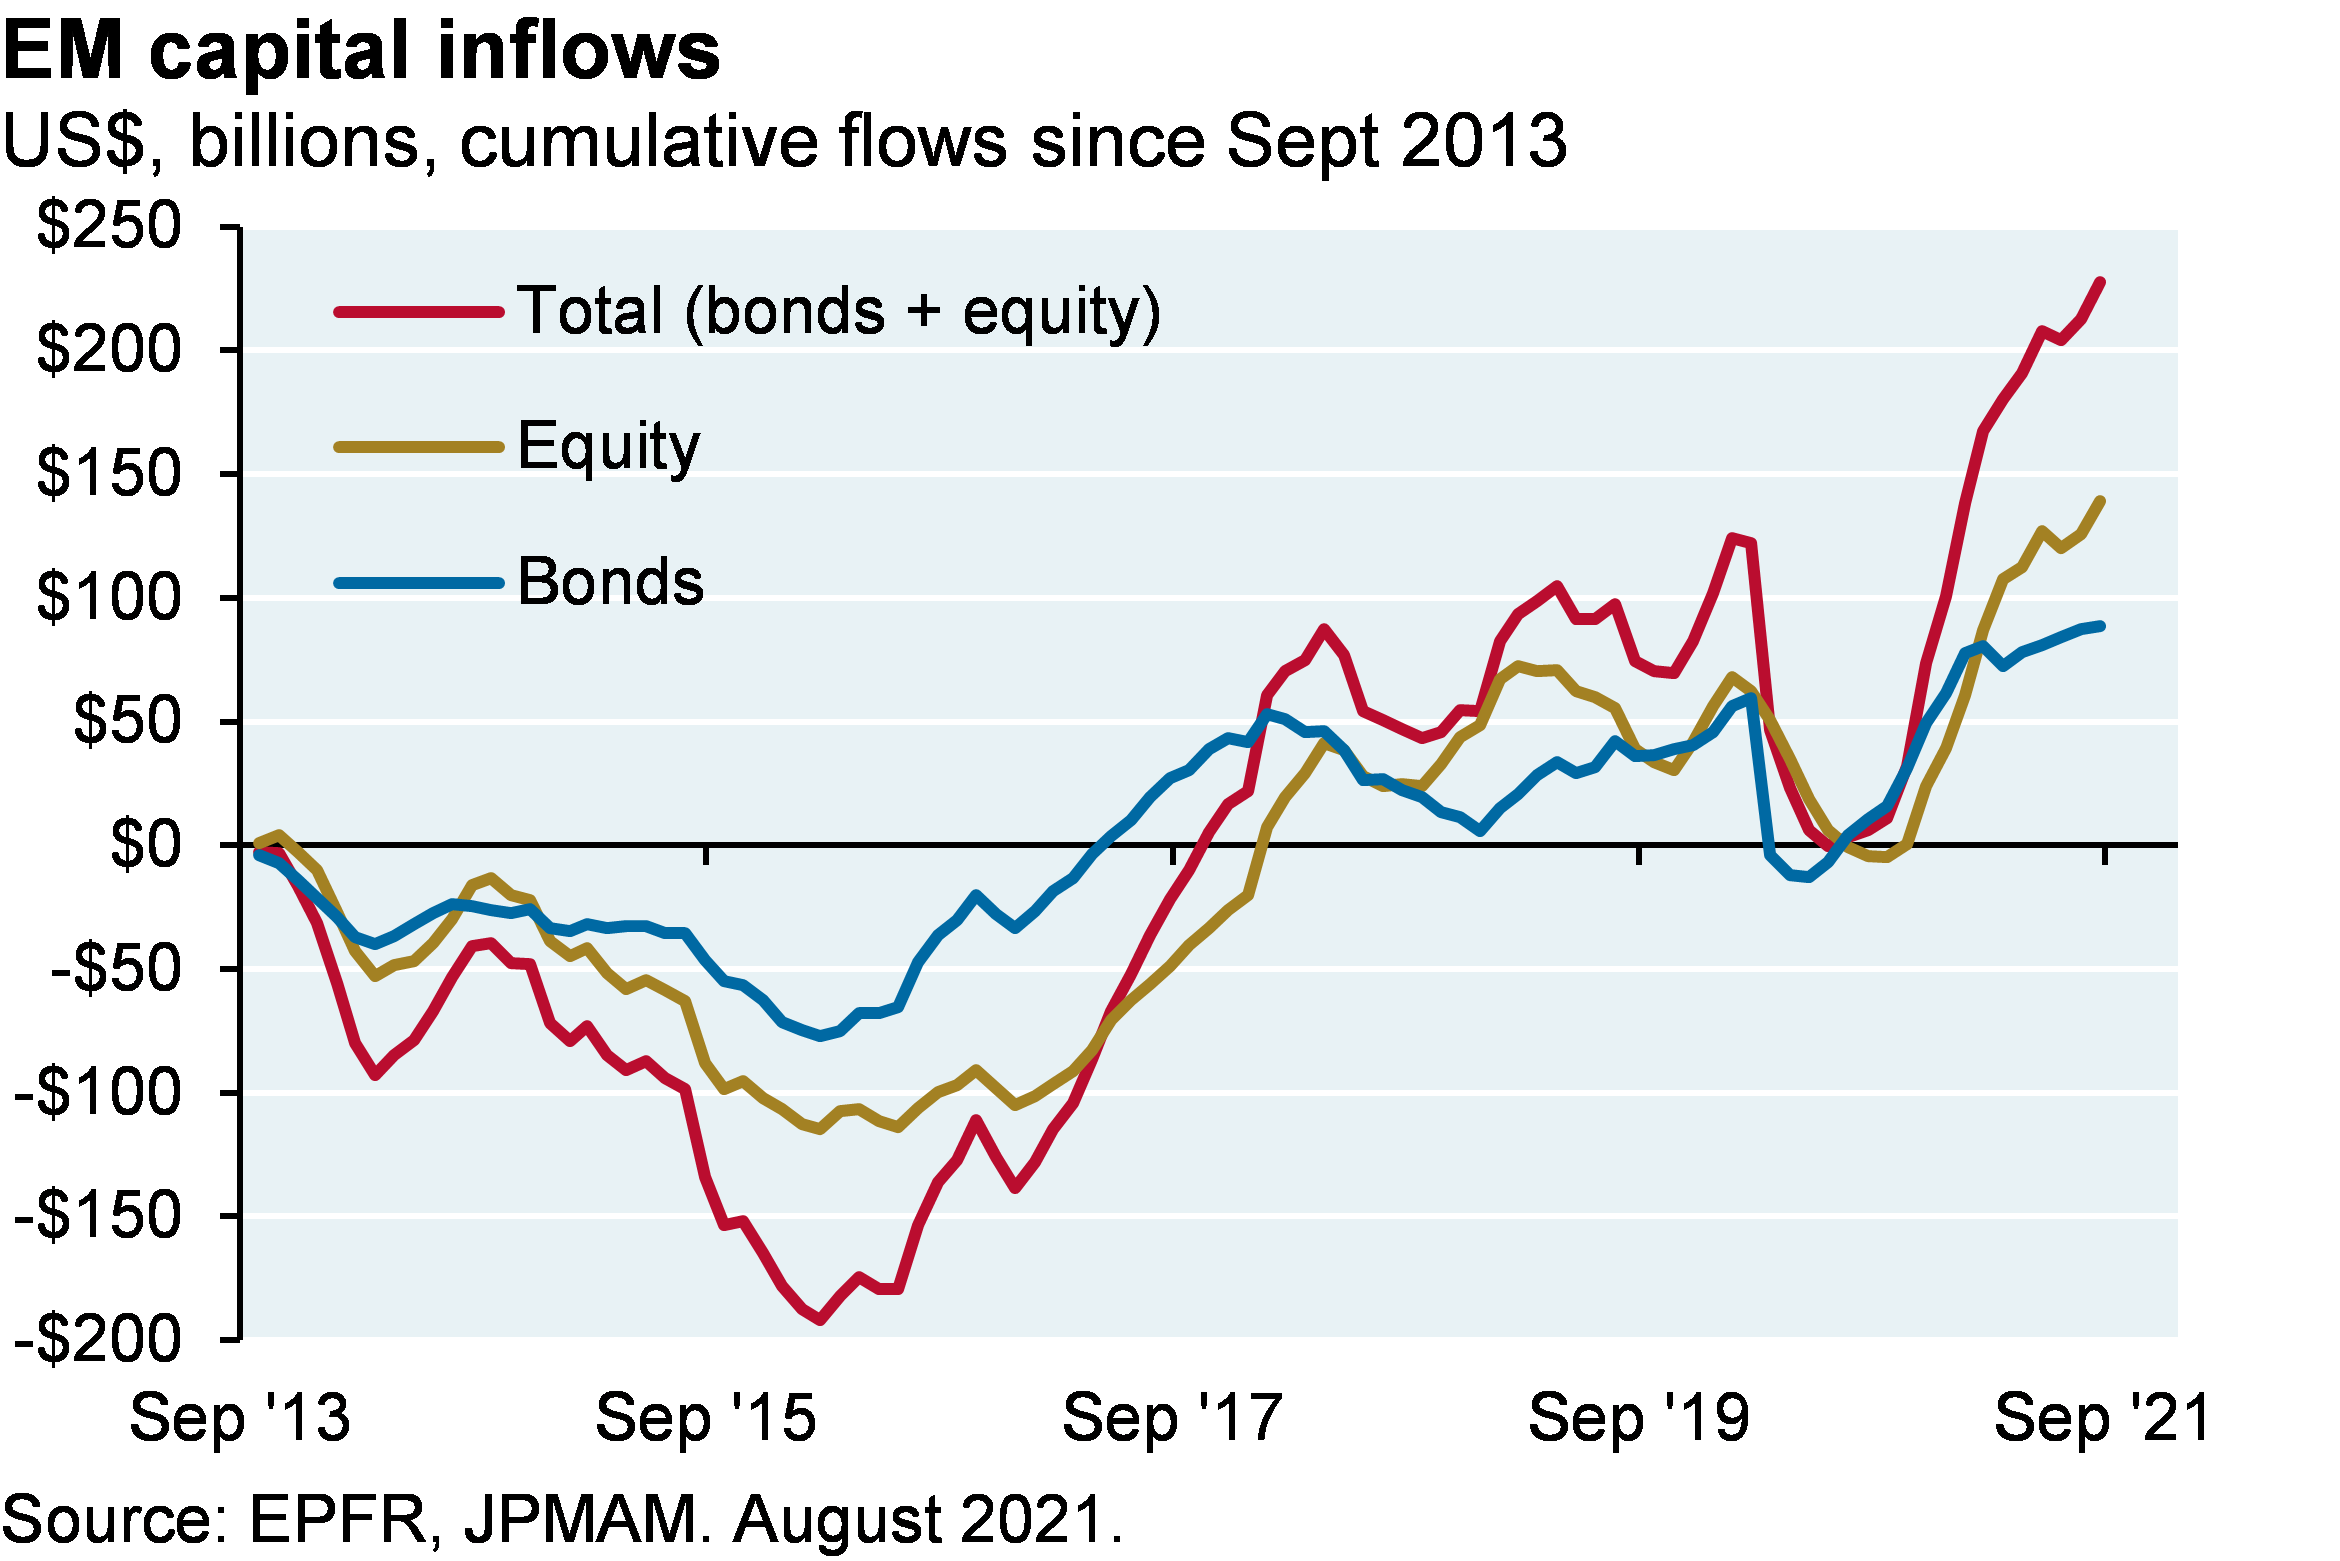
Some good news on Asia. As noted above, infections and mortality are finally rolling over. Vaccination rates have hit 70% in Malaysia; while they are still less than 50% in Indonesia, Thailand, Philippines and Vietnam, acquired immunity appears to be playing a role now as well. Furthermore, mRNA vaccines should make greater inroads in the entire region in 2022, displacing Chinese vaccines with lower observed efficacy3. Finally, capital flows are returning in anticipation of less severe bottleneck issues ahead.

Line chart shows daily COVID-19 deaths per million people for emerging market countries (Latin America, Eastern Europe, EM Asia and the Middle East). In the developing world, infections and mortality are declining.  This is the result of exhaustion of Lambda and Gamma variants in Latin America and the decline in the Delta variant in Asia (note that mortality is rising in Eastern Europe again).
Bar chart which shows vaccination rates by country. The chart illustrates the higher level of vaccination for developed countries relative to emerging market countries. Canada, France and South Korea have vaccination rates around 80%, whereas Vietnam, Indonesia and Philippines vaccination rates are closer to 30%.
Bar chart shows the Oxford lockdown stringency index levels for various countries. Many Emerging Market countries (in red) have higher COVID stringency requirements than developed countries, an indication of how seriously the governments themselves view the risks of the pandemic and the ability of their healthcare systems to respond to it.
Line chart shows capital inflows to emerging market countries since September 2013. In 2021, flows have been returning to the region in anticipation of less severe bottleneck issues next year.
Line chart shows index levels for US, UK and Eurozone manufacturing delivery times. All three locations show a steep increase in delivery times from September 2020 to now, starting at levels around 40-45 and dropping to 15-25, where smaller values indicate longer lead times.
Line chart shows index levels for Vietnam, India, China, South Korea and Brazil manufacturing delivery times. After recovering from small increases in lead times at the start of COVID, delivery times have not changed significantly for India, China and South Korea. Brazil demonstrated a larger increase in delivery times (around 10 at its worst), but has recovered to about 42. Vietnam is currently seeing a spike in delivery times to around 30, after having been between 40 and 50 for most of the period since January 2020.


Appendix: Homeowners vs Renters and US housing policy

  • As discussed in the "Bottleneck Resolution", the federal foreclosure moratorium has expired and there are safeguards in place which should keep the number of foreclosures low until early next year when a CFPB rule expires. The federal eviction moratoria are separate policies; some have already expired, while GSE and FHA versions will expire at the end of September. Eviction rules cover renters and homeowners, while foreclosure rules only apply to homeowners. Several Democratic Senators have introduced legislation to reinstate federal eviction moratoria after the Supreme Court ruled that the CDC overstepped its authority in mandating it

  • States can apply their own foreclosure and eviction moratoria alongside the federal government; banks are required to follow both. There are currently live foreclosure moratoria in NY, Oregon and DC

  • While federal eviction moratoria prohibited evictions of renters and homeowners, the treatment for missed payments is different. For example, delinquent renters at the end of the moratorium are treated differently than homeowners who missed payments while in a CARES Act forbearance. Homeowners with federally backed mortgages (or with mortgages from banks applying this approach to all borrowers at their discretion) are allowed to defer missed payments and are not considered to be delinquent. In these cases, homeowners that don’t pay will not face immediate payment of accrued balances, which in most cases will be added as a balloon at the end of their mortgages. Banks generally record unpaid interest as current on an accrual basis. Finally, there are programs in place to modify mortgages for borrowers unable to resume their prior payments due to financial distress.

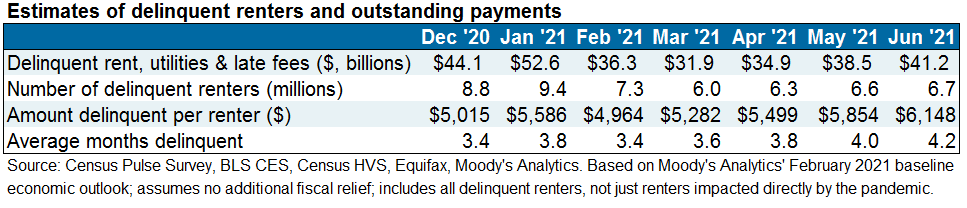
  • Renters, however, are not explicitly allowed to defer; the eviction moratorium simply prohibits landlords from evicting them for non-payment. Renters could face immediate payment of accrued amounts, with any negotiated terms up to the landlord. In addition, non-payment could affect a renter’s credit score, while the same is usually not the case with homeowners under the circumstances outlined above.

  • The Federal Emergency Rental Assistance program made $47 billion in funding available for tenants and landlords to be distributed by states and local governments. This funding was aimed at helping tenants cover rent, back rent and utilities as well as helping landlords cover mortgage payments. However, only $5 billion of this program was distributed as of July 2021.

  • The National Equity Atlas estimated that as of mid-August 2021, 15% of renters (5.9 million renter households) were behind on rent payments. This compares to ~7% of renters unable to pay rent in 2017.

  • Landlords who hold federally backed mortgages were eligible for the federal mortgage and foreclosure relief programs, which were extended through June 30, 2021.

  • In addition, some states established their own rental relief programs. For example, New York’s landlord loan program provides loans to small landlords with a loss of rental income, and California’s rental assistance program helps both tenants and landlords cover rent and mortgage payments at the expiration of the eviction and foreclosure moratorium

  • Line chart shows index levels for India, China, South Korea and Brazil manufacturing delivery times. After recovering from small increases in lead times at the start of COVID, delivery times have not changed significantly for India, China and South Korea. Brazil demonstrated a larger increase in delivery times (around 10 at its worst), Brazil has recovered to about 42.

1 “Estimating the Impact of Unemployment Insurance Benefit Expiration on Employment Using August Microdata”, Joseph Briggs, Goldman Sachs, September 16, 2021.

2According to a paper released by the Philadelphia Federal Reserve, 70% of the massive rise in fintech loans is simply due to regulatory arbitrage rather than fintech lenders having superior technology or lower costs. Also: shadow banks now control the riskiest segment of the market (FHA). You get what you pay for. See “Fintech, Regulatory Arbitrage and the Rise of Shadow Banks”, Buchak et al, NBER, 2017.

3"Ravaged by Delta outbreak, Southeast Asia shifts away from China’s vaccines”, Washington Post, August 10


Listen to Podcast

Video Player is loading.
Current Time 0:00
/
Duration 13:42
Loaded: 0%
00:00
Stream Type LIVE
Remaining Time -13:42
 
1x
    • Chapters
    • descriptions off, selected
    • captions settings, opens captions settings dialog
    • captions off, selected
    • en (Main), selected

    This is a modal window.

    Beginning of dialog window. Escape will cancel and close the window.

    Text
    Background
    Window
    Font Size
    Text Edge Style
    Font Family

    End of dialog window.

    This is a modal window. This modal can be closed by pressing the Escape key or activating the close button.

    This is a modal window. This modal can be closed by pressing the Escape key or activating the close button.

    Dude, Where’s My Stuff?

    09/27/2021

    The global supply chain mess will require increased vaccination and acquired immunity, semiconductor capacity expansion and the end of extraordinary housing/labor supports to resolve. A close look at some very anomalous charts on shipping, semiconductors, inventories, labor shortages, foreclosures and mortality.

    Show Transcript Hide Transcript

    FEMALE VOICE: 
    This podcast has been prepared exclusively for institutional, wholesale, professional clients and qualified investors only as defined by local laws and regulations.  Please read other important information which can be found on the link at the end of the podcast episode

    MR. MICHAEL CEMBALEST: 
    Good morning everybody.  This is the late September Eye on the Market podcast.  I’m recording this from a CEO event in Ennis, Montana.  It’s very beautiful here, but it’s not highly vaccinated.  All the CEOs are telling me more or less the same thing.  They intend to hire more people.  It’s very difficult to find people.  The COVID situation is making the challenges even greater.  And they’re all experiencing pretty substantial delays in the supplier delivery lays with respect to manufactured goods.  And this week’s Eye on the Market gets into this whole supply chain mess.  And one of the fascinating things about this is the attribution of these problems to the shipping cost discrepancies between eastbound and westbound freight. 

    So let me get into that a little bit, and this is on page two of the piece.  There was a surge in goods consumption in the United States when COVID hit, as everybody started building out home offices and doing home improvement projects, and overall just increasing their goods spending and drastically cutting back on their services spending.  So all of a sudden, global trade volume started to pick up just at the time that COVID was beginning to negatively impact all the workers and the supply chains in the U.S. and Asia.  

    And then the shipping thing started to kick in a few months ago, and this is kind of remarkable in an odd and unfortunately very concerning way economically.  There has been a giant surge in freight rates for container ships between Shanghai, from Shanghai to Los Angeles that hasn’t been matched by an increase of freight rates from Los Angeles back to Shanghai.  So what has that done, is create this weird economic incentive for container ship owners to move them back to China empty to accelerate the receipt of the eastbound freight rates, instead of waiting for U.S. goods to be loaded up so they can earn the westbound freight rates as well.  And so based on the latest data we’re seeing, the westbound freight rates from Los Angeles to Shanghai are below $2,000 or 40-ft. box.  The eastbound ones are above 12,000.  So I can see why that’s happening.  

    And we actually have a chart in here showing this giant increase in the container ships that are being, returning to Asia empty are now dwarfing the ones that are actually loaded.  This is messing up the supply chain in a lot of understandable ways, because as U.S. goods that were destined for export don’t leave the ports, they sit there and railcars and manufacturing sites and warehouses and dock areas are occupying the space that all of those containers ships waiting to unload into the U.S., they don’t have the space to do that.  So that’s one big aspect of the supply chain disruptions that have to do with these enormous shipping cost discrepancies. 

    And the other one, of course, is the semiconductor issue.  We talked about this a little bit last time, but just to go over a little bit of again, these chip shortages are related to the older and simpler 200-mm wafers, but they’re used in everything, cars, computers, laptops, refrigerators, washing machines.  These are the things that soared in terms of demand during the pandemic as people built out home offices, and the impact on auto manufacturers is kind of remarkable.  We have a chart in here that looks at the surge in manufacturer inventories and the collapse in dealer inventories as they’re waiting for the chips to come in to complete those vehicles and get them out for sale. 

    There’s limited economic incentive for people to build these new plants because the margins are so low, and there’s only a handful of new ones planned for 2022.  The good news is that there’s a few billion dollars being invested to expand capacity in the existing plants, in which case the semiconductor squeeze should start to ease a little bit by Q2 of next year.  And auto manufacturers are also discussing some long-term contracts with these tier two semiconductor suppliers that might incent them to build out some new capacity kind of the way an LNG export facility works.  It’s very hard to finance a multibillion dollar LNG export facility unless you’ve got pre-committed investment grade long-term contracts to help finance construction.  And increasingly, we might see that required to get new semiconductor capacity built. 

    And for all the clients that have always mentioned to me over the years their concerns about the political and economic problems associated with the rise of autonomous vehicles and lots of unemployed and angry truckers, I always tell them they’ve got it backwards.  The U.S. has had a trucker shortage for the last few years, and it’s projected to get much worse.  And so what’s happened here is that COVID has worsened some of the vulnerabilities in the U.S. supply chain, just as global goods trading is surging and people want more stuff instead of services. 

    So how does this get resolved?  This is one of the topics we spent a lot of time here on at this CEO gathering.  Well, the world is going to need more containers which carry more than 90% of the world’s traded goods, right.  So the world needs more of these containers.  Who comes to the rescue here?  Unsurprisingly, the Chinese get the benefit.  The Chinese companies affiliated with the Chinese government make up, I think 95% of the world’s container production market, and they’ve ramped up production. We’re also going to need more container ships in service.  Those are rising obviously more slowly.  They take time to build.  Who is going to benefit there?  China, the world’s largest ship builder.  I think they got 45% of all new shipbuilding orders in 2019.  Here are some more examples of how China continues to reap some unforeseen benefits from this COVID pandemic.

    But more containers and container ships aren’t going to solve the problems in the West unless some of the other supply chain issues are resolved as well that have to do with labor, and that’s probably going to require an end to extraordinary housing and income support measures and a lot less concern about COVID.  So far, most of the analyses that we’ve seen don’t show a big differential in job growth between states that terminated the employment subsidies and those that didn’t.  That may have to do with the fact that it hasn’t happened yet but it’s going to; it may have to do with the fact that the Delta variant is a bigger issue.  We don’t know yet.  

    That said, most of the forecasts we see call for around one-and-a-half to two million new jobs by the end of the year, due to some combination of expiring unemployment benefits and school reopening and less concerns about COVID.  So we’ll see.  And then on the foreclosure moratorium, those programs are also scheduled to end this fall.  Foreclosures collapsed once the moratorium was put in place, and so that’s also ending.  

    And so the bottom line is that U.S. and European housing and income policies may have to normalize before labor supplies do.  When you look, we have a chart in here that looks at G7 manufacturing wages rising at some incredibly rapid clip at a time when unemployment rates are still this high.  And then one last comment here.  It is interesting that some of the people that are arguing for endless extension of the COVID unemployment benefits are also arguing for the largest amount of new Congressional spending, like 3.5 trillion.  

    Without circling how all of that Congressional spending, what it might do to labor shortages, where are all these new workers supposed to come from, and how might that impact inflation and Fed policy?  In August, around half of all small business owners said they had job openings that they already couldn’t fill, which is the highest level on record, and that’s before people are suggesting $3.5 trillion worth of new Congressional spending.  


    So on the COVID side, the concerns may dissipate in the next few months.  We had a client webcast in August where we laid out our vision for the fall that was heavily influenced by research we’ve done, conversations that we had with epidemiologists and chief medical officers at the vaccine companies.  And what we laid out was okay, this is going to be a terrible fall in the U.S.  And so far it is.  The latest infection and hospitalization mortality data in the hot spot states, mostly in the Southeast, are terrible.  The U.S. has the highest reported mortality rate in the world in the southeastern United States. 

    But we also thought that, given the high degree of Delta-contagiousness, a combination of vaccination and acquired immunity would drive down these pandemic measures substantially by, let’s call it November.  It looks like we’re still on track there.  We’ve got a chart in here showing a pretty sharp rollover in infections and hospitalizations in the Southeast.  Mortality is still rising, and it is a terrible rate and all the things you read about the ICU are true, but given the lag times between infection, hospitalization, and mortality, you would expect the death situation to get a lot better in the next few weeks as well. 

    The biggest look to this outlook is the fading immunity of vaccinated people.  We just don’t have enough information on this yet.  We’ll know more over the next few months how this plays out.  It is clear that the booster shots in Israel are driving antibody levels up substantially.  And for all the people concerned about Pfizer’s very modest efficacy gap versus Modena, the booster shots in Israel are showing that the efficacy numbers for Pfizer go back well above 90%, which is where the Moderna numbers are.  So if you’re concerned about that gap, go get a booster shot. 

    The developing world situation is a little more nuanced.  First of all, infections and mortality are declining.  This is mostly the result of the exhaustion of the lambda and gamma variants in Latin America and the delta variant in Asia.  A lot of these countries have very high COVID stringency requirements, more so than, even more so than countries in the U.S. and Europe.  That said, they don’t appear to be the epicenter of supply chain problems, because when we look at the data on manufacturing delivery time delays, the data is much worse for the Euro zone and the U.S. than it is for India, China, South Korea, and Brazil.  We know that in places like Malaysia that there are some issues around semiconductors and other stuff, but most of the supply chain issues appeared to be developed market problems, and that’s why some combination of reduced COVID concern and income and policy, income and housing support policy normalization are going to be required to resolve this. 

    So when does that happen?  I think both of those things happen over the next few months, and we start to see an easing of supply chains in Q1 of next year, although I will say that based on the CEOs in attendance at this event, they were more thinking Q3 and Q4 of next year.  So we’ll see how that plays out, and we’ll update you in the future as to whether they were right or I was right.  Anyway, thanks for listening, and we’ll talk to you next time, bye.

    FEMALE VOICE:  Michael Cembalest’s Eye on the Market offers a unique perspective on the economy, current events, markets, and investment portfolios, and is a production of JP Morgan Asset and Wealth Management.  Michael Cembalest is the Chairman of Market and Investment Strategy for JP Morgan Asset Management and is one of our most renowned and provocative speakers.  For more information, please subscribe to the Eye on the Market by contacting your JP Morgan representative.  If you’d like to hear more, please explore episodes on iTunes or on our website. 

    This podcast is intended for informational purposes only and is a communication on behalf of JP Morgan Institutional Investments Incorporated.  Views may not be suitable for all investors and are not intended as personal investment advice or a solicitation or recommendation.  Outlooks and past performance are never guarantees of future results.  This is not investment research.  Please read other important information which can be found at www.JPMorgan.com/disclaimer-EOTM. 

    JP Morgan Asset Management
    • About us
    • Investment stewardship
    • Privacy policy
    • Cookie policy
    • Sitemap
    • Accessibility
    • J.P. Morgan

    • JPMorgan Chase

    • Chase

    Copyright 2025 JPMorgan Chase & Co. All rights reserved.

    This website is a general communication being provided for informational purposes only. It is educational in nature and not designed to be a recommendation for any specific investment product, strategy, plan feature or other purposes. By receiving this communication you agree with the intended purpose described above. Any examples used in this material are generic, hypothetical and for illustration purposes only. None of J.P. Morgan Asset Management, its affiliates or representatives is suggesting that the recipient or any other person take a specific course of action or any action at all. Communications such as this are not impartial and are provided in connection with the advertising and marketing of products and services. Prior to making any investment or financial decisions, an investor should seek individualized advice from personal financial, legal, tax and other professionals that take into account all of the particular facts and circumstances of an investor's own situation.


    Opinions and statements of financial market trends that are based on current market conditions constitute our judgment and are subject to change without notice. We believe the information provided here is reliable but should not be assumed to be accurate or complete. The views and strategies described may not be suitable for all investors.


    INFORMATION REGARDING INVESTMENT ADVISORY SERVICES: J.P. Morgan Asset Management is the brand for the asset management business of JPMorgan Chase & Co. and its affiliates worldwide. Investment Advisory Services provided by J.P. Morgan Investment Management Inc.


    INFORMATION REGARDING MUTUAL FUNDS/ETF: Investors should carefully consider the investment objectives and risks as well as charges and expenses of a mutual fund or ETF before investing. The summary and full prospectuses contain this and other information about the mutual fund or ETF and should be read carefully before investing. To obtain a prospectus for Mutual Funds: Contact JPMorgan Distribution Services, Inc. at 1-800-480-4111 or download it from this site. Exchange Traded Funds: Call 1-844-4JPM-ETF or download it from this site.


    J.P. Morgan Funds and J.P. Morgan ETFs are distributed by JPMorgan Distribution Services, Inc., which is an affiliate of JPMorgan Chase & Co. Affiliates of JPMorgan Chase & Co. receive fees for providing various services to the funds. JPMorgan Distribution Services, Inc. is a member of FINRA FINRA's BrokerCheck


    INFORMATION REGARDING COMMINGLED FUNDS: For additional information regarding the Commingled Pension Trust Funds of JPMorgan Chase Bank, N.A., please contact your J.P. Morgan Asset Management representative.


    The Commingled Pension Trust Funds of JPMorgan Chase Bank N.A. are collective trust funds established and maintained by JPMorgan Chase Bank, N.A. under a declaration of trust. The funds are not required to file a prospectus or registration statement with the SEC, and accordingly, neither is available. The funds are available only to certain qualified retirement plans and governmental plans and is not offered to the general public. Units of the funds are not bank deposits and are not insured or guaranteed by any bank, government entity, the FDIC or any other type of deposit insurance. You should carefully consider the investment objectives, risk, charges, and expenses of the fund before investing.


    INFORMATION FOR ALL SITE USERS: J.P. Morgan Asset Management is the brand name for the asset management business of JPMorgan Chase & Co. and its affiliates worldwide.


    NOT FDIC INSURED | NO BANK GUARANTEE | MAY LOSE VALUE


    Telephone calls and electronic communications may be monitored and/or recorded.


    Personal data will be collected, stored and processed by J.P. Morgan Asset Management in accordance with our privacy policies at https://www.jpmorgan.com/privacy.


    If you are a person with a disability and need additional support in viewing the material, please call us at 1-800-343-1113 for assistance.


    READ IMPORTANT LEGAL INFORMATION. CLICK HERE >


    The value of investments may go down as well as up and investors may not get back the full amount invested.


    Diversification does not guarantee investment returns and does not eliminate the risk of loss.


    Download the pdf