
Commodity strategies could help protect portfolios when both stocks and bonds are correcting amidst geopolitical risks, stickier-than-expected inflation, and inflation related cost shocks.
In brief
- Demand for gold has increased as central banks diversify their asset base, and investors seek out safe havens against rising geopolitical risk or as a hedge against unexpectedly higher inflation.
- Fundamentals for copper remain attractive as energy transition demand continues to gather pace.
- When the economy encounters inflationary-related cost shocks, commodity strategies could help protect portfolios when stocks and bonds are correcting.
There has been an unusually high level of divergence in performance amongst different commodities, with iron ore down 18.7% year-to-date while gold and copper are both up by 16.3%.
This divergence is likely driven by underlying demand fundamentals, but macro factors also play a key role. At a time when global central bank policies remain at the forefront of investors’ minds, gauging the direction of commodity markets may offer some foresight into the inflation and monetary policy direction.
Why are gold and copper rising while iron ore is falling?
Recent gold rally supported by structural factors
Gold continues to be viewed as a safe haven asset and portfolio diversifier, and it has received a lot of attention in the last couple of months. It has risen 16% year-to-date, making it one of the best performing global assets in that time frame, and setting new highs along the way.
Historically, gold prices have demonstrated periods of inverse relationship with real yields, i.e. the inflation adjusted interest rates. As gold itself does not generate interest income, real yields can be seen as the opportunity cost of holding it. When real yields go down, gold becomes more attractive relative to interest bearing assets such as fixed income assets and cash.
This inverse relationship has broken down lately as there have been shifts in the supply and demand dynamics, thereby keeping gold prices relatively resilient even during the recent rise in real yields:
- Demand for gold has increased as global central banks have been diversifying their asset bases, amid geopolitical tensions. Compared to the 469 tons average annual pace in the prior five years, global central banks and other quasi-official institutions (particularly sovereign wealth funds) increased their gold purchases significantly in the past few years (2022: 1,082 tons and 2023: 1,037 tons). Certain central banks with large exposure to U.S. dollar holdings also have increasing concerns about potential U.S. dollar weakness in the medium term, and have therefore decided to diversify towards gold. Meanwhile, emerging market central banks that historically had zero to very little allocations to gold, have also started to build their gold reserves.
- Investors are seeking out safe havens against elevated geopolitical risks, while trying to hedge against unexpectedly still sticky inflation.
- Solid retail demand for physical gold and jewelry from India and China, especially amid China’s sluggish property and underperforming equity market.
The recurring geopolitical tensions should continue to drive central bank diversification. Meanwhile, with the U.S. Federal Reserve still likely to cut rates as its next move, this should set the stage for further gold appreciation as real yields fall.
However, despite the recent outperformance in gold, investors should recognize the role of gold within their portfolios. As gold’s volatility has sometimes been as high as emerging market equities (see Exhibit 2), solely owning gold may not necessarily be the perfect hedge against volatility.
Exhibit 1: Commodity prices
Z-scores for the past five years, USD per unit

Source: CBOT, CME, CRB, Bloomberg, FactSet, LME, J.P. Morgan Asset Management. Commodities represented by appropriate Bloomberg Commodity sub-index priced in U.S. dollars. Aluminum and copper are priced on LME. Coal is the Newcastle Coal Closing Price (USD/t). Crude oil is Brent crude. Dutch Natural Gas is Dutch TTF Gas Monthly Near Term (NDEX EUR/mwh). Henry Hub Gas is Natural Gas Henry Hub Spot Price (USD/Mmbtu). Iron Ore is iron ore 62% Fe -Cost and Freight China Port. Other commodity prices represented by futures contracts. Z-scores calculated using daily prices over past five years. Past performance is not a reliable indicator of current and future results. Data reflect most recently available as of 30/04/24.
Exhibit 2: Commodity returns
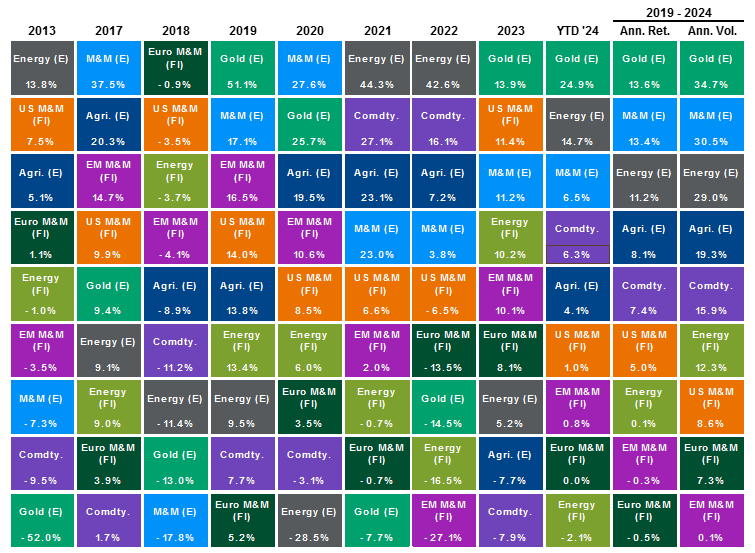
Source: Bloomberg, FactSet, J.P. Morgan Economic Research, MSCI, J.P. Morgan Asset Management. Based on Bloomberg Commodity Index (Comdty.); MSCI ACWI Select – Energy Producers IMI, Metals & Mining Producers ex Gold & Silver IMI, Gold Miners IMI, Agriculture Producers IMI (Energy (E), M&M (E), Gold (E), Agri. (E)); Bloomberg Global Agg, Credit – Corporate Energy Index (Energy (FI)); Bloomberg U.S. Agg. Credit – Corporate High Yield Metals & Mining Index (U.S. M&M (FI)); Bloomberg Euro Agg. Credit – Corporate Metals & Mining Index (Euro M&M (FI)); J.P. Morgan Emerging Market Corporate Credit – Corporate Metals & Mining Index (EM M&M (FI)). 5-year total return data used to calculate annualized returns (Ann. Ret.) and 5-year price return data used to calculate annualized volatility (Ann. Vol.), reflects the period 30/04/19 – 30/04/24. Past performance is not a reliable indicator of current and future results. Data reflect most recently available as of 30/04/24.
Copper demand underpinned by energy transition and AI
Other than gold, global copper demand growth continues to accelerate due to robust energy transition demand, particularly grid, electric vehicles (EV) and renewables. This has helped offset the weak “traditional” end uses, such as construction, manufacturing and appliances in developed economies like the U.S. and Europe.
According to Wood Mackenzie and UBS estimates, renewables (+900 kilotons (kt)) and EV (+300kt) added about 1.2 megatons (mt) to global copper demand in 2023, more than offsetting around 200kt contraction in demand from China construction sector and about 400kt contraction in demand from traditional end use sectors in the U.S. and Europe.
Looking ahead, EV and renewables, coupled with various additional applications including data centers to support the ongoing artificial intelligence (AI) development and EV charging stations, suggest copper demand for broader network infrastructure will further accelerate in the next few years, potentially offsetting the still subdued weakness in the Chinese real estate sector, while further attracting thematic investors to energy transition and AI to copper and copper miners.
The supply dynamics may also suggest more upside as copper mine supply growth expectations for this year have been cut back amid limited pick-up in new project pipelines and downbeat mine production guidance . The physical supply tightness and a protracted period of supply constraint will likely cause further copper price increases.
Iron ore fundamentals deteriorated on softer demand but stronger supply
Iron ore fundamentals stayed weak in 1Q24 on still-soft Chinese domestic steel demand. China is the largest consumer of iron ore, and Chinese imports of iron ore account for over 60% of the global iron ore trade. Iron ore is a key material in steel used for construction, and the subdued Chinese property sector remains a key drag.
On the supply side, the iron ore market is well supplied while it is set to continue expanding. Last year, shipments from the world’s two largest iron ore exporters, Australia and Brazil, outperformed remarkably. So far this year, exports are still holding up, running above historical averages. This trend has largely been driven by rising investments into new mine developments. Indeed, capital expenditure has risen four times since the 2017 lows, and should remain stable in the next few years.
This suggests we may not see sustained improvement in iron ore prices until the Chinese domestic steel demand picks up on better property market sentiment.
Investment implications
Commodities stand as a distinct asset class with returns that are largely independent of stock and bond returns. Hence, holding an allocation to commodities within an investor portfolio can help offer diversification benefits, potentially lowering the risk of an overall portfolio while boosting overall risk-adjusted returns.
In particular, as inflation volatility will likely remain higher in the near term, we continue to anticipate more volatility in the stocks/bonds correlation for the rest of this year. Commodities, especially energy, provide some protection against supply side shock in inflation, as we experienced in 2022 with the onset of the Russia-Ukraine conflict.
A less uniform negative stock/bond correlation reinforces the need to use different assets to diversify against various risks and/or economic weather. Fixed income will still be the key tool to diversify against recession/growth risks. However, when the economy encounters inflation related cost shocks, similar to what we are experiencing in the current juncture, and inflation remaining stickier than expected while geopolitical risks remain elevated, commodity strategies could help protect portfolios when both stocks and bonds are correcting.