Mid-Year Review | 2023
Adrian Tong
Jennifer Qiu

Introduction
After a very challenging 2022, there was much hope that 2023 would be a better year for investors. This is true to some extent, with both fixed income and equities generating modest returns year-to-date. The U.S. Federal Reserve (Fed) and most central banks around the world look to be approaching the end of their rate hiking cycles. China is emerging from the economic downturn brought on by the pandemic. For those investment ideas that have not gone to plan, it is worth looking at why and whether these views should be revised and adjusted. This includes the underperformance of Chinese equities relative to the U.S., as well as the fact that high-quality fixed income has yet to outperform high yield corporate debt.
In our 2023 mid-year outlook, we recap our views that have worked and those that have not yet played out as planned. We will share our latest outlook on the global economy and policy, and the implications for investors in the next 6-12 months. We hope this will help equip our clients with information to be factored in when considering asset allocation.
Where we got right…
Cash underperforming a diversified portfolio of equities and fixed income
We argued at the end of 2022 that cash cannot consistently outperform a diversified portfolio of bonds and equities. While many investors can generate a 3-4% annualized return from time deposits, a stock-bond portfolio has outperformed cash by 2.2 percentage points through the first five months of the year. Less demanding valuations across both equities and bonds was an important contributing factor. This helped prevent the repeat of 2022’s negative returns, especially for fixed income. As central banks may not be in a rush to cut rates aggressively in the next 6-12 months, cash could remain appealing. Nevertheless, we believe a diversified portfolio of stocks and bonds is still well placed to outperform cash, with a greater bias toward fixed income.
Cash underperformed a diversified portfolio of stocks and bonds
Exhibit 1: Asset class returns
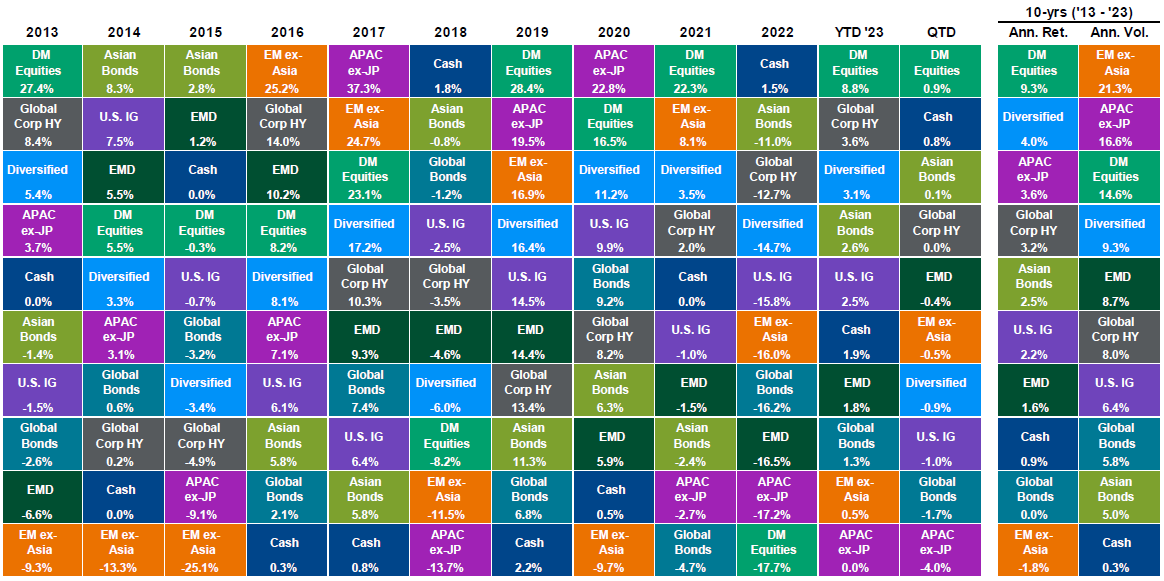
Source: Bloomberg Finance L.P., Dow Jones, FactSet, J.P. Morgan Economic Research, MSCI, J.P. Morgan Asset Management.
The “Diversified” portfolio assumes the following weights: 20% in the MSCI World Index (DM Equities), 20% in the MSCI AC Asia Pacific ex-Japan (APAC ex-JP), 5% in the MSCI EM ex-Asia (EM ex-Asia), 10% in the J.P. Morgan EMBIG Index (EMD), 10% in the Bloomberg Barclays Aggregate (Global Bonds), 10% in the Bloomberg Barclays Global Corporate High Yield Index (Global Corporate High Yield), 15% in J.P. Morgan Asia Credit Index (Asian Bonds), 5% in Bloomberg Barclays U.S. Aggregate Credit –Corporate Investment Grade Index (U.S. IG) and 5% in Bloomberg Barclays U.S. Treasury –Bills (1-3 months) (Cash). Diversified portfolio assumes annual rebalancing. All data represent total return in U.S. dollar terms for the stated period. 10-year total return data is used to calculate annualized returns (Ann. Ret.) and 10-year price return data is used to calculate annualized volatility (Ann. Vol.) and reflect data as of the latest month-end. Please see disclosure page at end for index definitions. Past performance is not a reliable indicator of current and future results. Diversification does not guarantee investment returns and does not eliminate the risk of loss.
Guide to the Markets – Asia. Data reflect most recently available as of 31/05/23.
The end of monetary policy tightening
Following the most aggressive synchronized tightening in decades, there are growing signs that global central banks are approaching the end of their hiking cycles. According to the U.S. Fed, inflation is coming down gradually. More importantly, high interest rates are exposing weaknesses in the deposit-asset mix of some of the small and mid-sized regional banks. This is, in turn, pressuring banks to tighten their lending standards, increasing the risk and potential severity of an economic recession. Hence, the Fed will need to enter 2H 2023 with a more balanced approach toward monetary policy and may need to consider cutting rates in late 2023 or early 2024 to maintain economic momentum.
Other developed and emerging market central banks are also approaching the end of their hiking cycles. The downside risk for these economies is arguably less significant, at least in the near term. The scope for rate cuts is also smaller.
China’s recovery
China’s economy rebounded in 1Q 2023, posting better than expected gross domestic product (GDP) growth of 4.5%. Unsurprisingly, consumption led the way after a sharp cutback in spending in 2022. That said, many would argue that this economic recovery is not complete. Business confidence is still cautious, leading to weak private business investment. The real estate sector has stabilized, but activities from construction to home sales are still significantly below 2021 levels. Monetary and fiscal policies are still supportive, facilitated by low inflation.
A weaker U.S. dollar
The U.S. Dollar (USD) Index was flat after losing 7.7% in 4Q 2022. With other developed market (DM) central banks bringing policy rates closer to the fed funds rate, the reduced interest rate advantage of the U.S. dollar relative to the major currencies had helped to adjust the overvalued greenback.
The USD remained on a depreciation path
Exhibit 2: U.S. dollar and interest rate differential
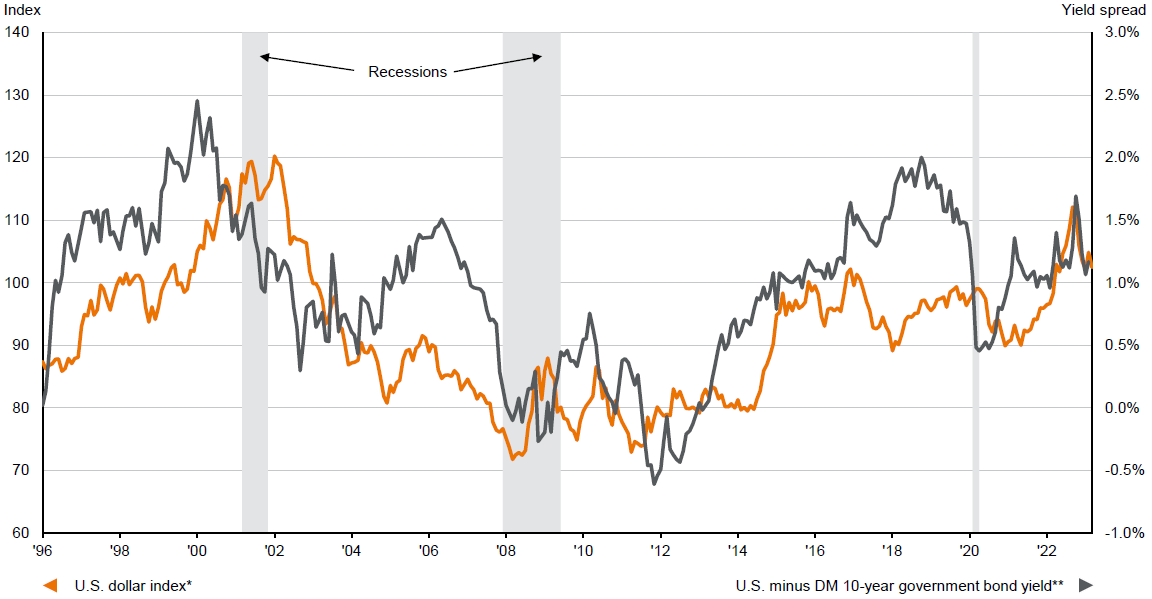
Source: FactSet, OECD, Tullett Prebon, WM/Reuters, J.P. Morgan Asset Management. *The U.S. dollar index shown here is a nominal trade-weighted index of major trading partners’ currencies. Major currencies are the British pound, Canadian dollar, euro, Japanese yen, Swedish kroner and Swiss franc.
**DM is developed markets and the yield is calculated as a GDP-weighted average of the 10-year government bond yields of Australia, Canada, France, Germany, Italy, Japan, Switzerland and the UK.
Past performance is not a reliable indicator of current and future results.
Guide to the Markets – Asia. Data reflect most recently available as of 31/03/23.
… and what has not worked out (yet?)
Underperformance of Chinese equities relative to the U.S.
At the start of the year, we argued that diverging growth prospects and policy rates between the U.S. and China should favor Chinese equities over their U.S. counterpart. The overall direction of earnings performance over the next 12-18 months also points to the same conclusion. As of the time of writing, this has not worked out. The MSCI China and CSI 300 indices were down 9% and 3.7%, respectively, versus the S&P 500, which rose 9.6% year-to-date (as of end-May 2023).
On a broader level, we can attribute this disappointing performance to two factors. First, investors question the sustainability of its economic recovery, especially in the absence of corporate investment and support from real estate market activities. This had resulted in earnings downgrades since the start of the year. Second, the ongoing geopolitical tension between the U.S. and China and has also to some extent deterred international investors from increasing their exposure to both onshore and offshore Chinese equities. Many international investors prefer to express their view on China and Asia’s economic reopening via European and Japanese markets.
Nevertheless, it is still worth noting some of the market dynamics beyond the index level. In China, state-owned companies have rallied on the back of the government’s drive to improve their financial performance. Year-to-date, banks, energy and telecom companies have outperformed. The technology sector, however, still has some ways to go to prove that it has fully overcome the regulatory headwinds from two years ago.
In the U.S., the stock market rally was essentially driven by a small number of mega cap stocks. Eight companies, mainly the mega cap tech companies, were responsible for over 90% of the gains in the S&P 500 Index in the first five months of the year. Investors had piled into large tech companies with steady profitability amid the softer economic backdrop. The fall in government bond yields also helped justify a higher valuation for these companies. That said, unprofitable companies were still penalized.
China underperformed relative to the U.S.
Exhibit 3: Global and Asia equity market returns
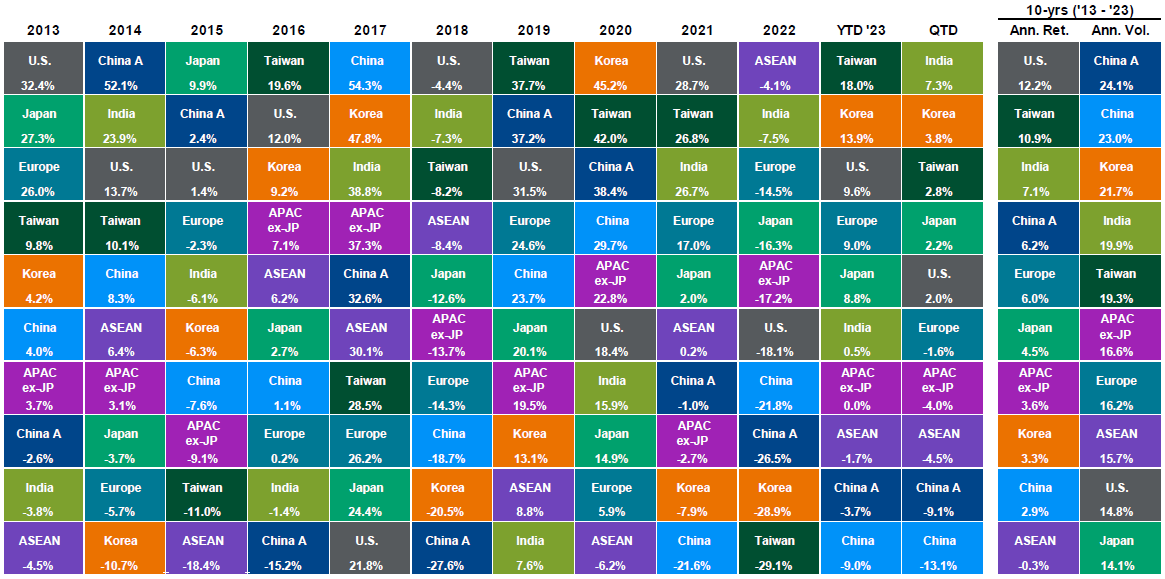
Source: FactSet, MSCI, Standard & Poor’s, J.P. Morgan Asset Management.
Returns are total returns in U.S. dollars based on MSCI indices, except the U.S., which is the S&P 500, and China A, which is the CSI 300 index in U.S. dollar terms. China return is based on the MSCI China index. 10-yr total (gross) return data is used to calculate annualized returns (Ann. Ret.) and annualized volatility (Ann. Vol.) and reflect data as of the latest month-end. Past performance is not a reliable indicator of current and future results.
Guide to the Markets – Asia. Data reflect most recently available as of 31/05/23.
High yield corporate bonds remained resilient against high-quality fixed income
Despite the rising risk of an economic recession in the U.S., U.S. high yield corporate debt marginally outperformed investment-grade debt year-to-date. Corporate credit spreads remain stable for both types of corporate bonds. The advantage of a higher coupon for high yield debt was partially offset by the decline in U.S. Treasury yields, to the benefit of investment-grade bonds. We believe at current levels, U.S. high yield credit spreads reflect a benign economic scenario, and the risk of further spread widening remains high.
U.S. high yield corporate bond remains resilient with steady credit spreads
Exhibit 4: Debt return composition
Last 6 months
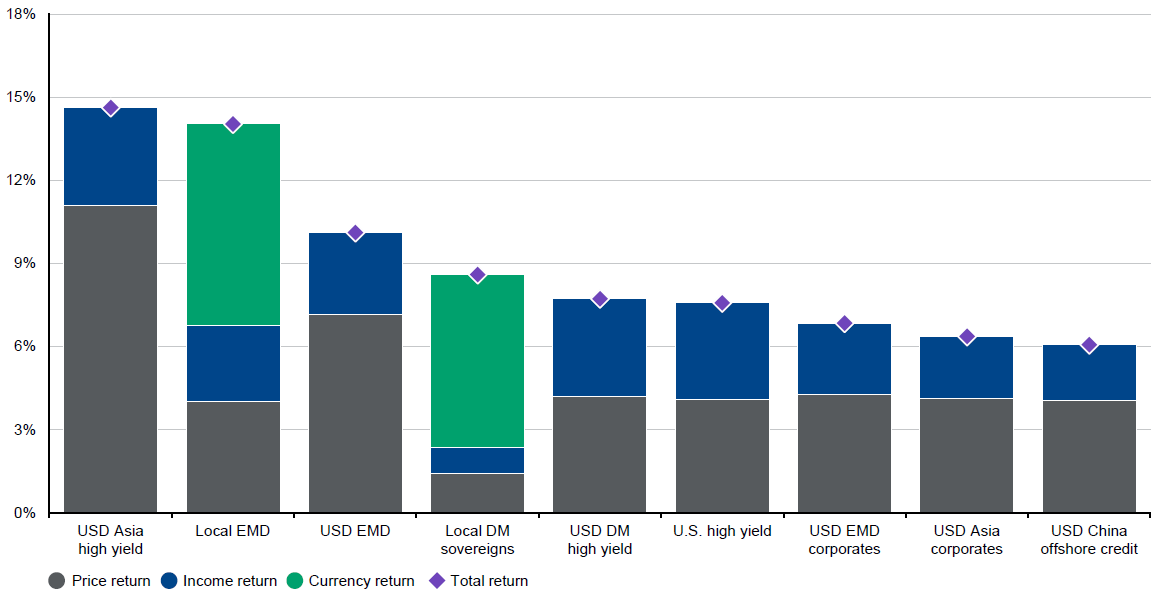
Source: J.P. Morgan Economics Research, J.P. Morgan Asset Management.
Based on J.P. Morgan Asia Credit High Yield Index (USD Asia high yield), J.P. Morgan CEMBI (USD emerging market debt (EMD) corporates), J.P. Morgan EMBI Global (USD EMD), J.P. Morgan Asia Credit Corporates Index (USD Asia corporates), J.P. Morgan Asia Credit China Index (USD China offshore credit), J.P. Morgan Developed Market HY Index (USD DM high yield), J.P. Morgan Domestic High Yield Index (U.S. high yield), J.P. Morgan GBI-EM Global Diversified (Local EMD), J.P. Morgan GBI-DM (Local DM sovereigns). Past performance is not a reliable indicator of current and future results.
Guide to the Markets – Asia. Data reflect most recently available as of 31/03/23.
Our economic and policy views in 2H 2023
Our latest view on the global environment remains largely similar to the start of 2023. In the U.S., high interest rates are putting more pressure on the economy, especially as it relates to corporate investments and the real estate sector. Consumer spending is likely to remain a resilient anchor for the economy given the steady job market. Banking sector stress could continue to be a headwind, and tighter constraints on lending could put further pressure on various economic pain points.
As a result, the Fed may need to reassess its interest rate policy and decide whether to reverse some of the tightening later this year. To fully quash inflationary pressure, the U.S. central bank may opt to maintain its current policy even if it leads to a mild recession. However, if the U.S. economy falls into a sharp contraction, for example, brought on by more severe banking sector stress, then the Fed would probably need to take more aggressive action to support the economy.
The risk to Fed policy is to keep rates high for longer
Exhibit 5: Federal funds rate expectations
Market expectations for the fed funds rate
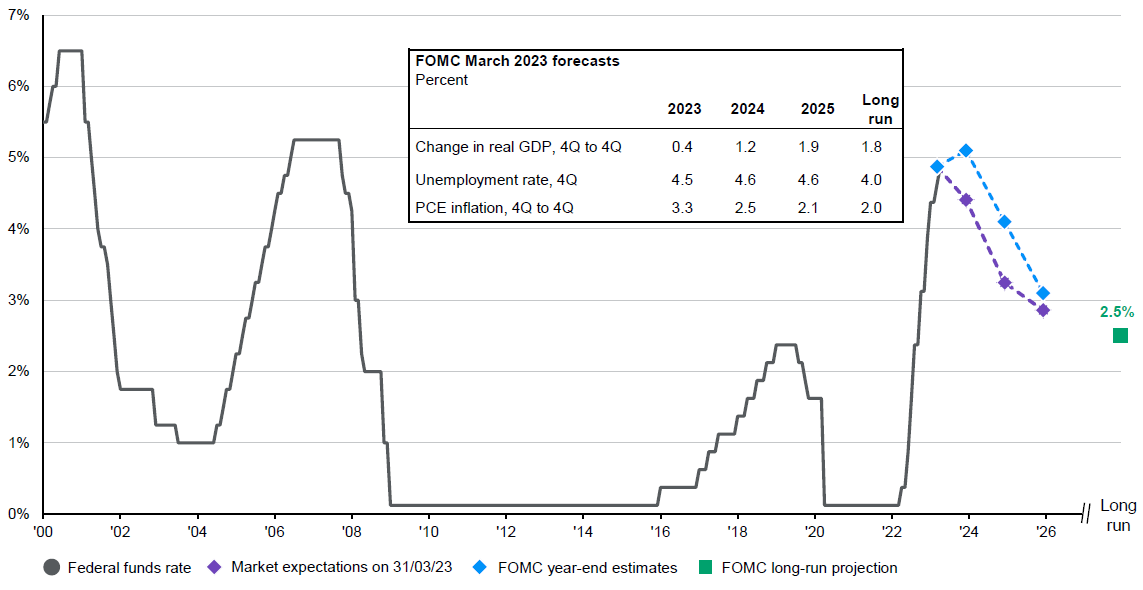
Source: Bloomberg L.P., FactSet, U.S. Federal Reserve, J.P. Morgan Asset Management.
Market expectations are derived from market implied policy rates as of 31/03/23. Federal Reserve projections shown are the median estimates of Federal Open Market Committee (FOMC) participants.
Guide to the Markets – Asia. Data reflect most recently available as of 31/03/23.
For China, the pace of recovery is modest. For a more robust recovery, it requires greater contribution from corporate investments and the housing market. Corporate investment is slowly improving with business confidence. However, the lack of demand from investors could be a drag on the recovery of the housing sector. Government reforms on state-owned enterprises, especially to boost financial performance to generate more shareholder value, are encouraging, but this will need to be robust enough to convince investors. We remain optimistic about sectors that would receive steady government support, such as renewable energy, electric vehicles, technology development, including artificial intelligence, and cloud computing. Additional policy stimulus could come for the service sector, as well as measures to boost jobs for the younger population.
For the rest of Asia, the export sector is likely to remain a weak point for much of this year given softening global demand. Consumer demand is improving. One question is whether the rebound from last year’s pandemic could lead to inflation pressure, despite energy and food prices being less of a problem than last year. A labor shortage is apparent in many Asian economies as the service sector reopens to consumers and tourists. This may persuade Asian central banks to stay with their high interest rate policies for longer.
China needs more growth support from corporate investment and a stronger job market
Exhibit 6: Fixed asset investment
Year-to-date, year-over-year change
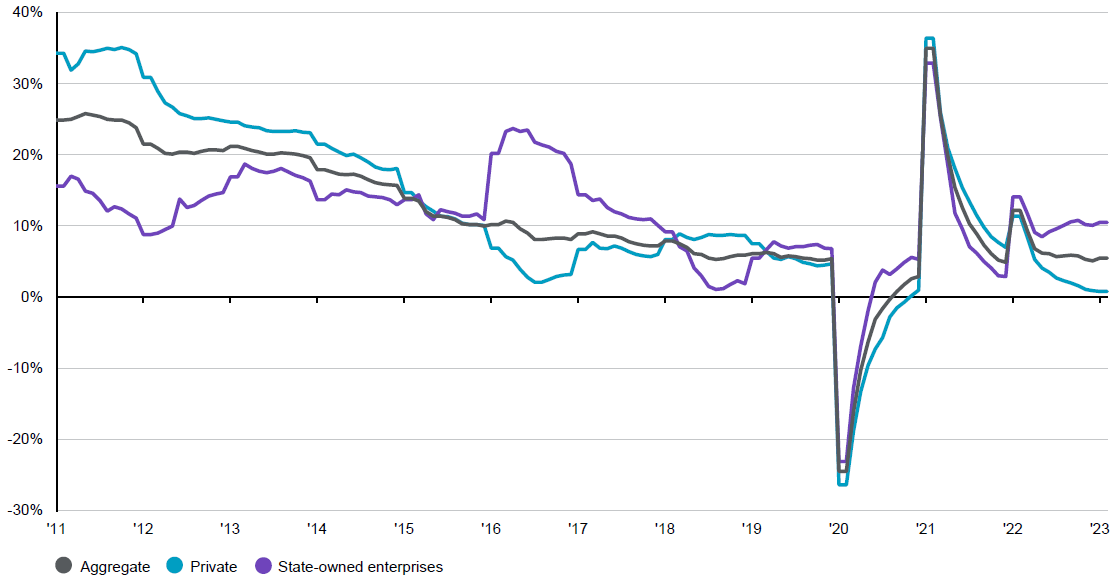
Source: CEIC, National Bureau of Statistics of China, J.P. Morgan Asset Management.
Guide to the Markets – Asia. Data reflect most recently available as of 31/03/23.
What could go wrong?
Amid our relatively benign view of the economic slowdown, we should still be mindful of some risk factors that could merit a different response from investors.
More severe U.S. banking sector stress or potential contagion to Europe and/or other regions
While U.S. regulators have been successful in containing the fallout from the failure of Silicon Valley Bank and First Republic, the high interest rate environment and a potential correction in the commercial real estate sector can still pose a challenge to regional banks in the U.S. This would exacerbate recession risk and force the Fed to pivot toward more aggressive monetary support to reduce the pressure on deposit outflows and reflate prices of securities held by banks.
Weak recovery momentum in China
As mentioned earlier, a rebound in consumption has largely underpinned China’s economic recovery. Business confidence needs to improve in order to boost the job market and fixed asset investments. If this turning point fails to appear, then China could face a sharper loss in growth momentum in late 2023, which would in turn adversely impact corporate earnings. In this case, the Chinese government could opt to step up fiscal stimulus. On monetary policy, the central bank could cut rates or the reserve requirement ratio, but the impact on boosting lending may not be very effective if demand for loans (from businesses) and the appetite to lend by banks remain weak.
A tepid rebound in the property market could continue to limit land sales and construction activities. Sluggish land sales would also constrain local government revenue growth and infrastructure investment.
Ratcheting up of geopolitical tensions
Geopolitics continue to pose considerable uncertainty in the outlook for the global economy and financial markets. The Russia-Ukraine conflict has entered its second year, and the impact on the energy and food markets has largely stabilized. Energy and gas prices are likely to be depressed by the prospects of weaker global growth. However, if the U.S. and European governments strengthen the enforcement of financial sanctions and look to close some of the loopholes of Russian energy exports, this could tighten supply and push prices higher, renewing inflationary pressure.
The relationship between China and the U.S. is likely to stay tense, in our view. The election in Taiwan in January 2024 and the U.S. presidential and congressional elections later in November 2024 could present a series of tests for Beijing and Washington in managing cross-straits relationship. This could lead to a more cautious attitude among U.S. and European investors, even if the Chinese economy succeeded in achieving a more comprehensive and sustainable economic and earnings recovery.
Sequencing matters and stay agile
Although we have maintained the view of staying defensive by focusing on high-quality fixed income since last year, we believe investors should not lose sight of the opportunities when the U.S. economic cycle shifts from contraction to an early stage of recovery.
As we approach a Fed-induced slowdown, we continue to prefer fixed income to equities. Against the risk of widening credit spreads amid an economic recession, we believe government bonds and investment-grade corporate bonds should show greater price stability relative to corporate bonds with lower credit ratings. For equities, the divergence in growth performance could imply stronger returns for China and Asian stocks with greater exposure to domestic demand. In the U.S., current valuations seem consistent with a steady growth environment, which we believe is a little optimistic. We continue to prefer high-quality companies with more resilient earnings amid weakening growth and healthy balance sheets.
The role of income remains important as growth struggles in developed economies. Assets that generate consistent income and cash flow for investors should be well supported. In addition to high-quality fixed income, defensive sector equities with high dividend payouts could be a useful option for portfolios.
Looking further ahead, winter does not last forever. The equity rally during the recovery phase of the U.S. economic cycle has historically outperformed the mid-cycle, late-cycle and contraction phases. The recovery phase tends to coincide with a rotation from defensive sectors to cyclical sectors, such as industrials, consumer discretionary and financials. Asian markets with greater export exposure, such as Taiwan and South Korea, should benefit from the turnaround in earnings expectations. While developed markets, such as Europe and Japan, are highly connected with the U.S. economy, valuations in these markets tend to be less demanding. In the case of Japan, upward growth momentum in domestic demand, and structural reforms to improve shareholder returns could lure investors to further diversify their international holdings.
Historically, high yield corporate debt tends to outperform government bonds and investment-grade corporate debt during the recovery phase, driven by comparatively higher yields and additional capital gains arising from corporate credit spread tightening.
Amid rising expectations of central banks cutting rates and the potential bottoming out of leading economic indicators, we believe the rotation from the contraction phase of the economic cycle to the early-stage recovery phase might be triggered. For leading economic indicators, we continue to closely monitor business confidence data including the Institute for Supply Management (ISM) manufacturing index and the Conference Board Leading Economic Index.
Downside risk to growth calls for high quality fixed income, but eventual recovery allows for stocks to outperform again
Exhibit 7: U.S. economic cycle and asset performance
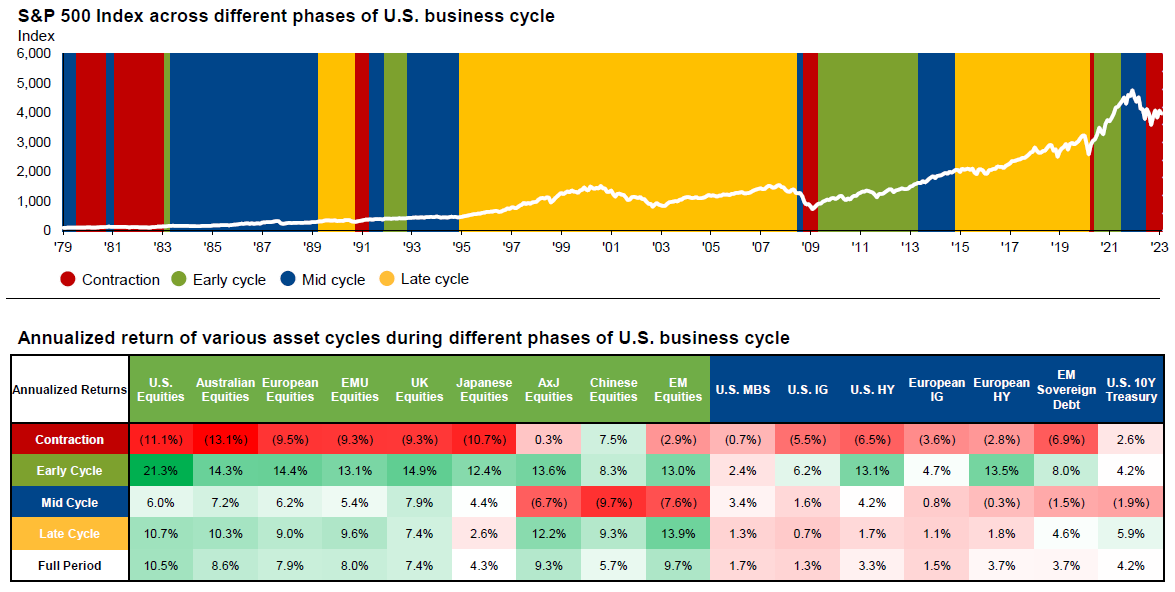
Source: Bloomberg L.P., J.P. Morgan Asset Management.
Regime analysis inception date: 31/01/78. K-Means Clustering applied to monthly data points of the following U.S. economic indicators – Core PCE Inflation, Private sector financial balance as a % of GDP, Consumer confidence, ISM manufacturing new orders, Unemployment rate, OECD composite leading indicator. Latest data as of 28/02/23. Monthly return analysis inception date: 31/01/93 for all assets except for AxJ Equities and EM Equities (start date: 31/01/01), EM Sovereign Debt (start date: 28/02/02), European IG (start date: 31/07/98), European HY (start date: 26/02/99). Local returns are used. Past performance is not a reliable indicator of current and future results.
Guide to the Markets – Asia. Data reflect most recently available as of 31/03/23.
094n230906070017

Tai Hui
Managing Director,
Chief Market Strategist, Asia Pacific

Marcella Chow
Executive Director,
Global Market Strategist

Kerry Craig
Executive Director,
Global Market Strategist

Agnes Lin
Executive Director,
Global Market Strategist

Shogo Maekawa
Executive Director,
Global Market Strategist

Chaoping Zhu
Executive Director,
Global Market Strategist

Ian Hui
Vice President,
Global Market Strategist
Tai Hui
Managing Director,
Chief Market Strategist, Asia Pacific
Marcella Chow
Executive Director,
Global Market Strategist
Kerry Craig
Executive Director,
Global Market Strategist
Agnes Lin
Executive Director,
Global Market Strategist
Shogo Maekawa
Executive Director,
Global Market Strategist
Chaoping Zhu
Executive Director,
Global Market Strategist
Ian Hui
Vice President,
Global Market Strategist