
Climate change policies may lead to one of the largest redeployments of investment and capital.
An energy revolution is underway: governments have committed to net zero targets and more recent concerns about energy security and high prices are increasing pressure on governments to speed up the energy transition.
We have already discussed the dramatic shift that will be required in every sector of our economy to meet these targets. Commodities and their producers will be at the centre of this transition. Much of the focus so far has been on energy companies managing the decline in demand for fossil fuels. Yet enormous demand is being created for the metals and minerals needed to build renewable energy infrastructure and electric vehicles (EVs).
In this piece, we explore scenarios to estimate the size and speed of this increasing demand, the impact of corporate behaviour on supply and the resulting outlook for commodity prices. This massive, multi-year impact on commodities from the clean energy transition will present compelling opportunities for investors who want to position their portfolios to benefit from journey to net zero.
The resources powering the energy transition
The resource requirements of a renewable energy ecosystem differ profoundly from a fossil fuel system. In contrast to coal- or gas-fired power plants, solar panels and wind parks require no fuel to operate but need significantly more materials: replacing a coal-fired power plant with offshore wind power generation requires six times the amount of mineral commodities (copper, zinc, nickel, chromium and rare earths); for a gas plant it’s 13 times more. Building solar capacity is less resource intensive but it still consumes three times more minerals than building coal plants. In addition, building new gridlines to connect the world’s electricity supply and demand will require significant amounts of copper and aluminium. While replacing fossil-fuelled power generation with clean energy will reduce demand for coal and gas, it fundamentally changes our power generation from a fuel-intensive to a materials-intensive system.
The transition from combustion engines to battery-driven vehicles shows a similar pattern. Compared to a conventional vehicle, an EV requires six times as many minerals, namely lithium, nickel, cobalt, manganese and graphite, which are critical commodities for battery production (Exhibit 1).
Exhibit 1: Minerals used in vehicle production
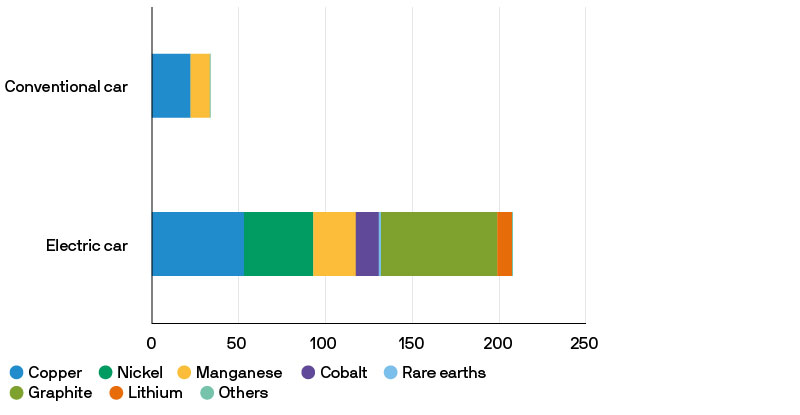
Source: IEA, J.P. Morgan Asset Management; The intensities are based on NMC 622 cathode and graphite anode. Actual consumption can vary depending on battery technology choice. Data as of 31 December 2021.
Estimating the speed of the transition to size the demand
In addition to materials intensity, the speed of the transformation is crucial for estimating future commodity demand. Although competing demands on policymakers can influence the outcome, even the most conservative growth scenario for clean energy assumes that current policy trends continue. In this lower-bound scenario, global renewable generation capacity for electricity production is expected to increase 50% by 2030. By the end of the decade the share of renewable-generated electricity production is expected to rise to 19.2% from 14.8% in 2018.
The rate of change in the automotive market is even faster, although uncertainty around which battery chemistry will prevail in the next 10 years slightly complicates the projection for materials demand. Already, annual sales for EVs and plug-in hybrids have doubled to 6.8 million vehicles in 2021 vs. the prior year (Exhibit 2) and are expected to quintuple to 19 million units by 2030 as legislation and subsidies from policymakers around the world come into effect. For example, the EU is targeting a 55% reduction of CO2 emissions of new cars by 2030 and the end of the combustion engine by 2035; China is pursuing a 50% market share goal for new energy vehicles (NEVs) by 2035; in the US, the EPA finalised tougher greenhouse gas standards that require a 28.3% reduction in emissions through 2026. Based on these assumptions demand for critical metals is forecast to increase close to 70% by 2030 even in this most conservative scenario.
Exhibit 2: Annual electric car sales
Millions
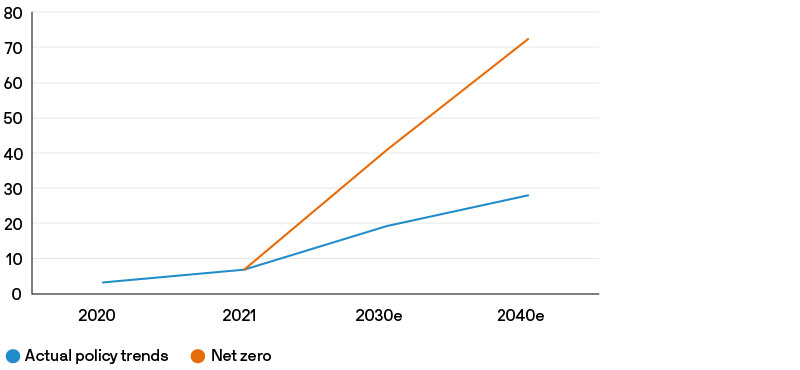
Source: EV-volumes.com, estimates from IEA, J.P. Morgan Asset Management. Data as of 15 February 2022.
But going forward, policy makers will likely push for an accelerated transition to clean technologies because at the current trend renewables will only compensate for the expected additional electricity demand, while carbon emissions remain stable. An ideal net zero scenario with more ambitious carbon emissions reduction targets marks the upper bound of growth estimates in the energy transition and EV revolution. The International Energy Agency (IEA) estimates an additional USD 1.3 trillion in investment globally may be required by 2030 to align with the Paris Climate Agreement goals. The share of solar and wind in the energy mix should increase at a much faster pace, to 48% by 2030.
In a net zero scenario, the phaseout of the combustion engine is pulled forward and EV sales are expected to jump to 40 million in 2030 and over 70 million in 2040; this needs to be supported by substantial investment to build more than 200 million charging stations by 2030, according IEA estimates, which will consume a significant amount of copper. In this scenario, demand for critical metals could increase close to 110% by 2030.
In summary, speed matters: depending on the acceleration of the clean technology transition, demand for critical minerals could rise between 70% and 110% by 2030, on top of the 50% increase in the past decade (Exhibit 3).
Exhibit 3: Total demand for critical minerals by scenario
Mt (megatonnes)
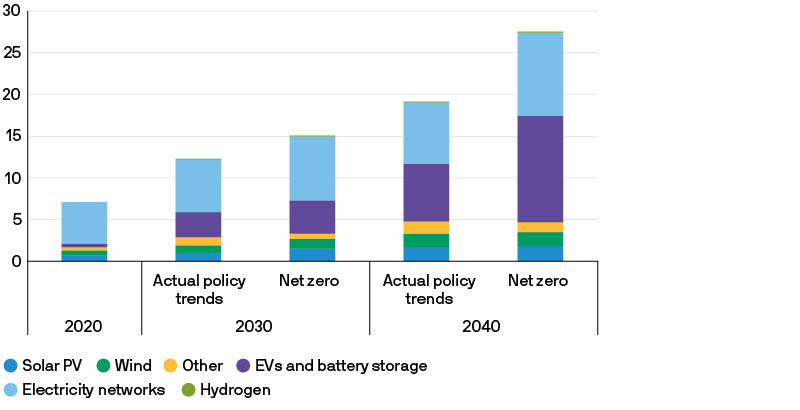
Source: IEA, J.P. Morgan Asset Management. Data as of 31 December 2021.
The impact of corporate behaviour on supply
The good news is that global reserves of critical minerals are large enough to cover the resource needs of the global transition to carbon neutrality. The crucial question is whether mining companies can cope with this massive increase in demand over the next 10 years.
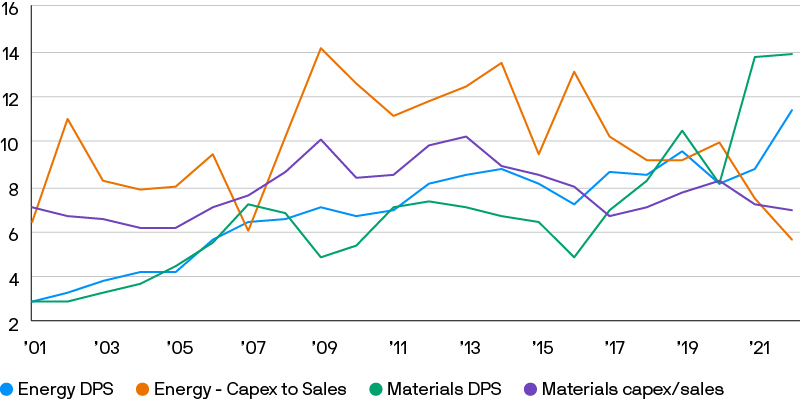
A concerning observation is that commodity companies reduced their investments relative to sales in recent years. Exhibit 4 shows that historically there was a positive correlation between investments in new projects (capex) and cash distribution to shareholders. The last commodity bull market between 2004 to 2012 featured strong demand, rising prices and rich earnings. Commodity producers invested heavily in new projects and also raised dividends, but when all the projects went live, markets were oversupplied and the bull marked ended. Companies then cut back investment and dividends until the pricing environment improved again during 2013 to 2016.
Exhibit 4: Capex-to-sales and dividends of the energy and materials sectors in MSCI ACWI
Ratio of last-twelve-months (LTM) capex to LTM sales in %, and dividend per share in USD
Source: Bloomberg, MSCI, J.P. Morgan Asset Management. Past performance is not a reliable indicator of current and future results. Data as of 31 December 2022.
But since 2017, dividends have risen and capex has stalled. We see several reasons for this change in corporate behaviour. First, after the last supercycle, balance sheets of many resource companies were highly levered due to high investment activity and expensive acquisitions, leaving managements eager to reduce the debt load. Second, the Paris Agreement tightened environmental regulation and increased public and investor awareness about the environmental damage of exploration and extraction. As a result, the managements of mining and energy companies now prefer to distribute corporate cash flows to shareholders rather than to invest in new projects that risk regulatory scrutiny and public backlash.
What does this mean for the supply outlook? Muted investment activity is jeopardising the future supply of critical minerals because it takes three to 10 years to develop a lithium mine and five to 15 years for copper, nickel and other industrial metals. So, the capex shortfall of the past four years could translate to a supply shortfall between 2025 and 2030. In the short term, the most critical commodity markets look sufficiently supplied. But even in the lower-bound scenario for demand growth, several critical commodities, such as copper, nickel, cobalt and lithium, are expected to be in short supply at the end of the decade. If policymakers implement more ambitious net zero strategies, several commodity markets could move into deficit within three years.
Outlook for commodity prices and investor implications
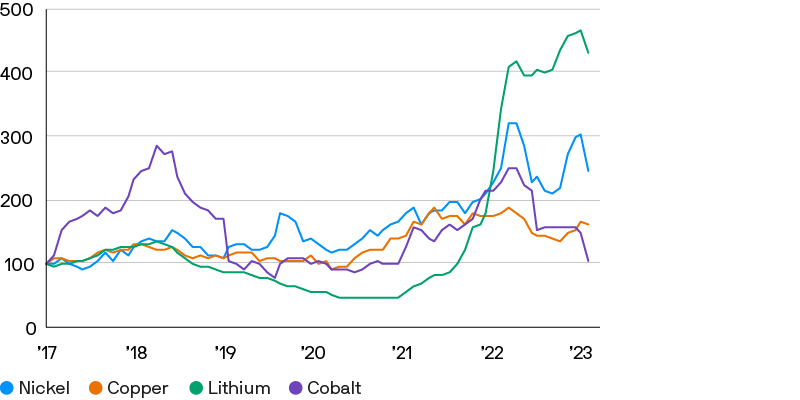
Even the most conservative demand acceleration scenario will be a significant tailwind to commodity prices in the coming years. Spot prices in industrial metals have already been rising in recent years (Exhibit 5). We believe the clean technology transition is igniting a new supercycle in critical commodities, with natural resource companies emerging as winners.
Exhibit 5: Price development of critical minerals for clean energy
Index level, rebased to 100 at December 2016
Source: Bloomberg, J.P.Morgan Asset Management, Past performance is not a reliable indicator of current and future results.
Data as of 28 February 2023.
There is some irony in mining companies as winners in a greener future. Basic materials account for 15% of global greenhouse gas emissions and mining operations often cause significant harm to the environment. From a broader environmental, social and governance (ESG) standpoint there can also be broader health and safety, and corruption, concerns in some areas of the industry.
Clearly, the mining industry is part of the carbon emissions problem but also part of the solution. We believe corporate engagement and dialogue can narrow the gap between the structural shortcomings of the industry and the desired sustainable outcome and is more productive than outright exclusion. Encouraging mining companies and their suppliers to switch from fossil fuels to green electricity can significantly reduce their carbon footprint. Many listed companies already pay attention to sustainability goals and have begun to change their behaviour accordingly.
Conclusion
In summary, climate change policies may lead to the largest peacetime redeployment of investment and capital. Businesses across the whole clean technology supply chain should structurally benefit from this trend. Just as the market is pricing in a massive disruption in the global auto industry valuations in the mining sector at eight times earnings do not look demanding. A new commodity supercycle could underpin a secular shift in the global economy, and an equally seismic rotation in equity markets from growth towards value companies.