
JPAM_logo
  • My collections
    View saved content and presentation slides
  • Logout
  • Funds

      Fund Listing

      • All Funds
      • Fund Explorer
      • Fund Distribution
      • Fund Documents

      Capabilities

      • Equities
      • Fixed Income
      • Multi-asset
      • ETF Investing
      • Alternatives
      • Active research

      Featured Funds

      • Equity High Income Strategies
      • China Equity High Income Fund
      • Asia Equity High Income Fund
      • Global Equity High Income Fund
      • Fixed Income Solutions
    • Insights

        Market Insights

        • Market Insights Overview
        • Guide to the Markets

          The J.P. Morgan Guide to the Markets illustrates a comprehensive array of market and economic histories, trends and statistics through clear charts and graphs.

        • Weekly Market Recap

          Start each week with J.P. Morgan Asset Management’s one-page snapshot of top headlines, market performance, chart of the week and more.

        • On the Minds of Investors

          What investment questions are on the minds of investors? Explore the questions investors ask frequently and find answers at J.P. Morgan Asset Management.

        • Podcasts

          Insights from Tai Hui, Chief Market Strategist, Asia, on what is happening in financial markets, from our Asia Pacific headquarters in Hong Kong.

        • Mid-Year Outlook 2026

          Global uncertainties abound: the Middle East conflict, central banks' response to returning inflation, U.S. policy shifts and the fast-changing AI landscape.

        • Multimedia

          Interviews with Fund Managers and Investment Strategists bring you insights on global market trends and investment news.

        • Guide to Alternatives

          Objective insights on alternatives industry trends, with charts and data across private equity, private credit, real estate, infrastructure and hedge funds.

        Portfolio Insights

        • Portfolio Insights Overview
        • Fixed Income

          We highlight themes and implications from various fixed income teams to help guide your portfolio decisions.

        • Long-Term Capital Market Assumptions

          Our Long-Term Capital Market Assumptions (LTCMAs) deliver forward-looking return, volatility and correlation estimates for 200+ asset and strategy classes in 20+ base currencies.

        • Global Asset Allocation Views

          Amid resilient growth and a fading energy shock, we stay positive on risk assets, favoring U.S., Japan and EM equities and U.S. high yield.

        • Global Fixed Income Views

          Central bank credibility, solid profits, capex and resilient consumers lift expansion odds to 85%, outweighing inflation and AI headwinds.

        • Alternative Insights

          We bring you insights based on our nearly 50 years of experience investing in alternatives and more than 800 alternatives professionals around the globe.

        ETF Insights

        • ETF Insights overview
        • Guide to ETFs

          Explore J.P. Morgan Asset Management’s ETF investing guide with insights on ETF market trends and best investing practices for smarter portfolio decisions.

      • Investment Ideas
          • All Investment Ideas
          • What's new
          • Retirement and long-term investing
          • Sustainable investing
          • ETF knowledge
        • Resources
            • All Resources
            • Announcements
            • Forms & Literature
            • Investment Glossary
            • Library
            • Insights App
            • WhatsApp Communication
          • About Us
              • About us
              • Awards
              • Diversity, Opportunity and Inclusion
              • Our Leadership Team
              • Spectrum: Our Investment Platform
              • Our Commitment to Research
            • Partner With Us
            • Language
              • English
              • 中文/ Chinese
              • My collections
                View saved content and presentation slides
              • Logout
            • Login
            Log in
            You are about to leave the site Close
            J.P. Morgan Asset Management’s website and/or mobile terms, privacy and security policies don't apply to the site or app you're about to visit. Please review its terms, privacy and security policies to see how they apply to you. J.P. Morgan Asset Management isn’t responsible for (and doesn't provide) any products, services or content at this third-party site or app, except for products and services that explicitly carry the J.P. Morgan Asset Management name.
            CONTINUE Go Back
            1. JPMorgan Multi Income Fund

            Important information
            JPMorgan Multi Income Fund
            1. The Fund invests in a diversified portfolio of income-producing equities, bonds and other securities. The Fund will primarily invest (at least 70%) in debt and equity securities. The Fund will have limited RMB denominated underlying investments.
            2. The Fund is therefore exposed to a range of investment related risks which includes risk related to dynamic asset allocation strategy, debt securities (including investment grade bond risks, below investment grade/ unrated invest risk, credit risk, interest rate risk, sovereign debt risk and valuation risk), asset backed securities, mortgage backed securities, collateralised loan obligations and asset backed commercial papers, equity, real estate market (associated with the risk of investing in REITs and other property related securities; direct investment in real estate is not permitted), emerging markets, concentration, currency, derivatives, liquidity, hedging, class currency, currency hedged classes and Eurozone sovereign debt crisis. For RMB hedged class, risks associated with the RMB currency and currency hedged classes risks. RMB is currently not freely convertible and RMB convertibility from offshore RMB (CNH) to onshore RMB (CNY) is a managed currency process subject to foreign exchange control policies of and restrictions imposed by the Chinese government. There can be no assurance that RMB will not be subject to devaluation at some point. The Manager may, under extreme market conditions when there is not sufficient RMB for currency conversion and with the approval of the Trustee, pay redemption monies and/or distributions in USD.
            3. Where the income generated by the Fund is insufficient to pay a distribution as the Fund declares, the Manager may at its discretion determine such distributions may be paid from capital including realised and unrealised capital gains. Investors should note that the payment of distributions out of capital represents a return or withdrawal of part of the amount they originally invested or from any capital gains attributable to that original investment. Any payments of distributions by the Fund may result in an immediate decrease in the net asset value per unit. Also, a positive distribution yield does not imply a positive return on the total investment.
            4. Investors may be subject to substantial losses.
            5. Investors should not solely rely on this document to make any investment decision.
            Expand

            GOING ACROSS THE SPECTRUM OF BONDS & EQUITIES FOR A ROBUST INCOME PORTFOLIO

            Which is why JPMorgan Multi Income Fund invests flexibly across different asset classes and markets globally to seek out a diverse range of compelling income opportunities in a changing world.

            Fund details
            Fund highlights

            HPHero_MIF_1200x676

            WhatsApp communication of J.P. Morgan Asset Management

            Exclusive for financial advisors in Hong Kong. Sign up today to learn about key market insights and relevant investment strategies.

            Join now

            WhatsApp_AEM_HPhero_1200x676

            SEEKING INCOME AS RATE HIKES LOOM

            Most investors are intensifying their search for more attractive income prospects as they are likely to face another year of negative real cash returns in 2022, or possibly longer. 

            As illustrated in the chart, real yields stood at -3.14% while inflation was 4.58%, as of 16 December 2021. As inflationary pressure is building up in certain regions, some central banks are considering raising rates, albeit gradually.

            Increasingly, investors are looking for a wider range of assets that can generate enough income so that their overall portfolio’s purchasing power is not eroded by inflation. 

            Interest rates and inflation
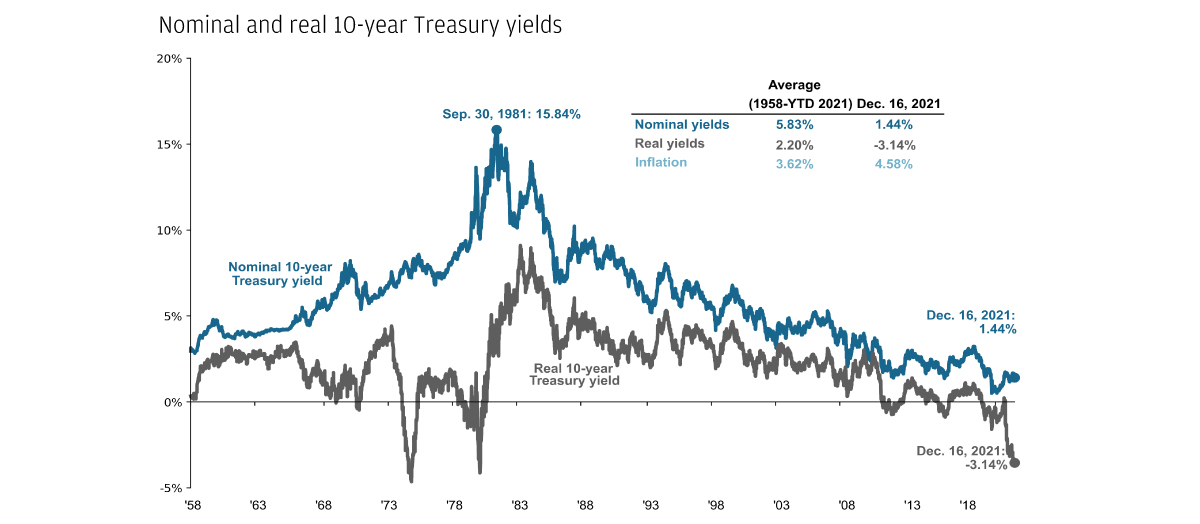
            Source: U.S. Bureau of Labor Statistics, FactSet, Federal Reserve, J.P. Morgan Asset Management. Real 10-year Treasury yields are calculated as the daily Treasury yield less year-over-year core CPI inflation for that month except for December and November 2021 where real yields are calculated by subtracting out December 2021 year-over-year core inflation. Data are as of 16.12.2021.

            WHY INVEST IN THE JPMORGAN MULTI INCOME FUND?



            Proven results: return and income

            The Fund has delivered proven results since its inception:
            USD (mth) Class1 has achieved

            Cumulative return (since launch) of

            59.3%2

            Annualised yield of

            5.63%3

            1. Aim at monthly distribution. Dividend rate is not guaranteed. Distributions maybe paid from capital Refer to important information 3.


            Find out more on the JPMorgan multi income fund
            Record of performance Diversified income sources Active management
            Record of performance

            Keeping the key objectives of yield, risk and return in mind, we seek to generate attractive risk-adjusted income for investors through different market cycles.

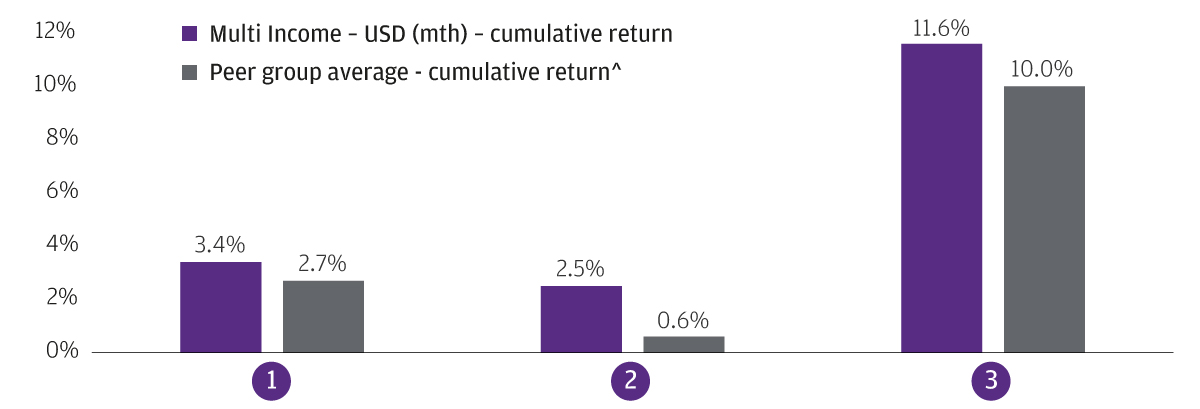
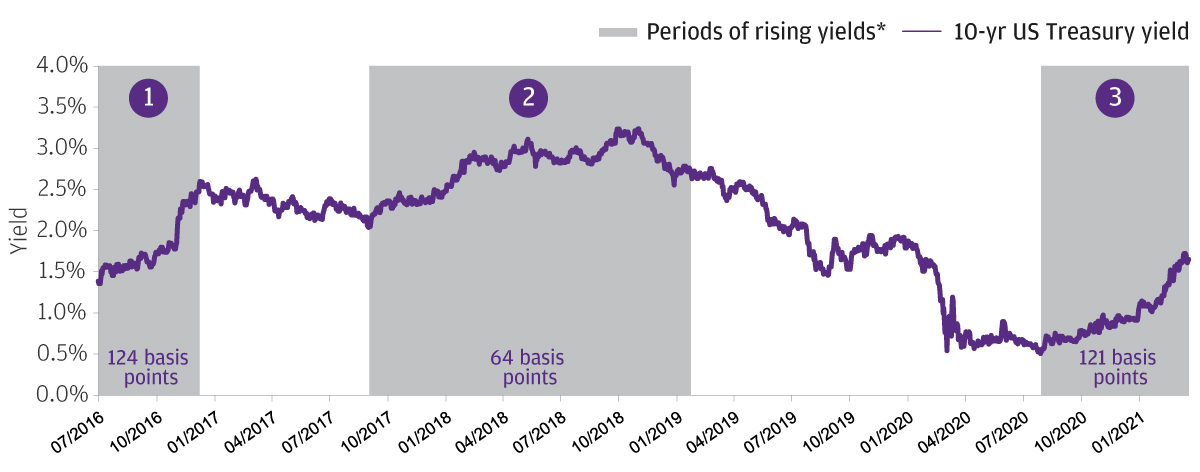
            The portfolio has demonstrated the benefits of diversification through flexible asset allocation, outperforming peers in the various rising rate periods in the past five years, as illustrated in the chart below.

            Our Fund's performance during rising rate periods
            Fund Performance 2

            Source: J.P. Morgan Asset Management, Bloomberg. *Methodology is based on daily data. A ‘rate rise’ is defined as a 50 basis points (bps) increase in the US Treasury 10-year yield. Periods of rising rates: (1) 08.07.2016 to 15.12.2016; (2) 07.09.2017 to 30.01.2019; (3) 04.08.2020 to 21.03.2021. Fund return refers to USD (mth) class return, NAV to NAV in USD with income reinvested. Calendar year return: 2016 +7.4%; 2017 +10.6%; 2018 -5.0%; 2019 +14.8%; 2020 +4.7%; 2021 YTD as of 31.12.2021 +9.1%. Past performance is not a reliable indicator of current and future results.
            ^ Source: Morningstar, Inc, USD Moderate Allocation Category of HK SFC authorised funds (as of 21.03.2021, NAV to NAV in USD with income reinvested). SFC authorisation is not a recommendation or endorsement of a scheme nor does it guarantee the commercial merits of a scheme or its performance. It does not mean the scheme is suitable for all investors nor is it an endorsement of its suitability for any particular investor or class of investors.

            Diversified income sources

            INCOME FROM DIVIDENDS

            The global economic recovery continues and the fundamental picture for global dividends look cyclically attractive as economies around the world reopen and pent-up consumer demand is materialising, supporting corporate earnings.

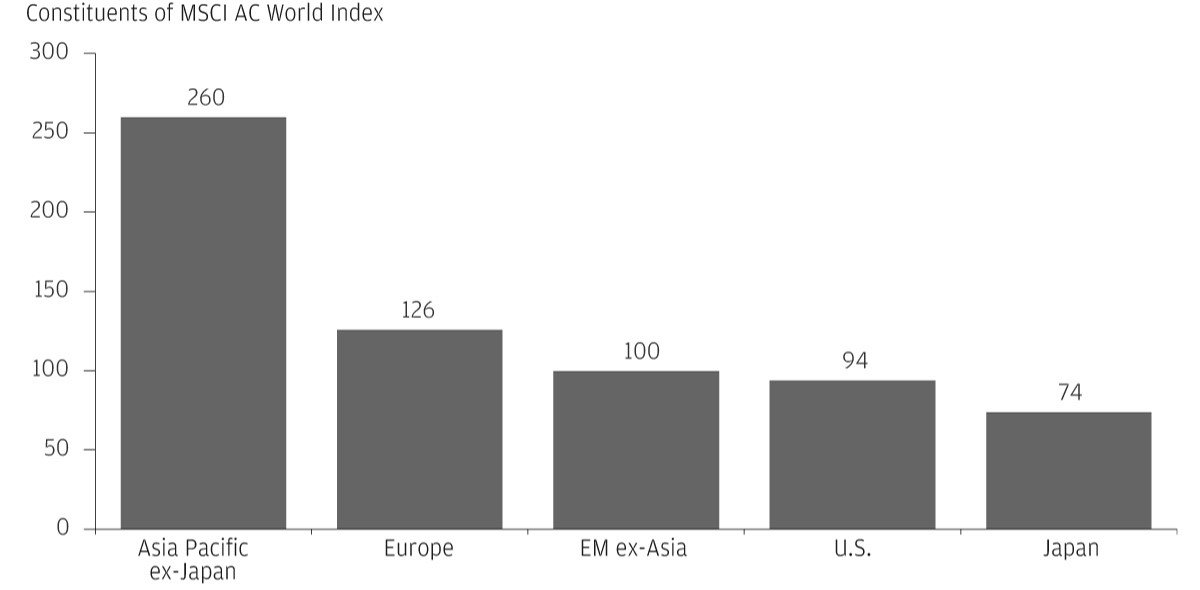
            Quality equities could offer attractive opportunities of dividend income, as illustrated in the chart below.

            Number of companies yielding greater than 3% by region
            Companies 3% Yield

            Source: FactSet, MSCI, J.P. Morgan Asset Management. EM refers to emerging markets. Past performance is not a reliable indicator of current and future results. Yield is not guaranteed. Positive yield does not imply positive return. Provided for information only to illustrate macro trends, not to be construed as research or investment advice. Investments involve risks. Not all investments are suitable for all investors. Data reflect most recently available as of 30.09.2021.


            INCOME FROM YIELDS

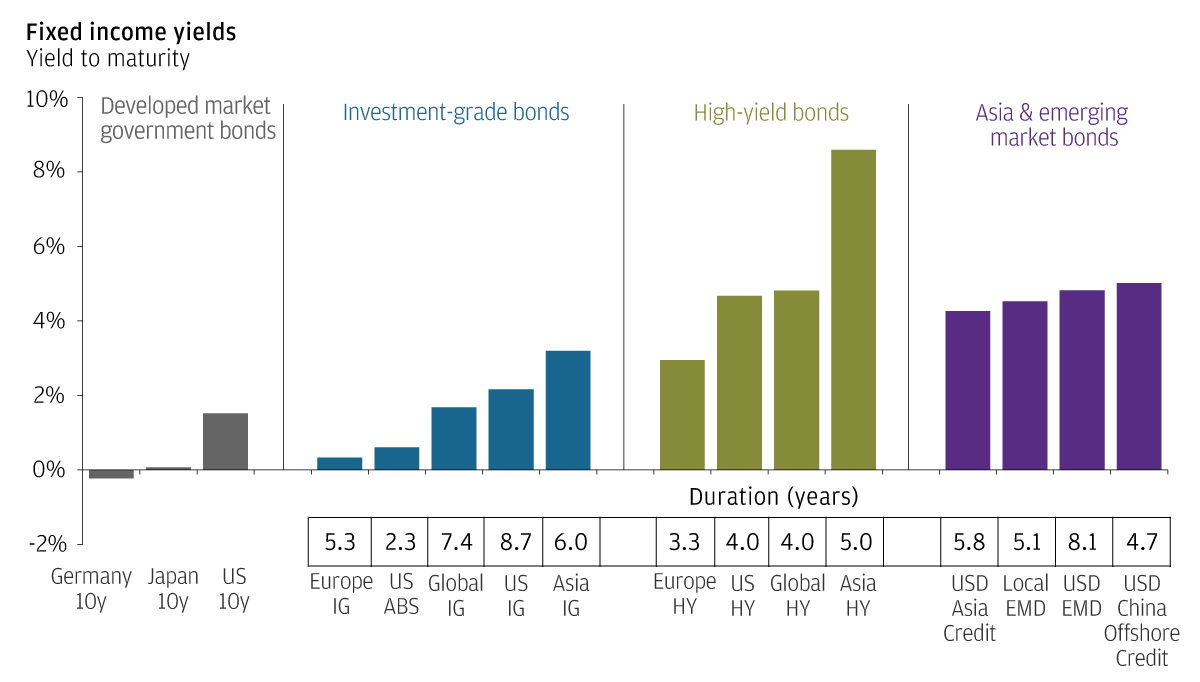
            Additionally, fixed income assets with high-yielding potential like high-yield bonds continue to be a relatively attractive source of income, as illustrated in the chart below. For example, Europe high-yield bonds can present potential diversification benefits and they also have shorter duration.

            In fixed income investing, duration is a gauge of interest rate risk, showing how bond prices will likely change when interest rates move. As the movement of interest rates can have a significant impact on an income portfolio, managing duration is crucial for both alpha generation and risk management4. 

            Global fixed income yields and duration
            Global Fixed Income Yield

            Source: Barclays, Bloomberg Finance L.P., FactSet, ICE BofA Merrill Lynch, J.P. Morgan Economic Research, J.P. Morgan Asset Management. Based on Bloomberg Barclays US Aggregate Credit – Corporate Investment Grade Index (US IG), Bloomberg Barclays Euro Aggregate Credit – Corporate (Europe IG), J.P. Morgan Asia Credit Investment Grade Index (Asia IG), Bloomberg Barclays Global Aggregate – Corporate (Global IG), Bloomberg Barclays US Aggregate Credit – Corporate High Yield Index (US HY), Bloomberg Barclays US Aggregate Securitized – Asset Backed Securities (US ABS), Bloomberg Barclays Pan European High Yield (Europe HY), J.P. Morgan Asia Credit High Yield Index (Asia HY), ICE BofA Global High Yield (Global HY), J.P. Morgan GBI-EM (Local EMD), J.P. Morgan EMBI Global (USD EMD), J.P. Morgan Asia Credit Index (JACI) (USD Asia Credit), J.P. Morgan Asia Credit China Index (USD China Offshore Credit). Duration is a measure of the sensitivity of the price (the value of the principal) of a fixed income investment to a change in interest rates and is expressed as number of years. Yields are not guaranteed, positive yield does not imply positive return. Past performance is not a reliable indicator of current and future results. Data reflect most recently available as of 30.09.2021.


            INCOME FROM HYBRID ASSETS

            Other hybrid assets such as preferred equities are also generally higher in the capital structure compared with common stocks. Such assets are also generally supported by the strong fundamentals in financials and robust capitalisation of banks5, which comprise the majority of preferred equities.

            Active management

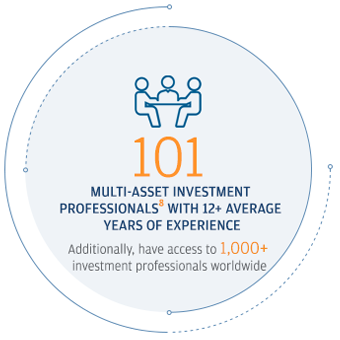
            Drawing on 50+ years of experience in multi-asset investing as a team, we dynamically allocate across geographies, asset classes, market capitalisation and capital structures, striving to provide investors with a consistent and attractive income stream and the opportunity for capital growth in a truly diversified portfolio.

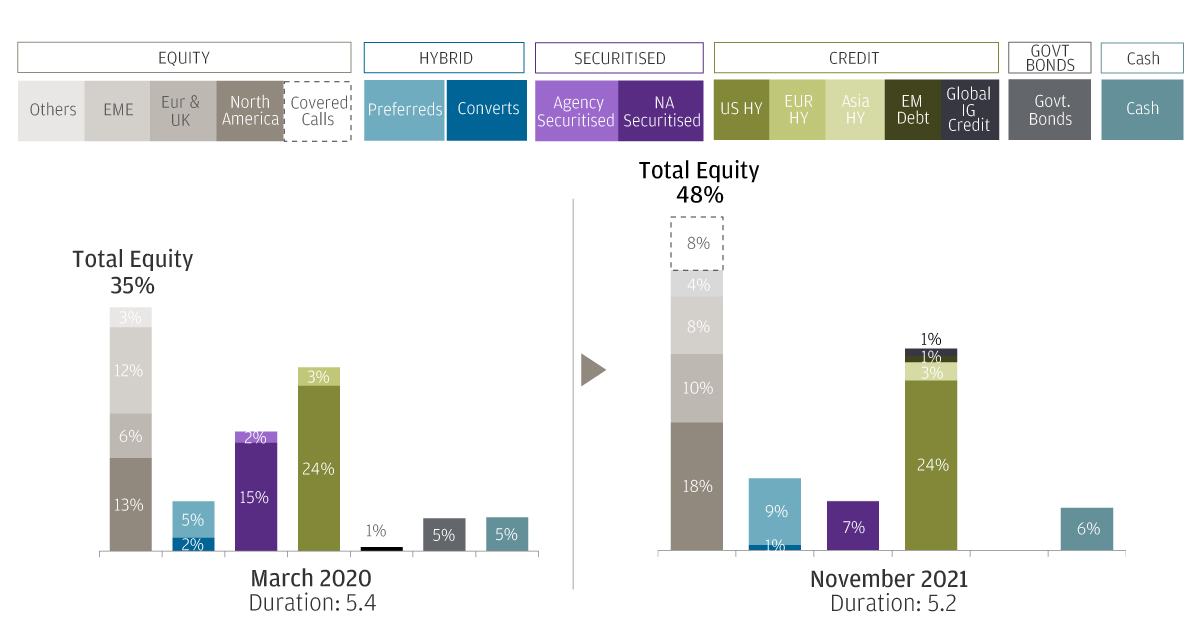
             A dynamic multi-asset approach allows investors to seek the high-conviction income opportunities in the prevailing market conditions. The portfolio6 has maintained a risk-on tilt since the COVID-19 drawdown in March 2020, favouring equity exposures that are geared to continued recovery, as well as adding covered call positions which provided attractive income and upside participation opportunities. Within fixed income, we have preferred low-duration, high-carry credit such as high yield where we continue to see strong fundamentals.

            By shifting tactically across asset classes and regions, JPMorgan Multi Income Fund is able to exploit market dislocations, seeking to deliver a sustainable yield6* in this fast-changing market environment, as illustrated in the chart below. (*The Fund’s mth – USD share class aims at monthly distribution. Dividend rate is not guaranteed. Distributions maybe paid from capital Refer to important information 3.) 

            A flexible and dynamic approach6
            a-flexible-and-dynamic-approach

            6. Source: J.P. Morgan Asset Management. Allocation data as at 31.03.2020 and 30.11.2021. The Fund is an actively managed portfolio, holdings, sector weights, allocations and leverage, as applicable are subject to change at the discretion of the Investment Manager without notice. Cash exposure represents both physical cash and derivative cash offset. 

            OUR MULTI-ASSET CAPABILITIES
            out-capabilities-1

            out-capabilities-2

            out-capabilities-3

            More on fund details
            More on other income offerings
            Login to etrading / escheduler

            Indices do not include fees or operating expenses and are not available for actual investment. Forecasts, projections and other forward looking statements are based upon current beliefs and expectations. They are for illustrative purposes only and serve as an indication of what may occur. Given the inherent uncertainties and risks associated with forecast, projections or other forward statements, actual events, results or performance may differ materially from those reflected or contemplated. For illustrative purposes only based on current market conditions, subject to change from time to time. Not all investments are suitable for all investors. Exact allocation of portfolio depends on each individual’s circumstances and market conditions. 

            High-yield credit refers to corporate bonds which are given ratings below investment grade and are deemed to have a higher risk of default. Yield is not guaranteed. Positive yield does not imply positive return. Diversification does not guarantee investment return and does not eliminate the risk of loss. 

            1. J.P. Morgan Asset Management, from launch on 09.09.2011 to 30.09.2022, NAV to NAV in USD with income reinvested. Calendar year return: 2017 +10.6%; 2018 -5.0%; 2019 +14.8%; 2020 +4.7%; 2021 +9.1%; 2022 YTD: -16.6%. Past performance is not indicative of future performance.
            2. Source: J.P. Morgan Asset Management, as of end-Sep 2022. Positive distribution yield does not imply positive return. Annualised yield = [(1+distribution per unit/ex-dividend NAV)^the number of times of dividend distribution per year]-1. The annualised dividend yield is calculated based on the monthly dividend distribution with dividend reinvested, and may be higher or lower than the actual annual dividend yield.
            3. The portfolio risk management process includes an effort to monitor and manage risk, but does not imply low risk.
            4. Source: J.P. Morgan Asset Management. As of November 2021. 
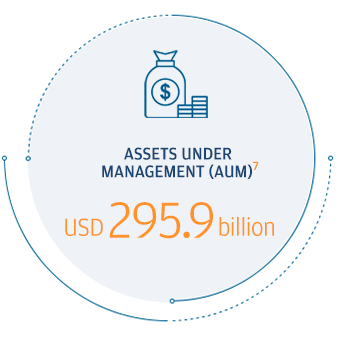
            1. Source: J.P. Morgan Asset Management. As of 30.09.2021. Due to rounding, data may not always add up to the total AUM. AUMs shown do not include custom glide path and retail advisory assets.
            1. Source: J.P. Morgan Asset Management. As of 30.09.2021. Includes portfolio managers, research analysts, traders and investment specialists with VP title and above.

            RELATED ARTICLES

            lets-solve-it-logo

            For more information, please call or email us. You can also contact your J.P. Morgan representative.

            (852) 2978 7788

            agents.info@jpmorgan.com

            J.P. Morgan Asset Management

            • Terms of Use
            • Privacy Statement
            • Cookies Policy
            • Investment Stewardship
            • Fund Notes
            • Offering Document(s)
            • Forms & Literature
            • Complaint Resolution
            • Guide to Using This Website
            • Sitemap

            J.P. Morgan

            • J.P. Morgan
            • JPMorgan Chase
            • Chase

            Important: This area of the website is intended only for distributors of JPMorgan Funds (Asia) Limited. Information is not intended for retail or public distribution. By using this information, you confirm that you accept the Terms of Use as set out in https://am.jpmorgan.com/hk/.

            Investment involves risk. Past performance is not indicative of future performance. In particular, funds which are invested in emerging markets and smaller companies may involve a higher degree of risk and are usually more sensitive to price movements. Investors should carefully read and consider the fund offering document(s), which contain details on investment objectives, risk factors, charges and expenses of the fund, before making any investment decisions. Information in this website does not constitute investment advice, or an offer to sell, or a solicitation of an offer to buy any security, investment product or service, nor a distribution of information for any such purpose. Informational sources are considered reliable but you should conduct your own verification of information contained herein. The above information has not been reviewed by the SFC, issued by JPMorgan Funds (Asia) Limited.

            Apple, the Apple logo, iPad and iPhone are trademarks of Apple Inc., registered in the US and other countries. App Store is a service mark of Apple Inc.

            Copyright 2026 JPMorgan Funds (Asia) Limited. All rights reserved.