Election overview
-
What are the policy implications of the election results?
-
How have markets reacted to the election results?
-
How should investors navigate policy uncertainty?
-
How should investors approach investing in an election year?
-
How do returns look under different configurations of government?
-
What configuration of government is best for the economy and markets?
What are the policy implications of the election results?
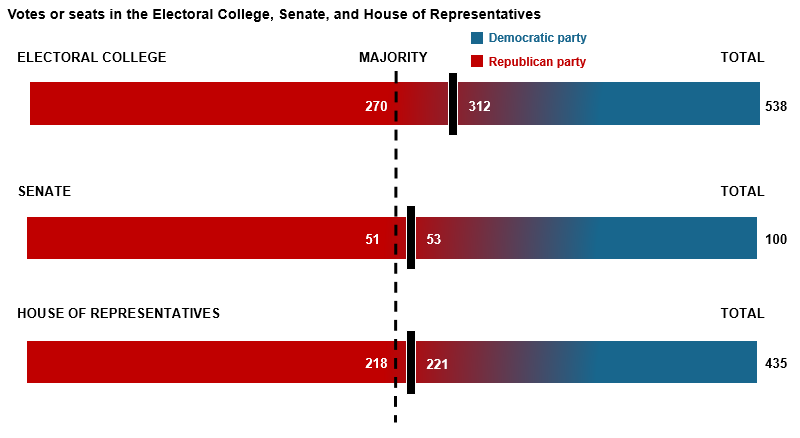
A Republican-controlled Congress would give the party significant control over the legislative agenda, although the size of that majority will be important. With a Republican Senate, President-elect Trump will be able to confirm politically aligned nominees relatively easily and push major agenda items, like deregulation. Should Republicans also win a majority in the House, broad tax and immigration policy could also pass.
With election uncertainty behind us, investors will focus on future clarity on policy priorities and implementation vs. what was proposed.
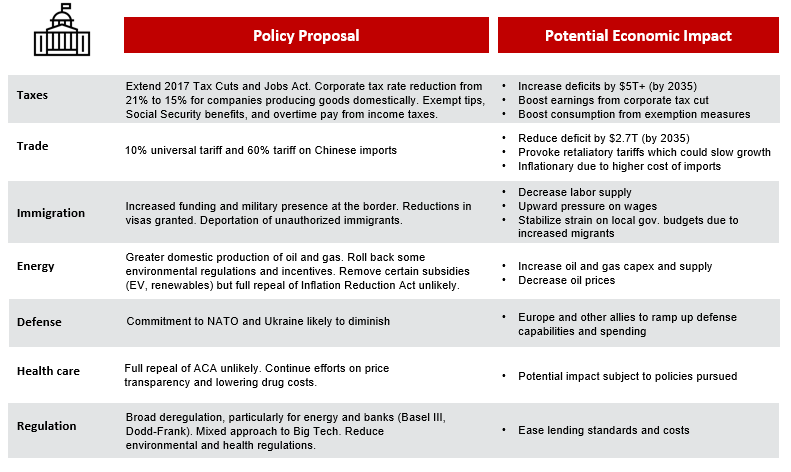
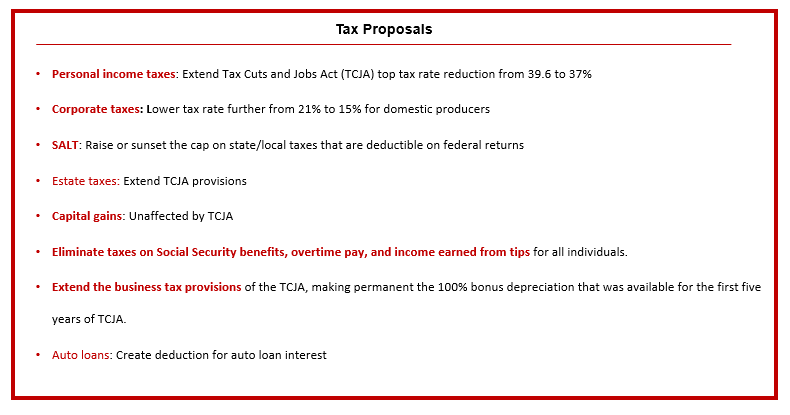
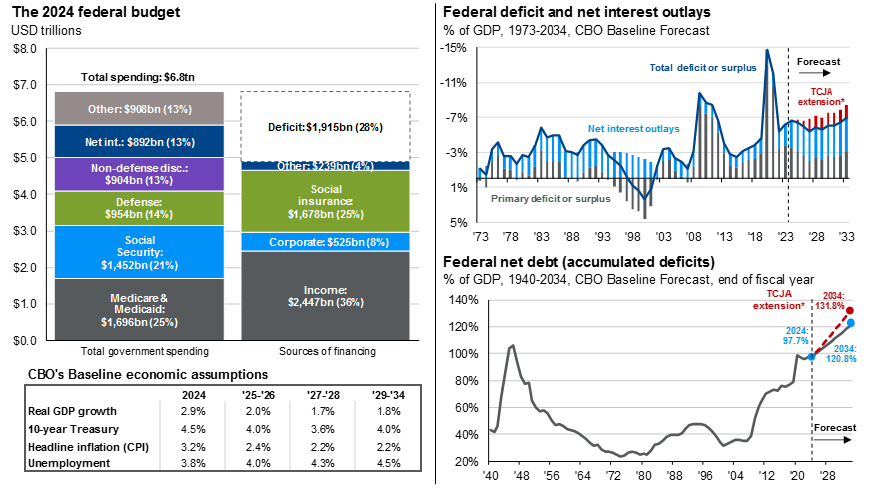
- Fiscal: President- elect Trump aims for a full extension of the 2017 Tax Cuts and Jobs Act (TCJA), keeping a 37% top tax rate, and potentially reducing the corporate tax rate from 21% to 15% for domestic manufacturers, though Congress will hold the final pen on the parameters of the bill. Altogether, Trump’s proposals have been estimated to increase the deficit by $7.5tn over a decade relative to the CBO baseline, raising debt to 142% of GDP1. However, narrow margins in the Senate and House, and the risk of stoking a bond market reaction, could limit a full implementation of campaign proposals.
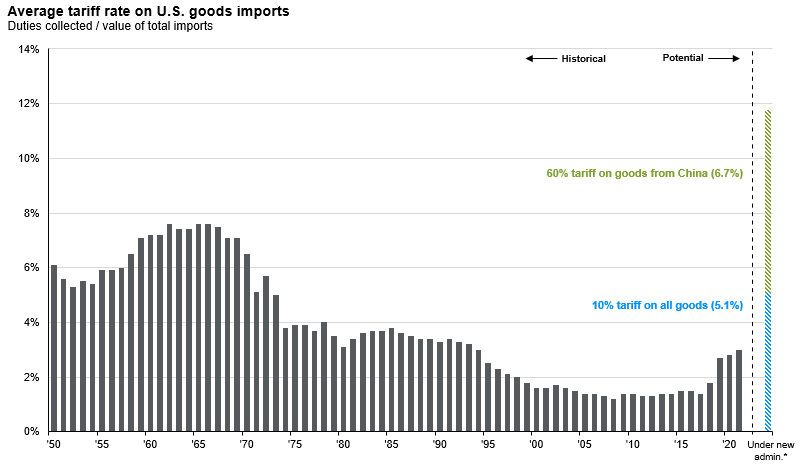
- Trade and tariffs: Higher tariffs on China and on trading partners generally seem very likely, but there is uncertainty around what constitutes a tariff “threat” versus actual policy intent from Trump’s campaign. President-elect Trump would have considerable executive authority to impose tariffs and has suggested a 10% tariff on all imports and a 60% tariff specifically on Chinese imports. Trade talks will also address renegotiating the USMCA trade deal, but major changes would require Congress. Ultimately, trade negotiations could yield a range of outcomes, while the potential for retaliatory tariffs and inflation likely prevent full implementation of campaign promises. The ongoing trend of “friendshoring” and “nearshoring” should continue, as companies diversify supply chains while trying to stay competitive.
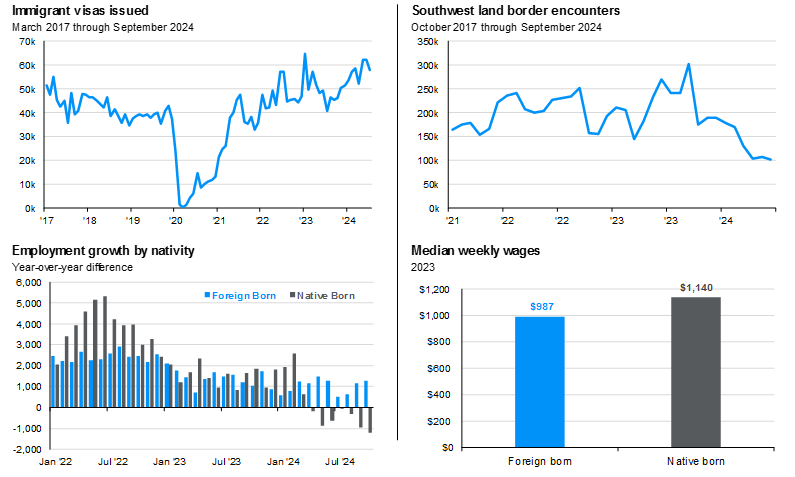
- Immigration: Republican-led reform is possible and would likely increase border funding with much stricter asylum measures. Economic reliance on immigrant labor combined with deportation challenges should prevent mass deportation, but efforts could still restrict the number of asylum seekers attaining work authorization. Looking ahead, there are prospects for legal immigration reform as well.
- Defense: The U.S. commitment to NATO and Ukraine will likely diminish. The U.S. won’t be seen as providing the security guarantees, money and weapons it has done in the past, which will bolster defense spending for the rest of the world – particularly in Europe.
- Energy: The IRA is likely to remain in place for reasons we discussed here, but some provisions may change (particularly on EV credits). The fossil fuel industry may benefit from weaker regulatory constraints, but increased production could lower prices.
- Regulation: President-elect Trump has argued for broad deregulation, but it is difficult to estimate the magnitude of potential reform. Big Tech may see mixed impacts, while regional banks and energy companies stand to benefit most from looser regulations. Additionally, the perception of less anti-trust enforcement could boost corporate M&A moving forward.
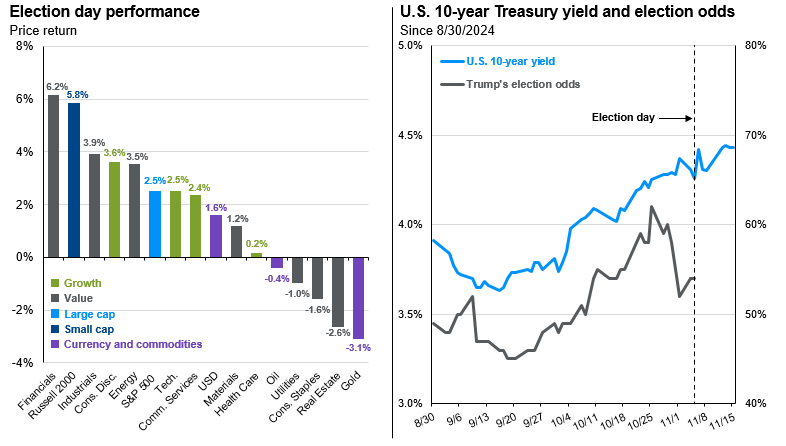
The positive equity market reaction has focused on the prospects of pro-growth policies and deregulation, overshadowing the risks of tariffs and rising deficits. As such, beneficiaries of deregulation such as small caps, banks, onshore energy and steel producers and cryptocurrencies have risen today. The bond market has been more sober, focusing on the likelihood of an even wider deficit pushing rates higher, with the yield curve steepening as long-end yields rose more than short-term rates. Notably, this trend has been ongoing, with the U.S. 10yr rising from 3.7% to 4.6% since the Fed cut rates on September 18th. Elsewhere, currencies have reacted to potentially higher U.S. yields and tariffs, strengthening the dollar across the board. While many of these market reactions were anticipated, they may not be sustainable.
We now know the election outcome, but investors still lack clarity on policy implementation, a key indicator for investment implications. Indeed, actual policy action often differs from campaign rhetoric. As such, we would exercise caution against chasing recent market movements and suggest focusing on what we do have clarity on.
How have markets reacted to the election results?
- U.S. equities: Before this result, U.S. equity fundamentals were strong and improving, and a likely Red Sweep boosts some value, cyclical and small/midcap sectors that have underperformed. This should provide further support behind the broadening out of market performance. Sentiment has also been bolstered by prospects for more M&A and IPO activity, while Big Tech anti-trust enforcement seems less-than-feared under a Harris administration. U.S. equities remain supported - although risks around higher long-end yields and tariff implications don’t seem reflected in market prices and could generate volatility ahead.
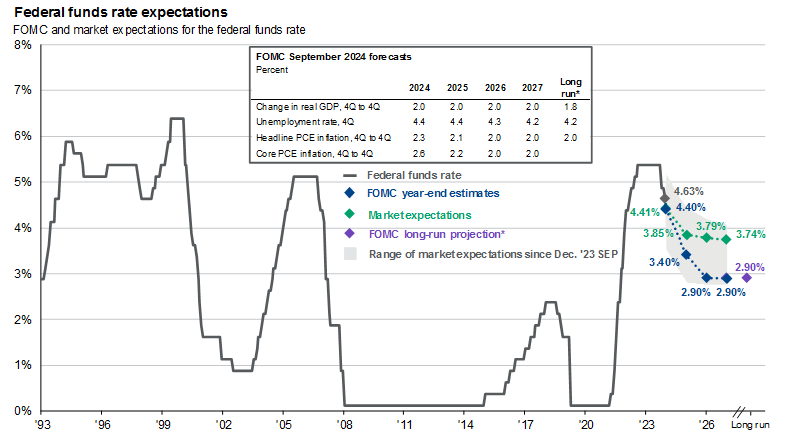
- Rates: Long-end yields will likely stay elevated due to increased Treasury issuance and a potential “risk premium” on U.S. fiscal challenges. Short-term rates will focus on the Federal Reserve’s actions from here, with an expectation of further rate cuts ahead this year (including tomorrow at the November FOMC meeting) and in the beginning of next year.
- Corporate credit: Before this result, both investment grade and high yield corporate credit were supported by strong fundamentals. This should continue to be the case post-election, with performance likely to remain supported especially in high yield given its lower duration versus investment grade.
- Dollar: The U.S. dollar may continue to strengthen as was the case in the 2018-19 trade war due to:
- The potential for higher tariffs,
- The uncertainty about what trade uncertainty could do to global growth and
- Widening U.S. interest rate differentials versus the rest of the world. However, the U.S. dollar is now 14% stronger than in early 2018 when the Trade War 1.0 first began, limiting some of the upward move versus that episode.
- International equities: The stronger U.S. dollar, combined with global growth uncertainties, is likely to generate pressure on non-U.S. equities. In particular, Eurozone, Chinese and Mexican equities look vulnerable in the short-term. However, investors should maintain some exposure to international equities, as:
- The valuation discount of international versus the U.S. has been near record lows,
- Chinese policy makers have been on a policy stimulus mode and may ramp stimulus further in response to the election outcome, and
- Powerful secular tailwinds boosting certain markets remain such as Taiwan (AI) and India (demographics, “friendshoring” beneficiary). As always, beneath the surface there will be winners and losers from the policy landscape on a company-by-company basis.
- Diversification: With fiscal concerns keeping bond volatility high, the stock-bond correlation is likely to stay positive, requiring investors to expand the scope of assets that enhance diversification. In this case, gold and real assets should remain in focus.
How should investors navigate policy uncertainty?
- The economy and markets have done well under a variety of government configurations.
While presidential elections are consequential for their influence on the trajectory of policy, equity market returns through various presidential terms tend to be positive, and ultimately driven by the macro environment.
For instance, despite two very different administrations under Obama (’09-‘17) and Trump (’17-‘21), market performance was nearly identical. The S&P 500 returned an average annual 16.3% and 16.0% under each administration (see Guide to the Markets, page 68).
- Policy can have an impact – but it’s often not the strongest driver of returns.
Investors often consider how they should position portfolios based on election outcomes. However, it is very difficult to construct reliable investment strategies based on different policy implications.
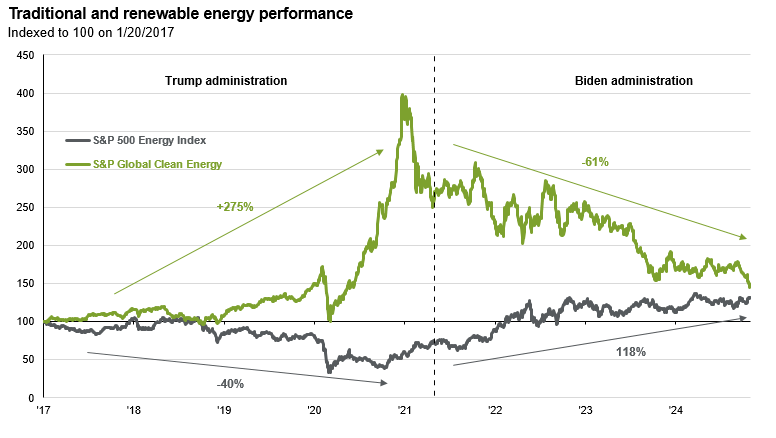
For example, President Trump campaigned vigorously to support the traditional energy industry during his presidency. Yet the S&P 500 Energy index was down -40% under his term, while the S&P 500 Global Clean Energy index was up 275%. On the other hand, Biden campaigned on scaling back fossil fuels and galvanizing renewables and successfully passed a $369Bn commitment with the Inflation Reduction Act. Yet the S&P 500 Energy index has more than doubled and the S&P 500 Global Clean Energy index is down over 50% so far in his term. Macro forces ultimately drove markets: varying supply/demand and interest rate environments mattered more than any policies or intentions by the White House (See 2024 Election Presentation, Slide 11). - The best defense against the unknown is a diversified portfolio.
Markets know what to do with risks they know, and an election outcome – regardless of the results – provides some clarity on policy direction. However, Washington still faces significant fiscal challenges and greater policy uncertainty under a Red Sweep compared to a divided government could keep volatility elevated.
For investors, the best defense against the unknown risks remains diversification. This message is even more important today given the rise in equity valuations, the concentration of U.S. equities in global stock markets and the concentration of mega-cap growth stocks in U.S. equities. As previously noted, for many investors, this risk is being amplified by a lack of portfolio rebalancing.
How should investors approach investing in an election year?
Political opinions are best expressed at the polls, not in a portfolio. One cardinal rule investors ought to follow: Don’t let how you feel about politics overrule how you think about investing.
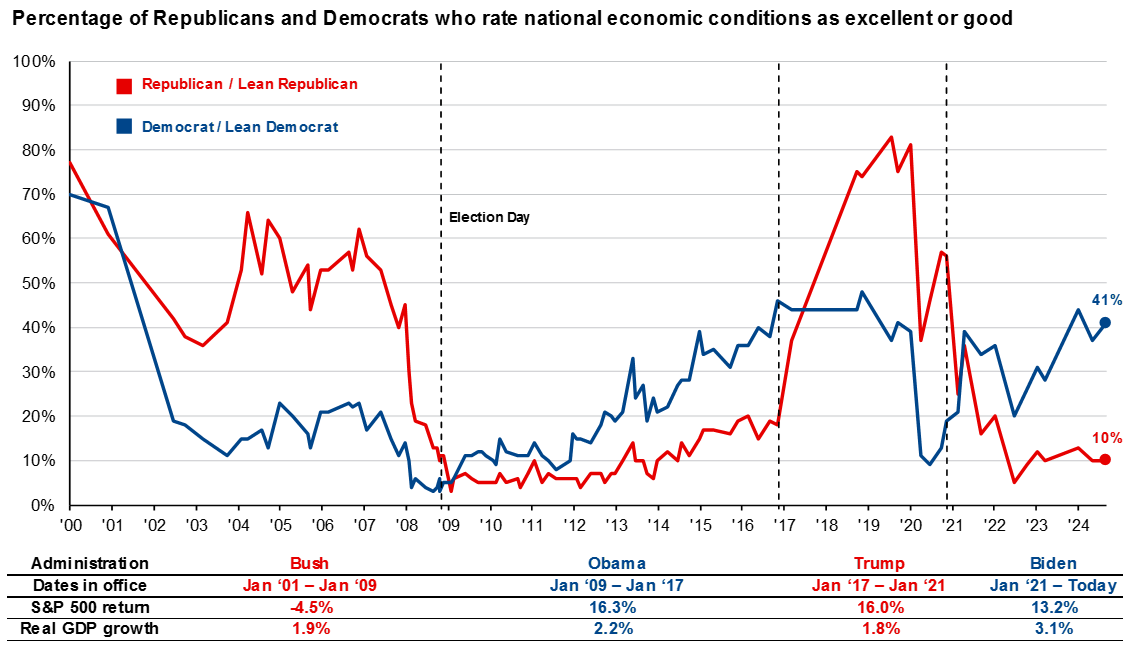
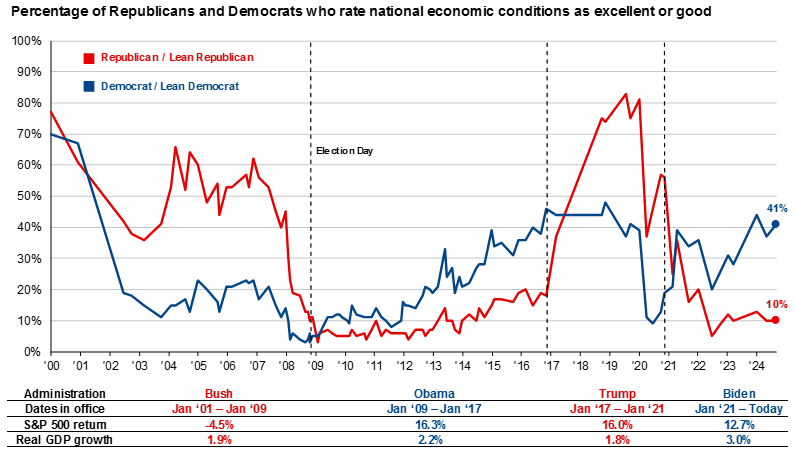
The chart below shows a survey from the Pew Research Center asking Americans how they feel about economic conditions. The results show that Republicans often feel better about the economy under a Republican president, while similarly Democrats often feel better about the economy under a Democratic president. Investors often make portfolio decisions based on their economic outlook.
Yet, average annual returns on the S&P 500 during the Obama administration of 16.3% and during the Trump administration of 16.0% were almost identical and higher than the average return over the last 30 years of 10.4%. It is likely the macro conditions, like ultra-low interest rates enjoyed during both Obama and Trump administrations, were a more influential driver of above-average returns during those periods, rather than the policy prescriptions each president espoused.
Investors who allowed their political opinions to overrule their investing discipline may have missed out on above-average returns during political administrations they didn’t like.
How do returns look under different configurations of government?
Investors always want to know how markets performed under different configurations of government or different years of a presidency. How do markets perform under a Republican sweep or Democrat sweep? What if a Republican wins the White House but loses both chambers of Congress? How do returns look in the first year of a presidency?
This information is easy to compute, as highlighted below, but these returns tell investors very little about why markets performed the way they did and how markets are likely to perform in the future. Monetary policy, fiscal policy, economic growth, labor markets, corporate profits, and valuations are much better indications of future returns. Fiscal policy is driven by the government of course, but the configuration of the government matters and a sweep by one party doesn’t guarantee that it will accomplish all its campaign promises. In fact, due to growing political polarization, garnering consensus within a party is becoming increasingly difficult. For example, while the Democrats controlled Congress, President Biden had an ambitious Build Back Better proposal, which was later scaled down to a more moderate Inflation Reduction Act as a compromise between members of his own party.
Furthermore, just as calendar years are arbitrary markers when considering economic and market cycles, they also seldom align with actions of presidential administrations.
The economic context, not the political context, tends to be much more relevant to understanding historical market environments and returns.
What configuration of government is best for the economy and markets?
As highlighted in a prior post, looking at returns during different government configurations tells investors little about why markets or the economy performed the way they did, and give little indication of how this could play out in the future.
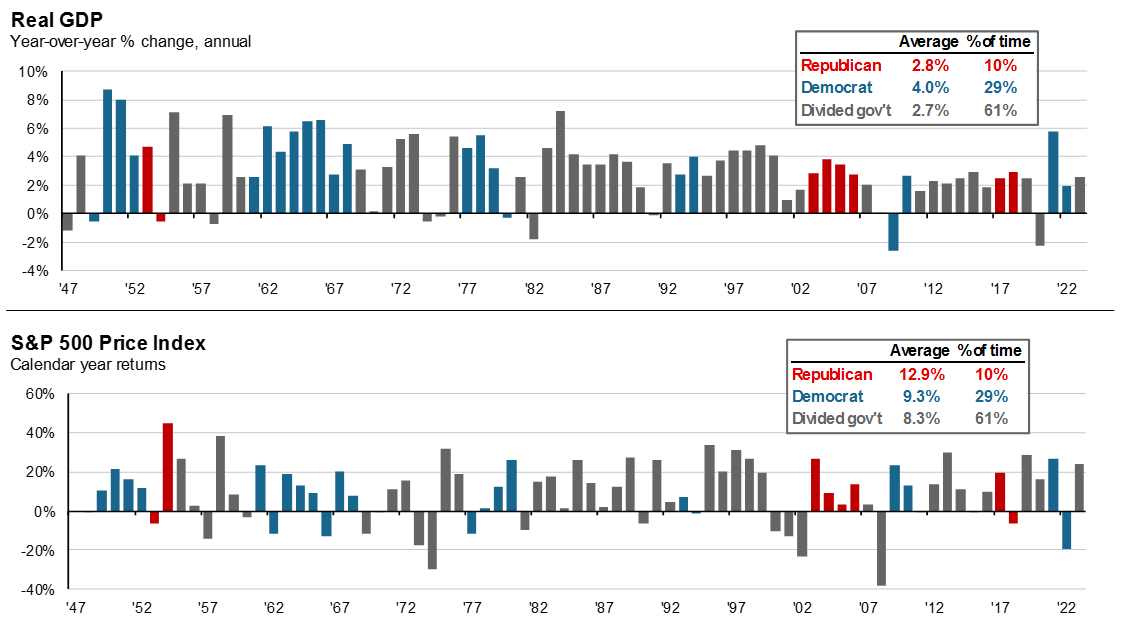
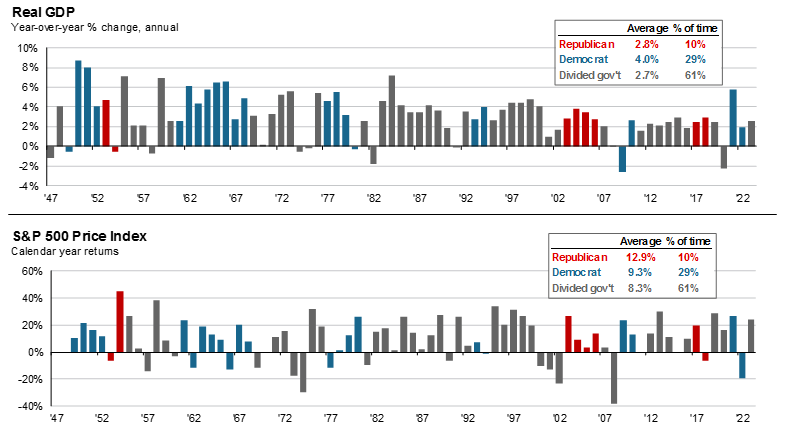
The charts below highlight real GDP growth and S&P 500 returns during Republican (red), Democratic (blue), and divided governments (when one party does not control the White House and both chambers of Congress). Since 1947, real GDP has grown on average 2.8% under Republican rule and 4.0% under Democratic rule. The S&P 500 has returned 12.9% under Republicans and 9.3% under Democrats.
It would be easy to conclude that the economy performs better under Democrats and the market performs better under Republicans, but the sample sizes are relatively small. Republicans have controlled the government only 11% of the time since World War II, in the mid-1950s, early 2000s, and just before the pandemic. These were significantly disparate macro environments. Democrats have controlled the government 29% of the time, mostly in the post-WWII period and in the 1960s, but only in six years over the past three decades. Instead, the most common configuration of government is divided, which has produced 2.7% annualized real GDP growth since World War II, and 8.3% annualized returns on the S&P 500.
Ultimately, both the economy and markets tend to fare well under most government configurations.
Latest Insights
Post-election presentation
The information presented is not intended to be making value judgments on the preferred outcome of any government decision or political election.