JP Morgan Asset Management - Home
  • Products
    Overview

    Funds

    • Performance & Yields
    • Liquidity
    • Ultra-Short
    • Short Duration

    Solutions

    • Empower Share Class
    • Academy Securities
    • Cash Segmentation
    • Separately Managed Accounts
    • Managed Reserves Strategy
    • Capitalizing on Prime Money Market Funds
  • Insights
    Overview

    Liquidity Insights

    • Liquidity Insights Overview
    • Case Studies
    • Leveraging the Power of Cash Segmentation
    • Cash Investment Policy Statement

    Market Insights

    • Market Insights Overview
    • Eye on the Market
    • Guide to the Markets
    • Market Updates

    Portfolio Insights

    • Portfolio Insights Overview
    • Currency
    • Fixed Income
    • Long-Term Capital Market Assumptions
    • Sustainable investing
    • Strategic Investment Advisory Group
  • Resources
    Overview
    • MORGAN MONEY
    • Global Liquidity Investment Academy
    • Account Management & Trading
    • Announcements
    • Navigating market volatility
    • 2024 US Money Market Fund Reform
  • About us
    Overview
    • Diversity, Opportunity & Inclusion
    • Spectrum: Our Investment Platform
    • Sustainable and social investing
    • Our Leadership Team
  • Contact us
  • English
  • Role
  • Country
MORGAN MONEY LOGIN
Search
Menu
Search
You are about to leave the site Close
J.P. Morgan Asset Management’s website and/or mobile terms, privacy and security policies don't apply to the site or app you're about to visit. Please review its terms, privacy and security policies to see how they apply to you. J.P. Morgan Asset Management isn’t responsible for (and doesn't provide) any products, services or content at this third-party site or app, except for products and services that explicitly carry the J.P. Morgan Asset Management name.
CONTINUE Go Back
  1. What is priced in to equity markets?

  • LinkedIn Twitter Facebook

What is priced in to equity markets?

01/24/2020

David Lebovitz

Equity market valuations have risen substantially in recent months, with the forward P/E ratio of the S&P 500 now at a level of 18.6x. Elevated valuations are not a problem in and of themselves, particularly against a backdrop of fading geopolitical headwinds and low interest rates. But what are investors currently pricing in? And has the stock market moved too far, too fast?

To start, investors seem to believe that there will not be any further escalation in trade tensions. The recently signed Phase One trade deal between the U.S. and China contained few surprises - the market’s reaction (or lack thereof) to the deal was evidence of this. Equities sold off in the immediate aftermath of the deal being signed, before rebounding into the end of the trading day. This is a textbook example of buying the rumor, and selling the news.

At the same time, investors seem to be pricing in a rebound in global growth and an accommodative Federal Reserve (Fed). While the geographic and sectoral distribution of global growth may even out over the coming months as trade tensions fade and manufacturing comes back online, a synchronized acceleration in global growth like we saw in 2017 seems a bit out of scope. At the same time, while the bar for further Fed action seems quite high, it should not be ruled out. A backdrop of fading trade risks and improving growth could gradually lead the Fed to change its tune, and begin to suggest that resuming rate normalization might be appropriate down the road.

So has the stock market moved too far, too fast? There is quite a bit of optimism priced in to equity markets, but that does not mean elevated valuations are unsustainable. Rather, markets will need to grow into these valuations, which at the end of the day will be dependent on earnings. As highlighted in our 4Q earnings bulletin, we expect low to mid-single digit earnings growth in the coming year. If this occurs against a backdrop of modest price appreciation, it will reduce the chances of a near-term pullback. But if for some reason outcomes disappoint relative to expectations, a focus on total yield (dividends + buybacks) should help investors weather the storm.

S&P 500 Index: Forward P/E ratio

Average P/E and standard deviations are calculated using 25 years of IBES history. Data are as of January 22, 2020.

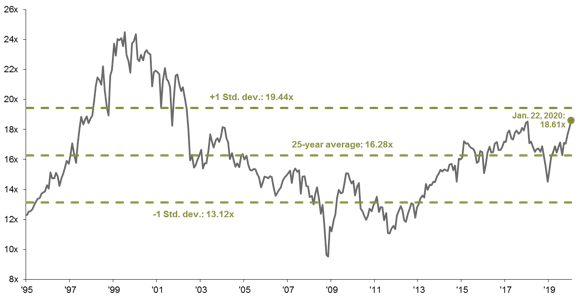
Source: FactSet, FRB, Robert Shiller, Standard & Poor’s, Thomson Reuters, J.P. Morgan Asset Management. Price to earnings is price divided by consensus analyst estimates of earnings per share for the next 12 months as provided by IBES since January 1995, and FactSet for January 22, 2020. Average P/E and standard deviations are calculated using 25 years of IBES history. Data are as of January 22, 2020.


0903c02a827dabe5

EXPLORE MORE

On the Minds of Investors

What investment questions are on the minds of investors? Explore the questions investors ask frequently and find answers at J.P. Morgan Asset Management.

Read more

Guide to the Markets

The J.P. Morgan Guide to the Markets illustrates a comprehensive array of market and economic histories, trends and statistics through clear charts and graphs.

Read more
  • Equities
  • Economy
J.P. Morgan Asset Management

  • Investment stewardship
  • About us
  • Contact us
  • Privacy policy
  • Cookie policy
  • Sitemap
  • Accessibility
J.P. Morgan

  • J.P. Morgan
  • JPMorgan Chase
  • Chase

READ IMPORTANT LEGAL INFORMATION. Legal Disclaimer >

The value of investments may go down as well as up and investors may not get back the full amount invested.

Copyright 2025 JPMorgan Chase & Co. All rights reserved.