In all of our recent client meetings we have been getting the same question – should I buy the dip? It is a fair question to ask, but given how difficult it is to time the market, there is not a clear answer. What we can provide perspective on, however, is where we are finding value – in other words, what looks cheap relative to the fundamentals.
The S&P 500 has fallen -10.7% from its February 19, 2020 peak, but in general, valuations still appear a bit rich. It is not clear how long market volatility will remain elevated, nor is it easy to precisely quantify the impact that the spread of COVID-19 will have on economic growth and profitability. That said, looking at data over the course of this cycle can provide us with some insight as to why certain sectors have enjoyed better profitability than others. When viewed relative to cycle returns, and the recent decline in valuations, we can begin to think about where value has been created.
The chart below looks at the average return on equity (ROE) by sector since June 2009, and the consumer staples, technology and consumer discretionary sectors, top the list. This tells us something very interesting about what has mattered for profitability over the course of this cycle. The high ROE from consumer staples is a function of solid profit margins, high asset turnover (attributable to product mix), and an increase in leverage. On the other hand, the high ROE in the technology and consumer discretionary sectors is a function of solid margins and capital lite business models, which have allowed these companies to be run in an efficient manner. What hasn’t worked? Financials, utilities and energy have all seen an average return on equity below that of the S&P 500; this seems attributable to lackluster margins, poor asset turnover, and in the case of energy, an inability to take on more debt given the downward pressure we have seen on oil prices.
So if this is where there has been value created over the course of the cycle, where are the opportunities today? As mentioned earlier, stocks in aggregate do not look cheap, but consumer staples look cheaper than they did at the market peak, with valuations falling from the 92%-tile to the 84%-tile over the past two weeks. On the other hand, the technology sector has seen valuations remain relatively stable, as owning technology has been a bit more of a defensive trade over the course of the cycle. Consumer discretionary saw valuations fall from the 93%-tile to the 82%-tile, suggesting some value has been created. Finally, for those willing to take on a bit more risk over the long-run, valuations in energy and financials are looking increasingly attractive – while profitability is a bit lackluster, our expectations around dividend payouts and buyback activity suggest that these sectors may warrant a second look.
As valuations find their footing, focus on profitability
BREAKDOWN OF RETURN ON EQUITY BY SECTOR
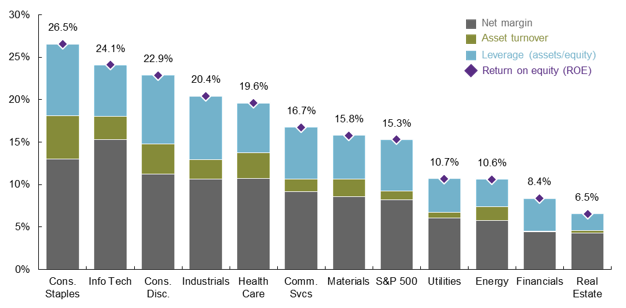
Source: FactSet, Standard & Poor’s, J.P. Morgan Asset Management. ROE is based on DuPont analysis and is based on the average levels from 7/30/2009-2/29/2020.
0903c02a82831fe4