Bathtub pensions: An updated look at the multiemployer pension system
05/29/2020
Michael Buchenholz
The multiemployer pension (MEP) system remains under pressure, with the recent decline in interest rates and uptick in equity market volatility exacerbating an existing problem. Multiemployer plans (MEPs) are private sector, collectively bargained, defined benefit plans maintained by a group of employers, typically from the same industry. Roughly 70% of plan participants are employed in the Construction, Transportation and Services industries, all hit particularly hard by fallout from COVID-19 – some due to a lack of work resulting from the economic shutdown while others are serving on the front lines, keeping our food and other supply chains up and running.
There are about 1,400 multiemployer pension plans in the United States, covering approximately 10.6 million workers; prior to the COVID-19-driven economic downturn, 10% to 15% of multiemployer participants were in plans that were projected to have insufficient assets to pay 100% of benefits at some point within the next 20 years. This suggests that approximately 1.3 million workers are in plans that are badly underfunded, and it seems likely that the current environment will on exacerbate this underlying stress. Although many employers continue to gravitate towards defined contribution plans, the economic impact of allowing the multiemployer system to continue to crumble would be significant not only for the plan participants, but for the economy as a whole.
A refresher on the Multiple Employer Plan (MEP)
While pension plan valuations can be complex, involving a myriad of actuarial and economic assumptions and projections, pension mechanics are fairly straightforward. An apt analogy can be borrowed from the heavily impacted plumbing sector. Just like a bathtub, a pension plan is a system of inflows and outflows. Over time the water level will rise and fall but when all is said and done, to keep the tub full the water coming out of the spigot must equal the water leaving through the bathtub drain. For multiemployer plans, the following items represent the main flows in and out of the “pension tub” (graphic illustrated below):
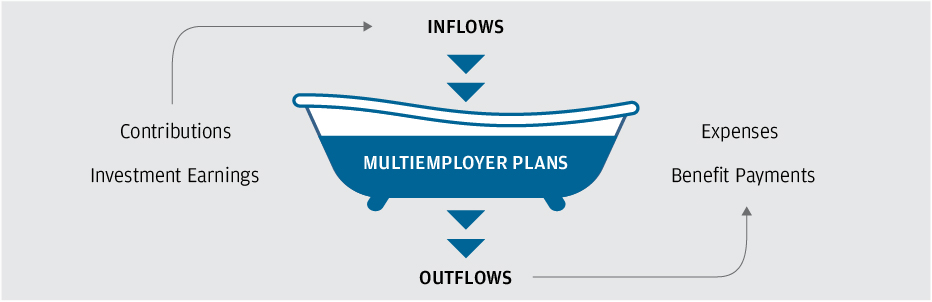
Inflows: Contributions: Contributions into the plan are negotiated as part of collective bargaining agreements between unions and their employers and are generally based on a fixed dollar amount per hour worked for each participant. For example, a benefit package of $32/hour may consist of $20 of take-home wages, $7 for health insurance coverage and $5 for pension funding.
Inflows: Investment Earnings: Plan assets are invested in a diversified portfolio of investments whose income and appreciation represent further inflows into the pension bathtub. Conversely, drawdowns in asset prices decrease the water level and sometimes in dramatic fashion.
Outflows: Expenses: includes operating and administrative costs, as well as PBGC premiums ($30 per participant for the 2020 plan year) to fund the multiemployer insurance program. System-wide administrative expenses averaged around $250 per participant, although costs are higher for the lowest funded plans1.
Outflows: Benefit Payments: represent the disbursement of earned retirement funds and represent the largest outflow in the multiemployer pension system. Benefits, like contributions, are prescribed and generally based on years of service. For example, a retirement benefit could be formulated as $50 per month for each year of service. So a worker with 30 years of service would receive a monthly annuity benefit of $1,500 starting at age 65. Annual benefits paid to MEP retirees and their beneficiaries currently exceed $40bn per year.
Over short periods of time, funding levels can be expected to vary. However, as plans age and mature, it becomes much harder to recover from market shocks, such as those borne out of COVID-19. Revisiting our bathtub analogy, the contribution inflows into MEPs had already slowed due to declining union membership, shifting demographics resulting in fewer active participants (Exhibit A) as well as orphaned workers from withdrawn or bankrupt employers.
Exhibit A: Active Participants, those paying into the MEP system have shrunk dramatically
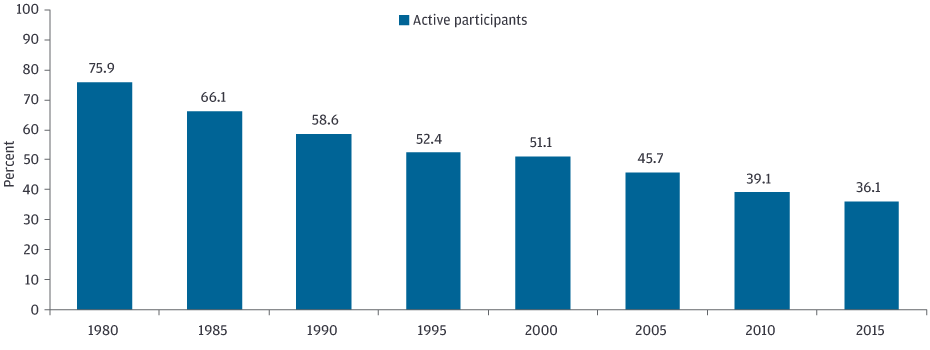
Source: 2017 PBGC Data Book
The current economic crisis has not only taken a large quantity of water out of the tub due to investment losses, it, along with the ensuing lockdown, has also further slowed the stream of contribution inflows as employment has dried up for heavily unionized industries. For example, we’ve heard reports of more than 60% of union construction workers unemployed in some major metro regions which have shut down non-essential construction work. Similarly, contributions to pension plans affiliated with the entertainment industry have come to a screeching halt due to the shutdown of Broadway and other entertainment venues across the US. These reduced inflows come against the backdrop of increasing benefit payments as more and more workers reach retirement age. To summarize, the tub is draining faster just as the spigot has slowed to a trickle, and the MEP system is at risk of running dry.
At the end of 2019, the multiemployer system had $605bn in assets, relative to $712bn in accrued liabilities, resulting in a funded status of 85%. However, the devil is in the details, as the spread between those plans that are deemed non-critical and those that are deemed critical and declining has steadily widened since the financial crisis. Critical and declining plans represent 1.2 million workers and distribute over $530mm per month to retirees and beneficiaries (Source: 2018 5500 filings), or $6.36B a year. The economic multiplier on pension payments is assumed to be around 2:1 ($2 economic output for every $1 in pension payments). This means that payments to workers in critical and declining plans represent nearly $13B of economic output a year, with the system more broadly accounting for about $80bn of output. When this is combined with wages paid, the multiemployer pension system accounts over $1tn of economic output, or 5.7% of GDP.
Pension Benefit Guaranty Corporation (PBGC): A Sense of Impending Doom
Established in 1974 under ERISA (the Employee Retirement Income Security Act), the PBGC has two programs: one for single-employer plans and one for MEPs. Under the single-employer program, troubled plans are absorbed and managed by the insurer with a guarantee of up to $69,750/year for a 65-year old retiree. In contrast, the MEP PBGC program, rather than absorb troubled plans, provides financial assistance only up to $12,870/year2. Among ongoing plans, should they require financial assistance from the PBGC, more than half of the participants would experience benefit cuts due to the low guarantee.3 Unfortunately, it seems likely that many of these participants would in fact receive no PBGC insurance coverage at all.
As of fiscal year 2019, the MEP PBGC program had a deficit of $65bn, with less than $3bn of program assets remaining. Projections show that over the next decade about one million participants will see their plans’ fall into insolvency (Exhibit B). The magnitude of these claims would overwhelm the PBGC, which itself is expected to be insolvent no later than 2026. These same plans currently payout almost $6bn of benefit payments annually, funds that would cease to flow through the economy. If the PBGC had a stronger financial position, it would postpone the impending crisis for at least a couple more years. However, given the current status of the insurer, something must be done immediately. The onset of COVID-19 and its impact on the economy and financial markets has only accelerated this urgency.
Exhibit B: Participants in Plans Projected to Become Insolvent
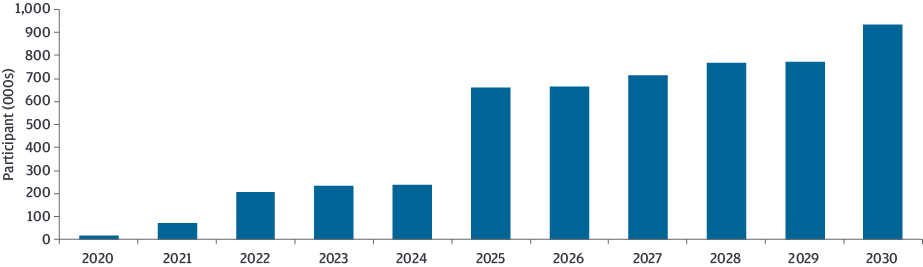
Source: J.P. Morgan Aseet Management Calculations, 2018 Form 5500, Schedule MB – Line 4f
Look at Proposed Solutions
The rapid spread of COVID-19 and resulting economic shutdown has served as a reminder that although the U.S. economy has enjoyed steady, consumption-based growth for some time, we are not immune to economic shocks. The current downturn is unique in the sense that services are being hit far harder than manufacturing; while an orientation towards service-industries has helped insulate the U.S. in the past, it leaves our economy far more exposed at the current juncture. Over 33 million jobless claims have been filed over the past seven weeks, hours worked have fallen, the unemployment has risen to 14.7% with expectations that it will continue to rise, and economic growth is already slowing sharply. Funding issues aside, most Americans are facing what is fundamentally a cash flow problem, as consumers have no income and businesses have no revenue. Allowing pension payments to begin drying up at this juncture will amplify the current downturn and significantly impede the recovery.
Discount Rates
Actuaries and economists have for years been debating the appropriateness of various discount rates for pension valuations. Rather than rehash those arguments here, we find it more constructive to consider the practical implications of discount rate changes. Under the existing framework, liabilities for funding purposes are valued with discount rates equivalent to the long term expected return on plan assets, averaging around 7.0% for the 2018 plan year. In cases of impending solvency, where the “long-term” isn’t very long, expected returns can be significantly lower. For example, the Central States Pension Fund assumes a 3.0% expected return, corresponding to a shift towards a short-term, liquid asset allocation as the plan treks towards expected insolvency in 2025.
In (Exhibit C) we take an illustrative sample plan, currently 80% funded using a 7.0% discount rate and $1bn in liabilities. Dropping the discount rate to 6.0%, JPMorgan’s current 10-15 years forward looking assumption for a 60/40 portfolio, results in a 5% drop to 75% funded. However, using a corporate bond discount rate like single-employer plans or a risk-free rate results in a 37% and 47% drop in funded status, respectively. Whether or not treasury yields are the answer in the search for objective discount rate truth, the results of such a change are clearly untenable to the system as a whole. Returning to our bathtub analogy, reductions in the discount rate are akin to taking the same amount of water and dumping it into a much larger vessel. The drain continues to pull the same volume of liquid, but the water level suddenly appears dangerously low. This compels larger inflows into the system, but doesn’t solve the existential challenge of where those flows will originate.
Exhibit C: Sample MEP Valuations Under Various Discount Rate Assumptions
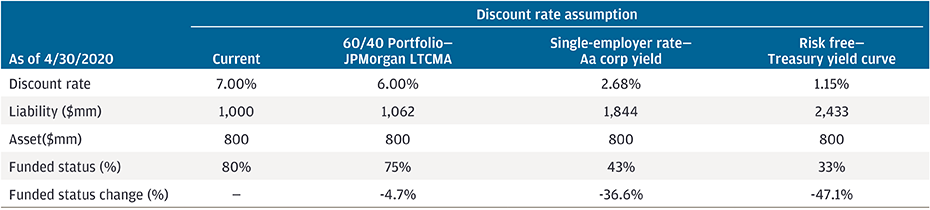
Source: J.P. Morgan Asset Management Calculations, BAML ICE. Calculations based on a hypothetical stream of expected benefit payments with a 13yr duration.
As we think about other solutions, we return to some of the views expressed in our paper on the multiemployer pension system in November 2018. At the current juncture, it seems that there are three potential sources of resolution: increase contributions, decrease benefits or obtain a loan to improve the funded status of these plans.
The first option is relatively challenging to implement, as few employers would be able or willing to sustain the financial burden of the contributions required to remedy the problem. The second option –decreasing benefits –is equally challenging, as the ERISA anti-cutback rule is meant to prevent this from occurring. The third route –some sort of loan –seems like the best option, but may be challenged given significant growth in the debt and deficit this year on the back of COVID-19 relief. Although the numbers would be small relative to the $8tn of fiscal and monetary stimulus that has been announced in recent weeks, questions around the ability for the loans to be repaid remain front and center.
This is an issue that is not going away, and delaying action will only allow the existing issues to fester. In the end, policymakers and stakeholders will need to work together in order to come up with a viable solution that is acceptable to all parties, as failing to do so could have significant implications for the broader U.S. economy. If there is something wrong with your bathtub, call the plumber; letting it sit there will only lead to bigger issues down the road.
"Orphan" Participants
When a participating employer withdraws from a multiemployer plan they leave behind “orphan” participants. As contributions on behalf of these orphans cease, their cost is ultimately borne by the remaining employers and their participating workers. Departing employers are required to pay a pay a withdrawal liability into the plan to account for their share of any existing shortfall. However, due to the nature of actuarial assumptions used and subsequent funded status declines, these withdrawal payments have frequently proved insufficient. In extreme cases, for example bankruptcy, withdrawing employers may not even be able to pay their full withdrawal liability. Research by the PBGC4 estimates that for the 2015 plan year as many as 24% of participants are orphans. For those plans in the Critical & Declining zone, this figure is 45%.
1 2017 PBGC Data Book: Table M-19, Administrative Expenses per Participant (2009-2016)
2 This represents the maximum guaranteed benefit for a participant with exactly 30 years of service. The guarantee provides 100% of the first $11/month and 75% of the next $33/month benefit times the years of credited service
3 PBGC Mulitemployer Guarantee Study, March 2015
4 PBGC Orphan and Inactive Participants in Multiemployer Plans, 2015 Plan Year Reporting, August 2019 (https://www.pbgc.gov/sites/default/files/orphan-and-inactive-participant-report-final.pdf)
0903c02a828eb651