
The current evolution of the mortgage market
Dhruv Mohindra
$50 Billion. That’s the amount of mortgage credit forecast to be issued to “non-QM” US homebuyers in 2020. That number was Zero in 2015, and grew to about $25 billion in 2019.
Exhibit 1: Non-QM Issuance
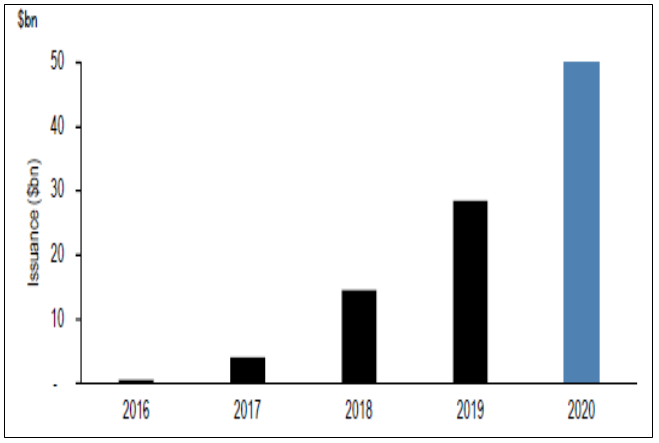
Source: J.P. Morgan, Bloomberg, Intex as 12/31/2019
In the grand scheme of things, some would argue, it’s insignificant. After all, $50 billion is only about 5% of annual origination volume in the entire US mortgage market.
But it’s certainly not insignificant to the 150,000 or so home-buyers who were previously frozen out of the mortgage market, and it’s also a meaningful spigot of cash transmission into the real economy. Housing activity, after all, boosts durable goods spending while mortgage refinancing in a lower rate environment bolsters household balance sheets and purchasing power – particularly so in the case of cash-out refinancings, which are a meaningful portion of non-QM origination. 1
100%. That’s the percentage of articles in the financial press that compare this trend to the loose mortgage lending prevalent in the pre-crisis era. And I’ll bet that’s the same thought you had as you read the above. Go ahead, admit it…no one (except for me) is going to laugh at you. It’s an easy conclusion to jump to, but it is misplaced for several reasons. Here’s why.
1. Mortgage credit has only barely, and only recently, started to loosen. A look at the Mortgage Bankers Association’s Credit Availability Index going back to 2004 shows the abundance of credit preceding the housing bubble, and the minimal expansion of credit post-crisis:
Exhibit 2: Mortgage Credit Availability Index (NSA, 3/2012 = 100)
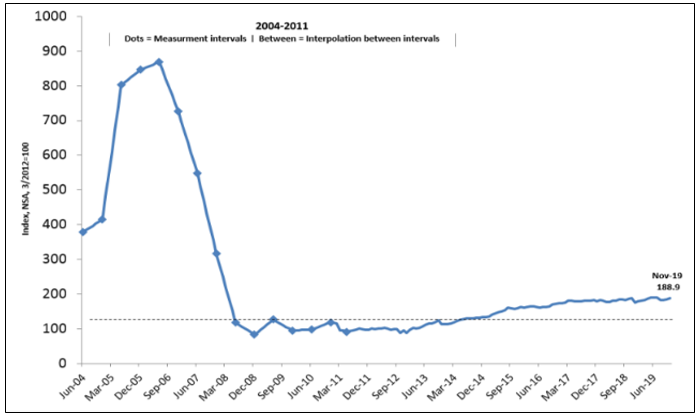
Source: Mortgage Bankers Association as of 12/31/2019
And according to the NY Fed’s most recent estimate, the median credit score of mortgage originations as of 1Q 2019 was 759, with only 10% being extended to borrowers with credit scores below 647. Back in 2007 the median score was around 710 and the lucky bottom 10%, on their journey toward inflicting financial Armageddon upon the rest of us, achieved credit scores around 575.
Exhibit 3: Credit Score at Origination: Mortgages*
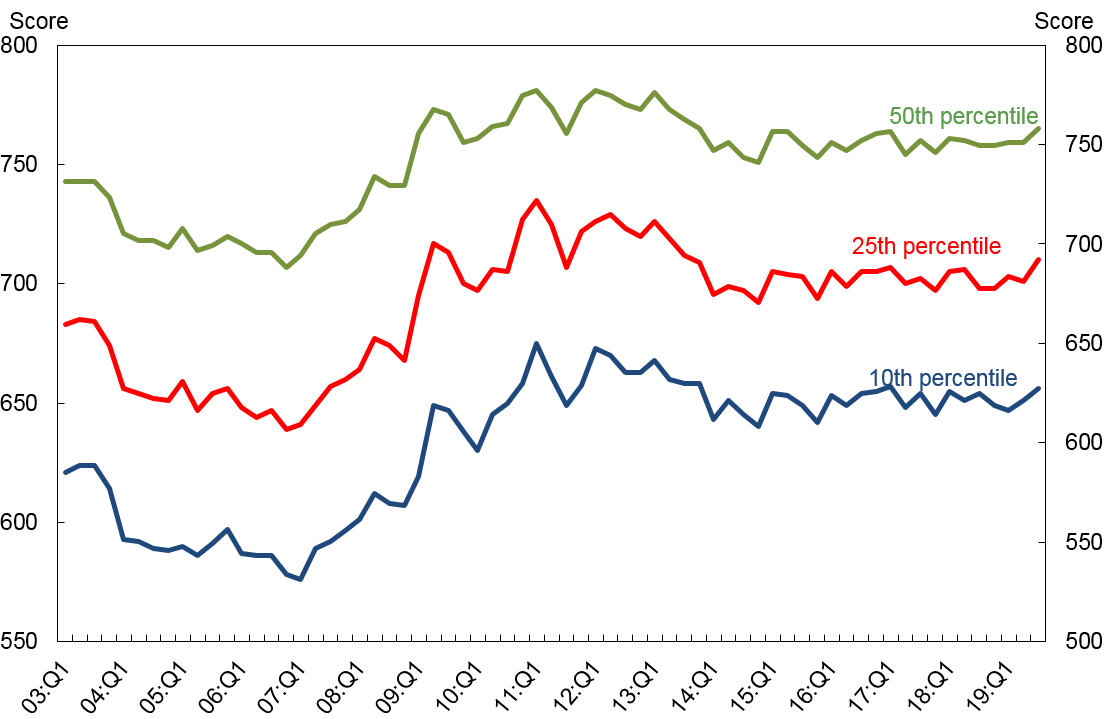
Source: New York Fed Consumer Credit Panel/Equifax, May 2019
* Credit Score is Equifax Riskscore 3.0; mortgages include first-liens only.
Today’s non-QM borrowers typically have credit scores between 700 and 750, as well as documented income, assets and equity in their homes. So it seems to me that we are talking about loans extended to a sliver of the US population that is considered just below “prime” and, additionally, has the compounded misfortune of possessing some other quality frowned upon by Fannie or Freddie. The most common offense, it turns out, is that they derive income from non-W2 sources. In many deals, over 50% of loans are made to self-employed borrowers. And, by the way, knowing that these unfortunate members of the gig economy have nowhere else to turn, lenders are charging 200-300 bps higher than the conforming mortgage rate. 2
Let’s also take a moment to talk about what is NOT happening: Unlike pre-crisis lending, there is still no Subprime or Option Arm Lending. There isn’t any No-Doc lending, and not a whole lot of Interest-Only lending. And perhaps most importantly, there isn’t any 0% down payment (or 20% down-payment entirely funded by a ‘piggyback 2nd lien’) going on. Non-QM lending as of today is essentially LTV-based lending. Studies show that low borrower equity is the largest predictor of default, so the basic premise in this market is that an adequate equity cushion justifies a slightly broader credit envelope.
Bottom line: pre-crisis underwriting was a great deal for borrowers. Todays non-QM lending: uh, not so much.
2. Structural differences make new issue non-QM much stronger than pre-crisis securitization. The comparison table below contrasts current origination trends versus generic Alt-A loan characteristics in 2006.
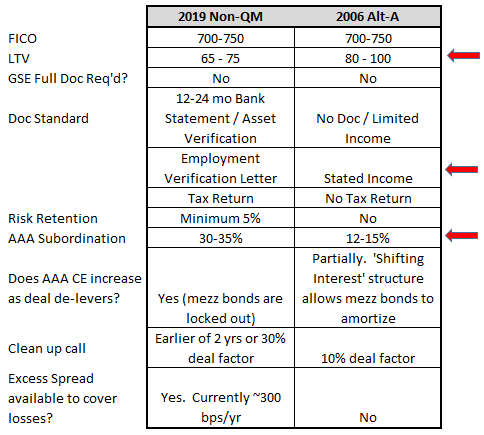
Source: J.P. Morgan 01/22/2019
Of course what jumps out first are the differences in underwriting – namely lower LTV’s and better documentation standards. But just as important are the stronger structural features in today’s securitizations: AAA subordination levels that are over twice as high, plus other nuances like excess spread (which absorbs losses) and issuer risk retention, which should discourage bad behavior. Issuers are also inserting 2 year/30% Call Rights (I’ll get to this in a minute).
Why so many belts and suspenders? It’s because rating agencies have long memories, and they are requiring structures that can withstand 20%+ cumulative losses to protect the AAA notes. Meanwhile, we are thinking 5% cumulative loss is more realistic.
Some-times you need to run complex models to unearth value. Other times you can revert to the good old ‘sniff test’: A bad deal for them (the borrower) is a good deal for us (the lender). Proof to us that the mortgage rate being offered is a bad deal: the prepayment speeds, which have been extremely fast. It’s clear to us that non-QM borrowers are using these loans as short term financing due to their lack of other options, and are pre-paying their loans as soon as they are able to qualify for conventional financing. We are seeing prepayment speeds ranging from 25-40 CPR.
The securitizations are also not a great deal for the issuers given the subordination levels required to achieve AAA ratings. The proof is the investor-unfriendly 2 yr/30% call feature that issuers insist on including in these deals. Why? It tells us that issuers are unable to get the subordination (i.e. Leverage) they would like, so they insist on retaining the option to re-lever these deals as quickly as possible. In practice this is precisely what they are doing, as we are seeing issuers call deals as soon as they are eligible.
Conclusion:
Of course, as investors, we are naturally skeptical and as fixed income investors we are scared of our own shadows. So, as a result, we are carefully watching the underwriting trends in these deals for signs of any worrisome deterioration. We meet with all issuers and try to discern between those who are in it for just the juicy mortgage rates they can charge today, versus those who aspire to be in the mortgage business longer term. We are optimistic about the growth in this space and have thus far been successful in finding relative value opportunities.
And on that note, please indulge me with one more number: Zero. That’s the total amount of losses ever incurred by non-QM bondholders to date.
1 Cash-out refinancings comprise 25% - 40% of recent non-QM deals.
2 Weighted Average Coupon on typical non-QM deals has ranged from 5.5% to 7%, while the conventional mortgage rate is currently around 4%.
What is a Non-Qualified Mortgage (Non-QM Loan)?
After the financial crisis mortgage lenders, having dealt with a deluge of lawsuits, were hesitant to originate new home loans. As a result in 2014 under the Dodd-Frank Reform Act, the notion of a Qualified Mortgage was created in order to help re-start mortgage lending. The idea was that, if an originator underwrote a Qualified Mortgage, they could not subsequently be sued. Some requirements in order to meet this definition include mortgage type (i.e. No “Interest Only” or “Negative Amortization” loans), limits on Debt-to-Income ratio and constraints on origination fees.
A Non-Qualified Mortgage, therefore, is a loan that does not meet the definition of Qualified Mortgage. Most often, these loans are extended to self-employed borrowers whose income is tougher to document and are less predictable than borrowers with W2 income. Other common loan types are investor loans, Interest Only loans and loans to non-US citizens.