Earlier this year we suggested that an underappreciated consequence of Federal Reserve (Fed) balance sheet reduction is the potential for outright shrinkage of bank deposits in the financial system. This effect is one reason that the flow of central bank balance sheets is more important than the aggregate size or stock.* Liquid demand deposits are the de facto medium of exchange in the modern economy, and an ever-expanding medium of exchange is necessary for positive nominal GDP growth over time. So, flat-lining or shrinking supply of deposits is potentially suppressive to economic growth. The prior posts were intentionally light on detail for the sake of simplicity, but in order to more fully grasp Quantitative Tightening’s (QT’s) impact on markets and the economy, here we dive a bit deeper. We need to examine both the relationship between asset purchases, credit growth, and deposit growth, and secondly, the interplay between the respective balance sheets of the Fed, the Treasury, the Private Sector, and the Commercial Banks. In short, whether QT results in deposit shrinkage in the banking system depends on who buys the incremental net supply of Treasury securities, and on the speed of credit creation by the Commercial Banks. In looking at the Treasury’s “extraordinary measures” activity surrounding the debt ceiling deadline, we’re fortunate to have a recent episode of measurable Fed balance sheet activity, for which we have enough public data to reconstruct who did what. We’ll use this experience to show the interactions, and take a view on how QT unfolds.
We start by illustrating stylized sectoral balance sheets in Figure 1: one each for the Fed, Treasury, Private Sector, and Commercial Banks. Panel 1 is the current state, with the Fed balance sheet unchanged, and deposits growing modestly through credit creation. Commercial Banks lend to the Private Sector, which in turn deposits the money back into the banking system. Loans go up (and it is debatable whether supply of credit or demand for credit is driving credit creation), deposits go up, and there may be a small shift in the composition of reserves from excess to required, depending on what kind of deposits are created. Panel 2 is the end result if the Commercial Banking system purchases the entire roll-off of debt from Fed Balance Sheet reduction. For every dollar of net Banking System purchases (importantly, the system as a whole), there is no change in the aggregate Banking System balance sheet size, and no change in deposits. The composition changes though – the Bank balance sheets become incrementally more risky, swapping Reserve assets for term debt. And in Panel 3, we illustrate the impact on balance sheets for Private Sector net purchases. Quite simply, the Private Sector buys bonds for cash, and in aggregate, total system deposits shrink by an equivalent amount.
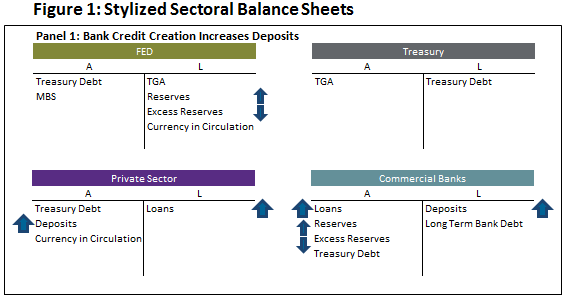
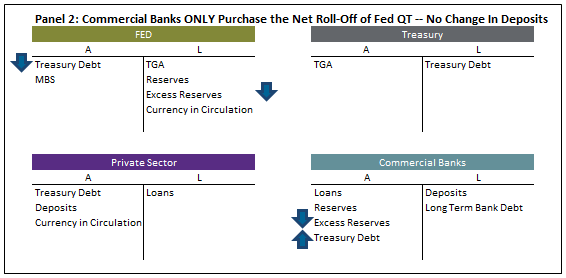
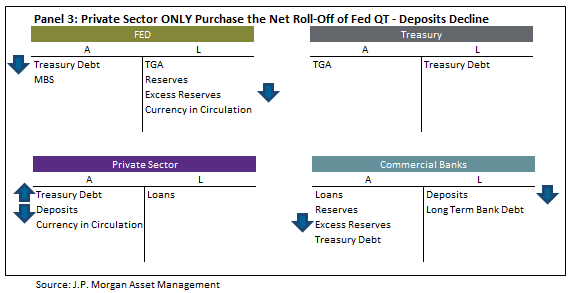
Now, in practice, all three processes run in parallel so the real world result is a mixture. Whether deposits go up or down depends on which effect dominates. Here we admit that we’re still simplifying – there are other effects at play also, some of which become apparent as we look at actual changes in balance sheet composition over the past two months.
In the US financial system, the Treasury does not maintain its primary deposit holdings in the Commercial Banks, but rather it holds them on deposit with the Federal Reserve. The Treasury General Account (TGA) is an asset of the Treasury and a liability of the Fed. The TGA fluctuates as currency enters and leaves the Treasury, which happens for government expenditure, tax receipts, tax refunds, debt issuance, and debt maturities. Importantly, the TGA balance is typically used as a buffer when the US government reaches the debt ceiling limit. Drawing it down is one of the so-called “extraordinary measures” the Secretary of the Treasury may undertake to delay the debt ceiling deadlines. However, because the TGA is a Fed liability, changes in the TGA balance can result in changes in reserve balances, at the same time as changes in net issuance of Treasury securities occurs. So, when the TGA balance increases in a fixed Fed balance sheet regime, reserves and/or RRP must decline, and concurrently “extra” Treasury bond net issuance must be absorbed by some combination of Commercial Banks and the Private Sector. This is similar to the mechanism of QT.
Over the six-week period from September 8, 2017 to October 20, 2017, the Treasury increased the TGA from $39bn to $196bn, for a net gain of $157bn, plus another $7bn of increased Currency in Circulation. These were partially offset by a small QE operation of $18bn by the Fed during this time, for a net reserve drain of $139bn. This action by the Treasury was to replenish the general account following the drawdown leading into the debt ceiling impasse in early September.
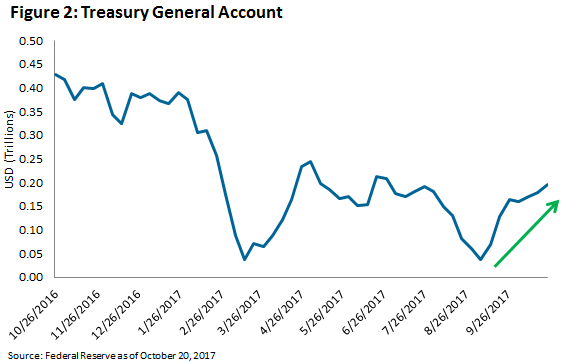
A $139bn reserve drain over the course of 42 days is the equivalent of a $1.2 trillion annualized pace. This is double the pace the Fed says will be their eventual maximum speed of balance sheet shrinkage, and coincidentally almost exactly 10x the initial pace which is underway now. So this is QT in fast-forward. Wading through various data releases by the Fed and the Treasury, we’re able to recreate the impact on deposits.
In order to increase the TGA by $157bn, the Treasury received $46bn in tax revenue, and issued $112bn in net new securities. Of these, the Private Sector purchased $100bn, or about 90%. By itself, this would have the effect of shrinking deposits by $100bn as in Panel 2 of Figure 1, but this was partially offset by credit creation of $53bn in net new lending by the Commercial Banks. In total, deposits shrank by $51bn, because the private sector dominated absorption of new issuance, and because credit creation was not quick enough to offset it. The changes in sectoral balance sheet composition are given in Figure 3.
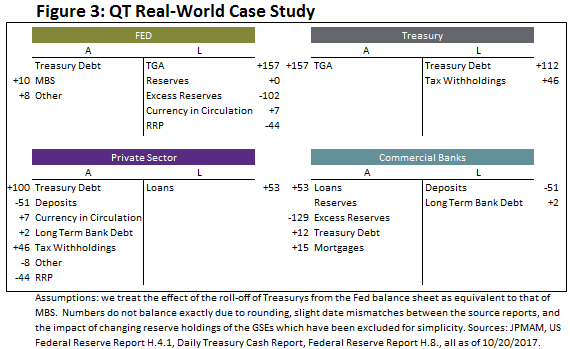
Our expectation is that Fed Balance Sheet roll-off will also be primarily absorbed by the Private Sector. The Commercial Banking system is by definition in balanced supply and demand for reserves versus other riskier (and yieldier) assets on their balance sheets. Any incremental bank who wishes to swap reserves for Treasurys, MBS, or Loans has done so. Preferences and prices may change, and as the size of their aggregate balance sheets shrinks with reserve drain, risk profiles may improve, but initially we expect private sector dominance. Estimates of the composition of asset sales to the Fed during the QE phase also suggest the Private Sector supplied the majority.
The good news is that this reserve drain happened without anything breaking. The process did correspond closely to two significant market events: the recent 35bp sell-off in 10-year yields, and a marked counter-trend strengthening in the USD. However, stocks of course continued higher and credit spreads tightened such that in aggregate, the impact on financial conditions indices was to shift from actively loosening to basically flat. This is encouraging insofar as we are concerned about a more severe theoretical impact of shrinking deposits, and deposits shrunk. While it’s a stretch to say the TGA rebuild is “the same” as QT, it has notable similarities and the liquidity drain looks real to us. So we think this episode should be an indication of the early impacts of QT at least while central bank balance sheets are still expanding elsewhere.
*See: Printing versus Burning and Stock, Flow, or Impulse?.
