In Brief
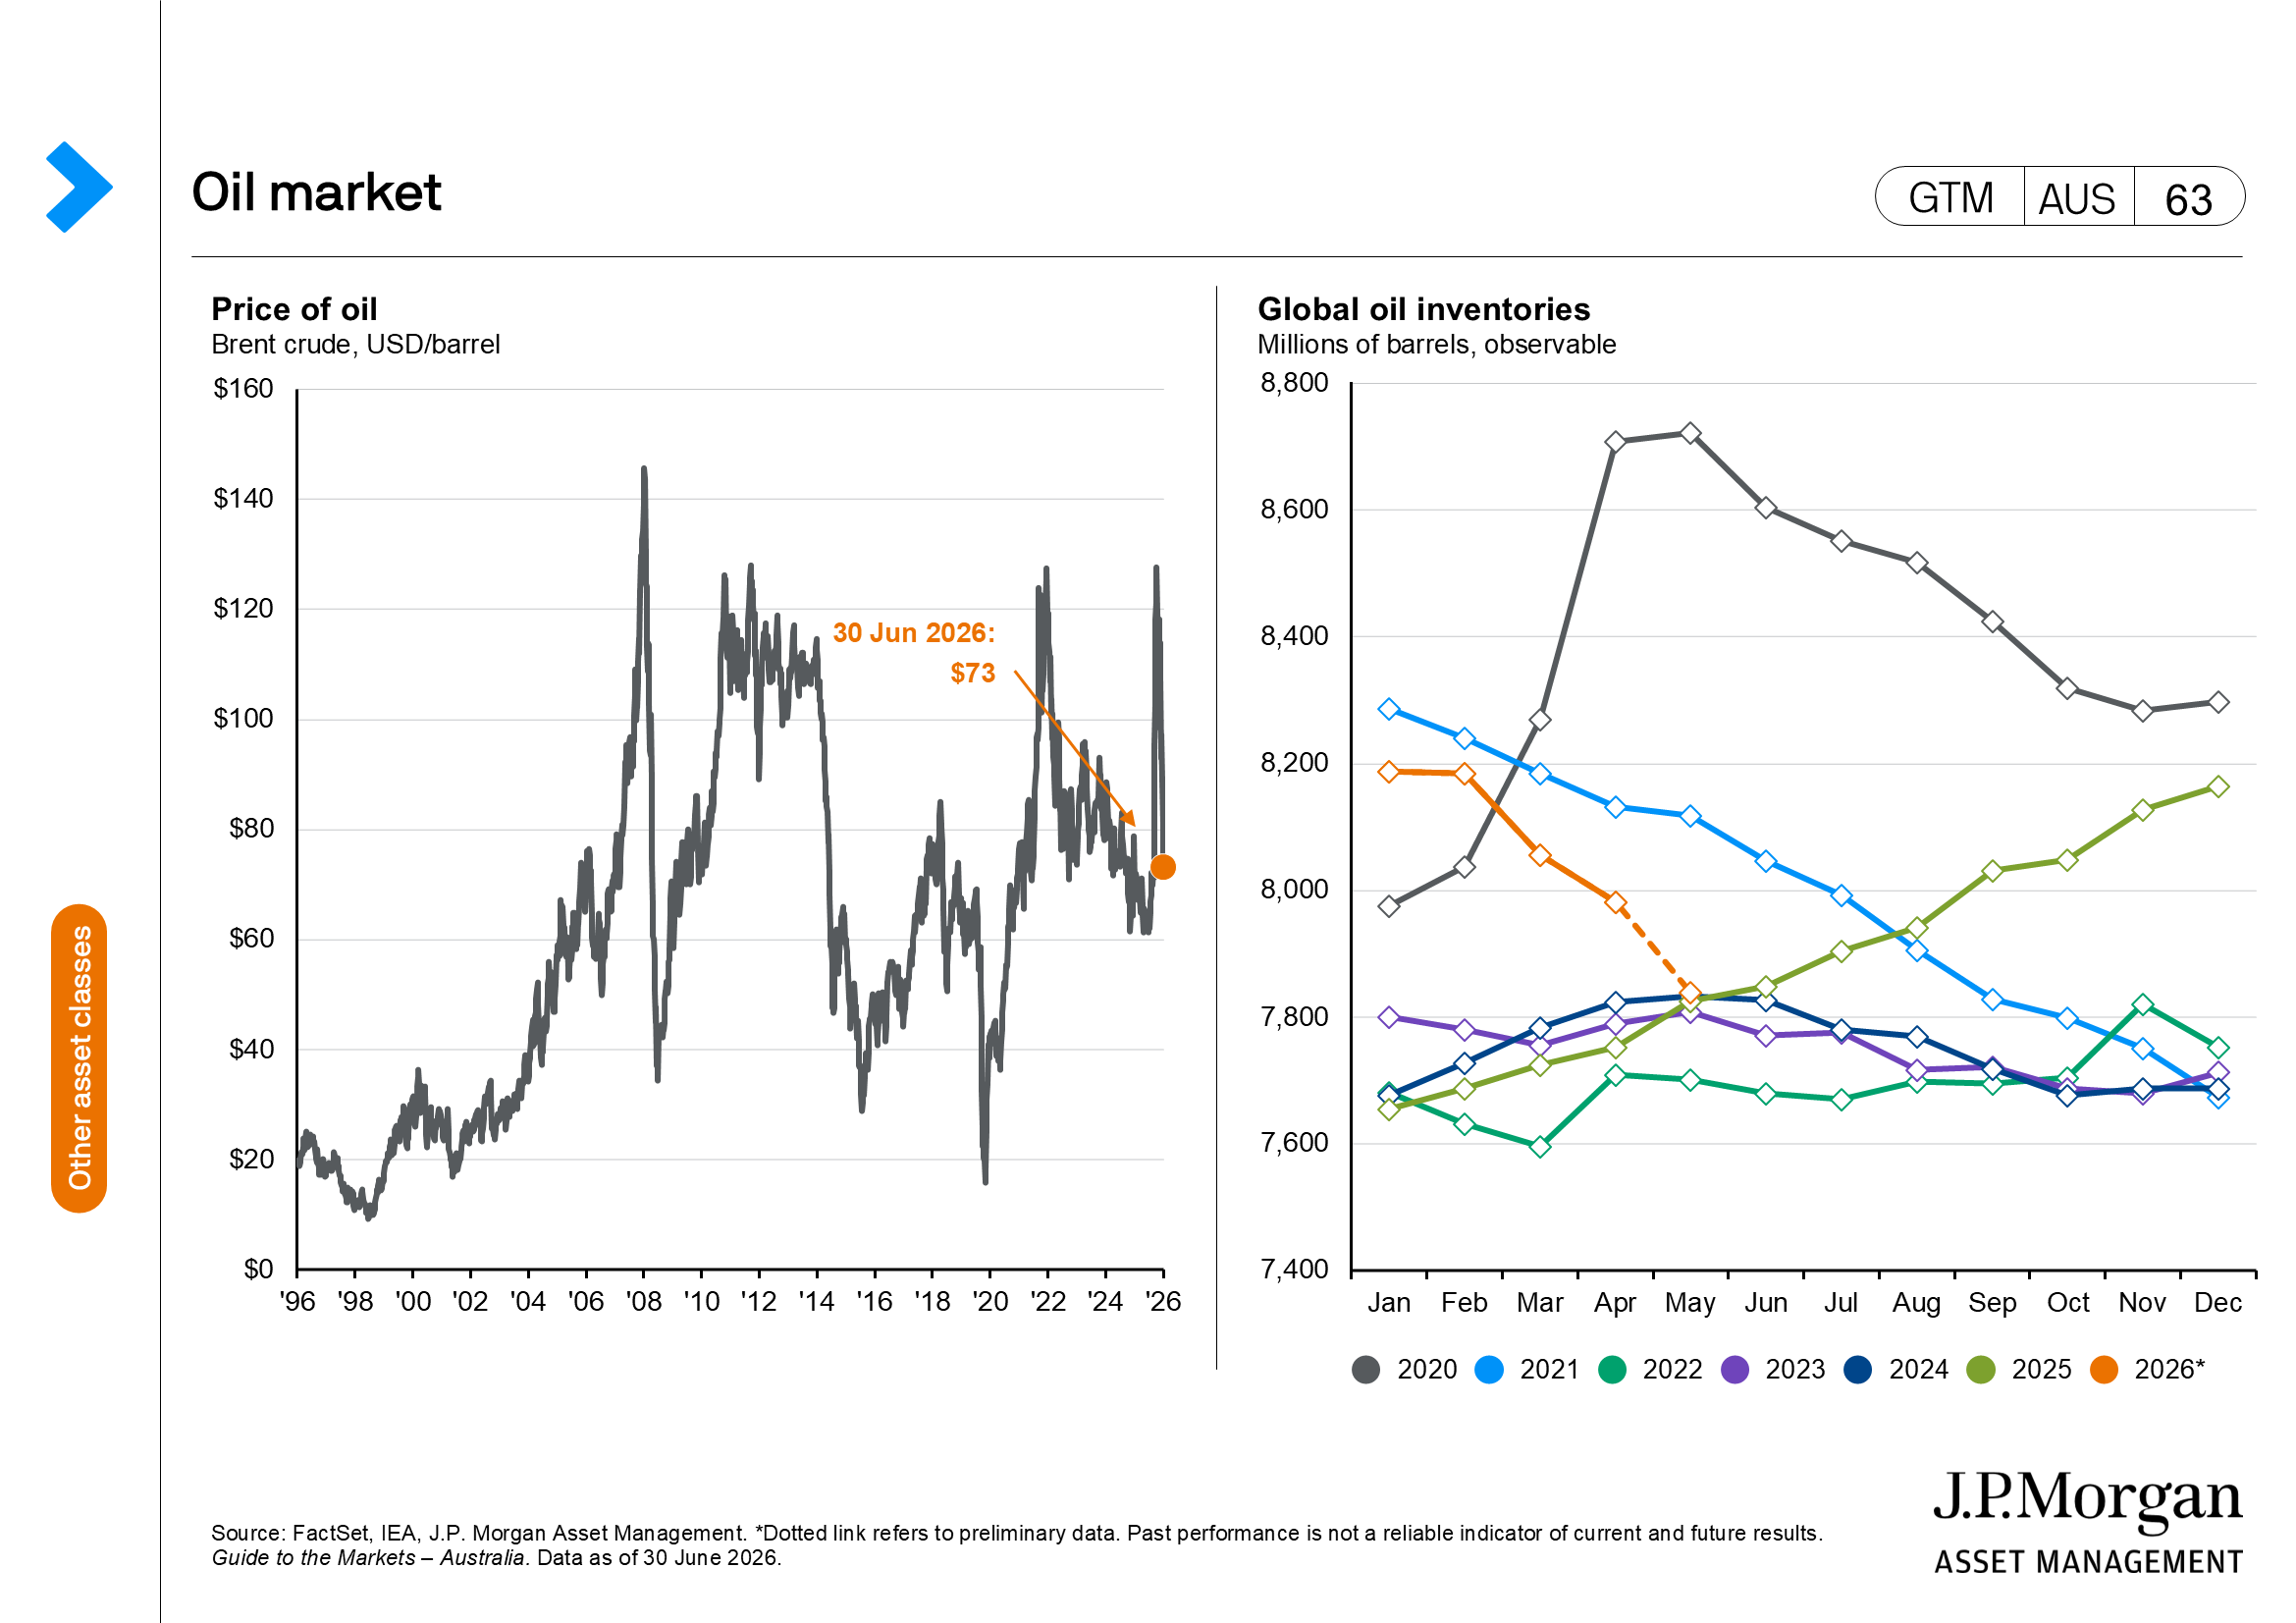
- Geopolitical risks eased and markets responded positively. Progress toward a U.S.–Iran agreement and a reduction in energy supply concerns drove a sharp decline in oil prices.
- Global growth remained resilient despite uncertainty. Strong U.S. labour market data reinforced confidence in economic growth and corporate earnings. However, equity leadership is being challenged, creating volatility. The broadening in equity performance is a positive development for investors.
- Central bank policy and inflation remained key market themes. Developed market central banks maintain a firmer policy bias, but much of the anticipated tightening is already reflected in asset prices.
The geopolitical risk premium unwound in June as the U.S. and Iran signed a memorandum of understanding (MoU) that reopened the Strait of Hormuz and resulted in increased shipping traffic through the waterway, pushing oil and gold prices lower. Meanwhile, the first Federal Open Market Committee (FOMC) meeting under the new Chair Kevin Warsh, led to a hawkish repricing of the rates outlook, which was a fresh source of volatility for the bond market. Beneath the noise, U.S. growth and labour market data held up better than expected, dispelling some of the stagflationary concerns.
The big unwind
The price of Brent crude had already fallen 17% from its USD 114 per barrel peak by the start of June, and once the MoU between the U.S. and Iran was signed, the price kept falling. By the end of June, a barrel of Brent crude traded at USD 73, which was only 2% higher than the price on 27 February when the conflict began. This fast move back to near pre-conflict levels reflects the glut of oil that was waiting to exit via the Strait of Hormuz, but also the decline in demand from key markets such as China and the continued draw on reserves over the past three months.
The signing of the MoU is only the first step in what is likely to be a protracted period of negotiations, and there remain many questions about how the Strait will be controlled during the period of talks and in the longer term. This means the market and economic risk will centre on the execution of any deal. Even if the Strait is technically open, insurers and shipping companies must be convinced the route is safe. Insurance premiums may remain elevated; this could slow any normalisation in energy markets.
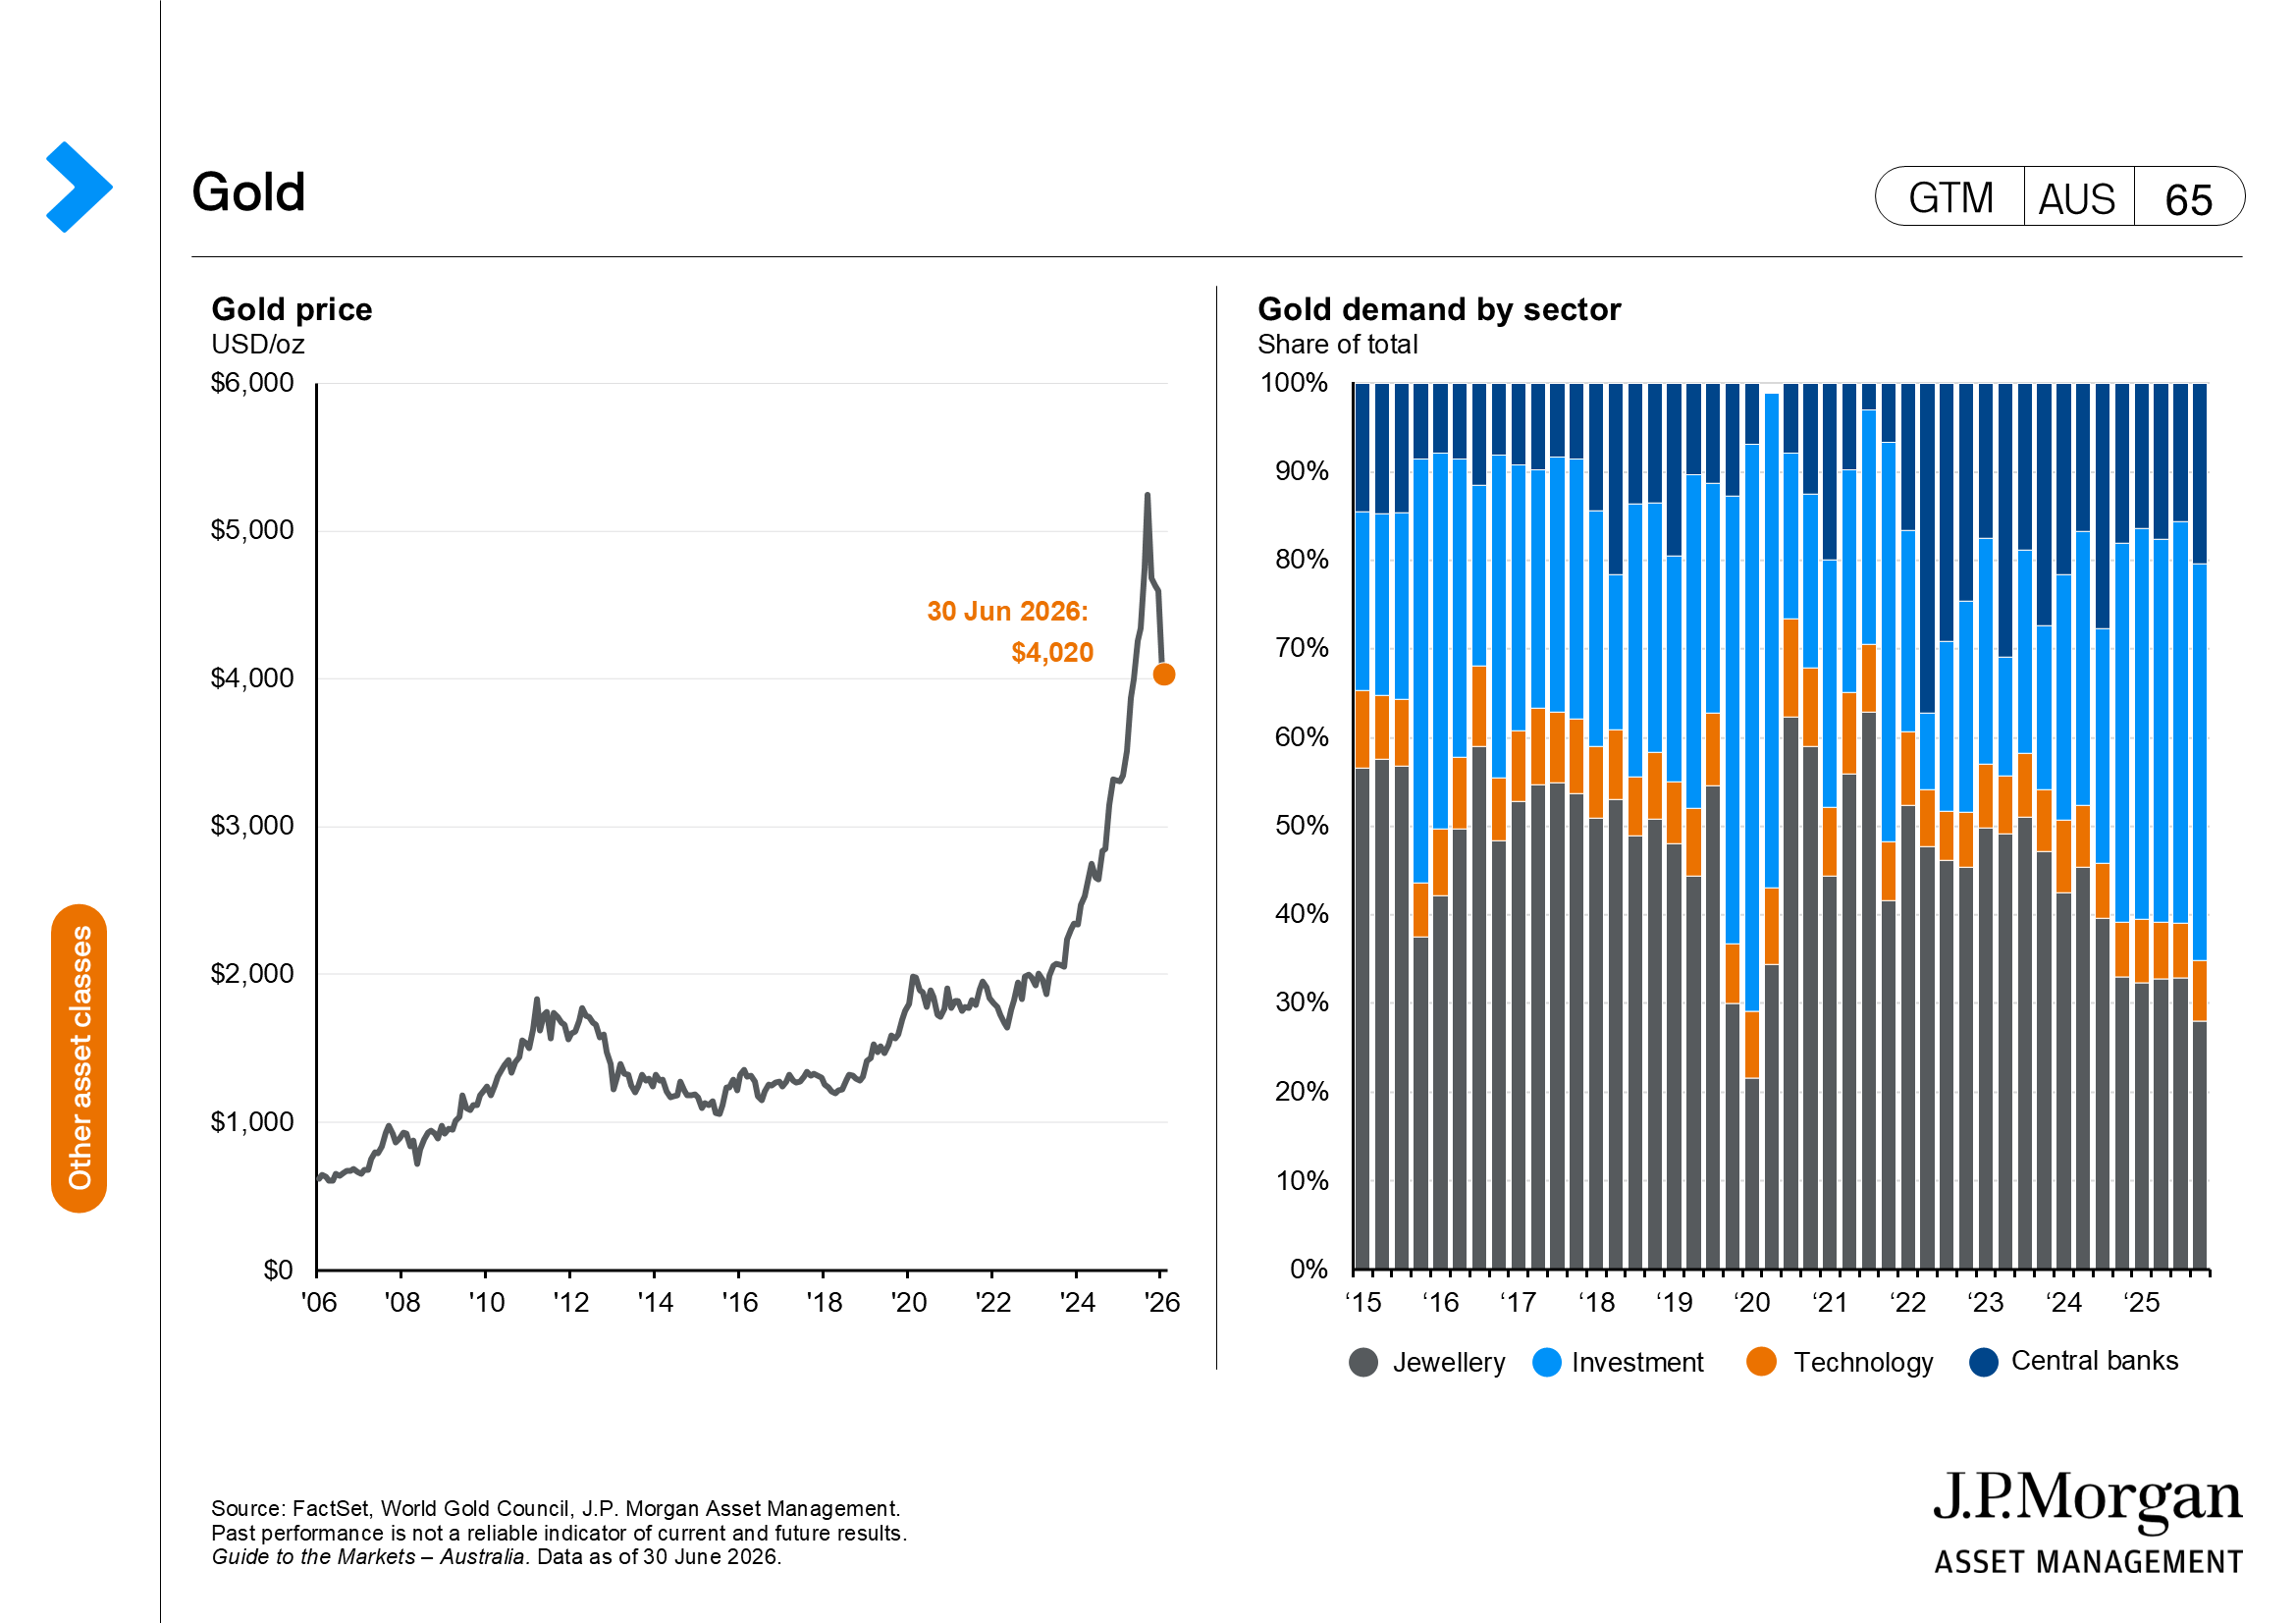
Gold peaked at USD 5,354 per troy ounce in January but was at USD 4,020 by the end of June. The declining geopolitical tail risk is one reason for the price decline; profit-taking is another, as is the rise in the U.S. dollar. However, it is the reassertion of the relationship between gold prices and real rates that is a larger reason for the move. Income-providing assets look relatively more appealing than gold when real rates are on the rise, as some income is better than no income. However, there still appears to be demand from central banks as they diversify their holdings and from investors seeking additional forms of protection in portfolios, which may limit how far the price can fall.
There’s a new Chair in town
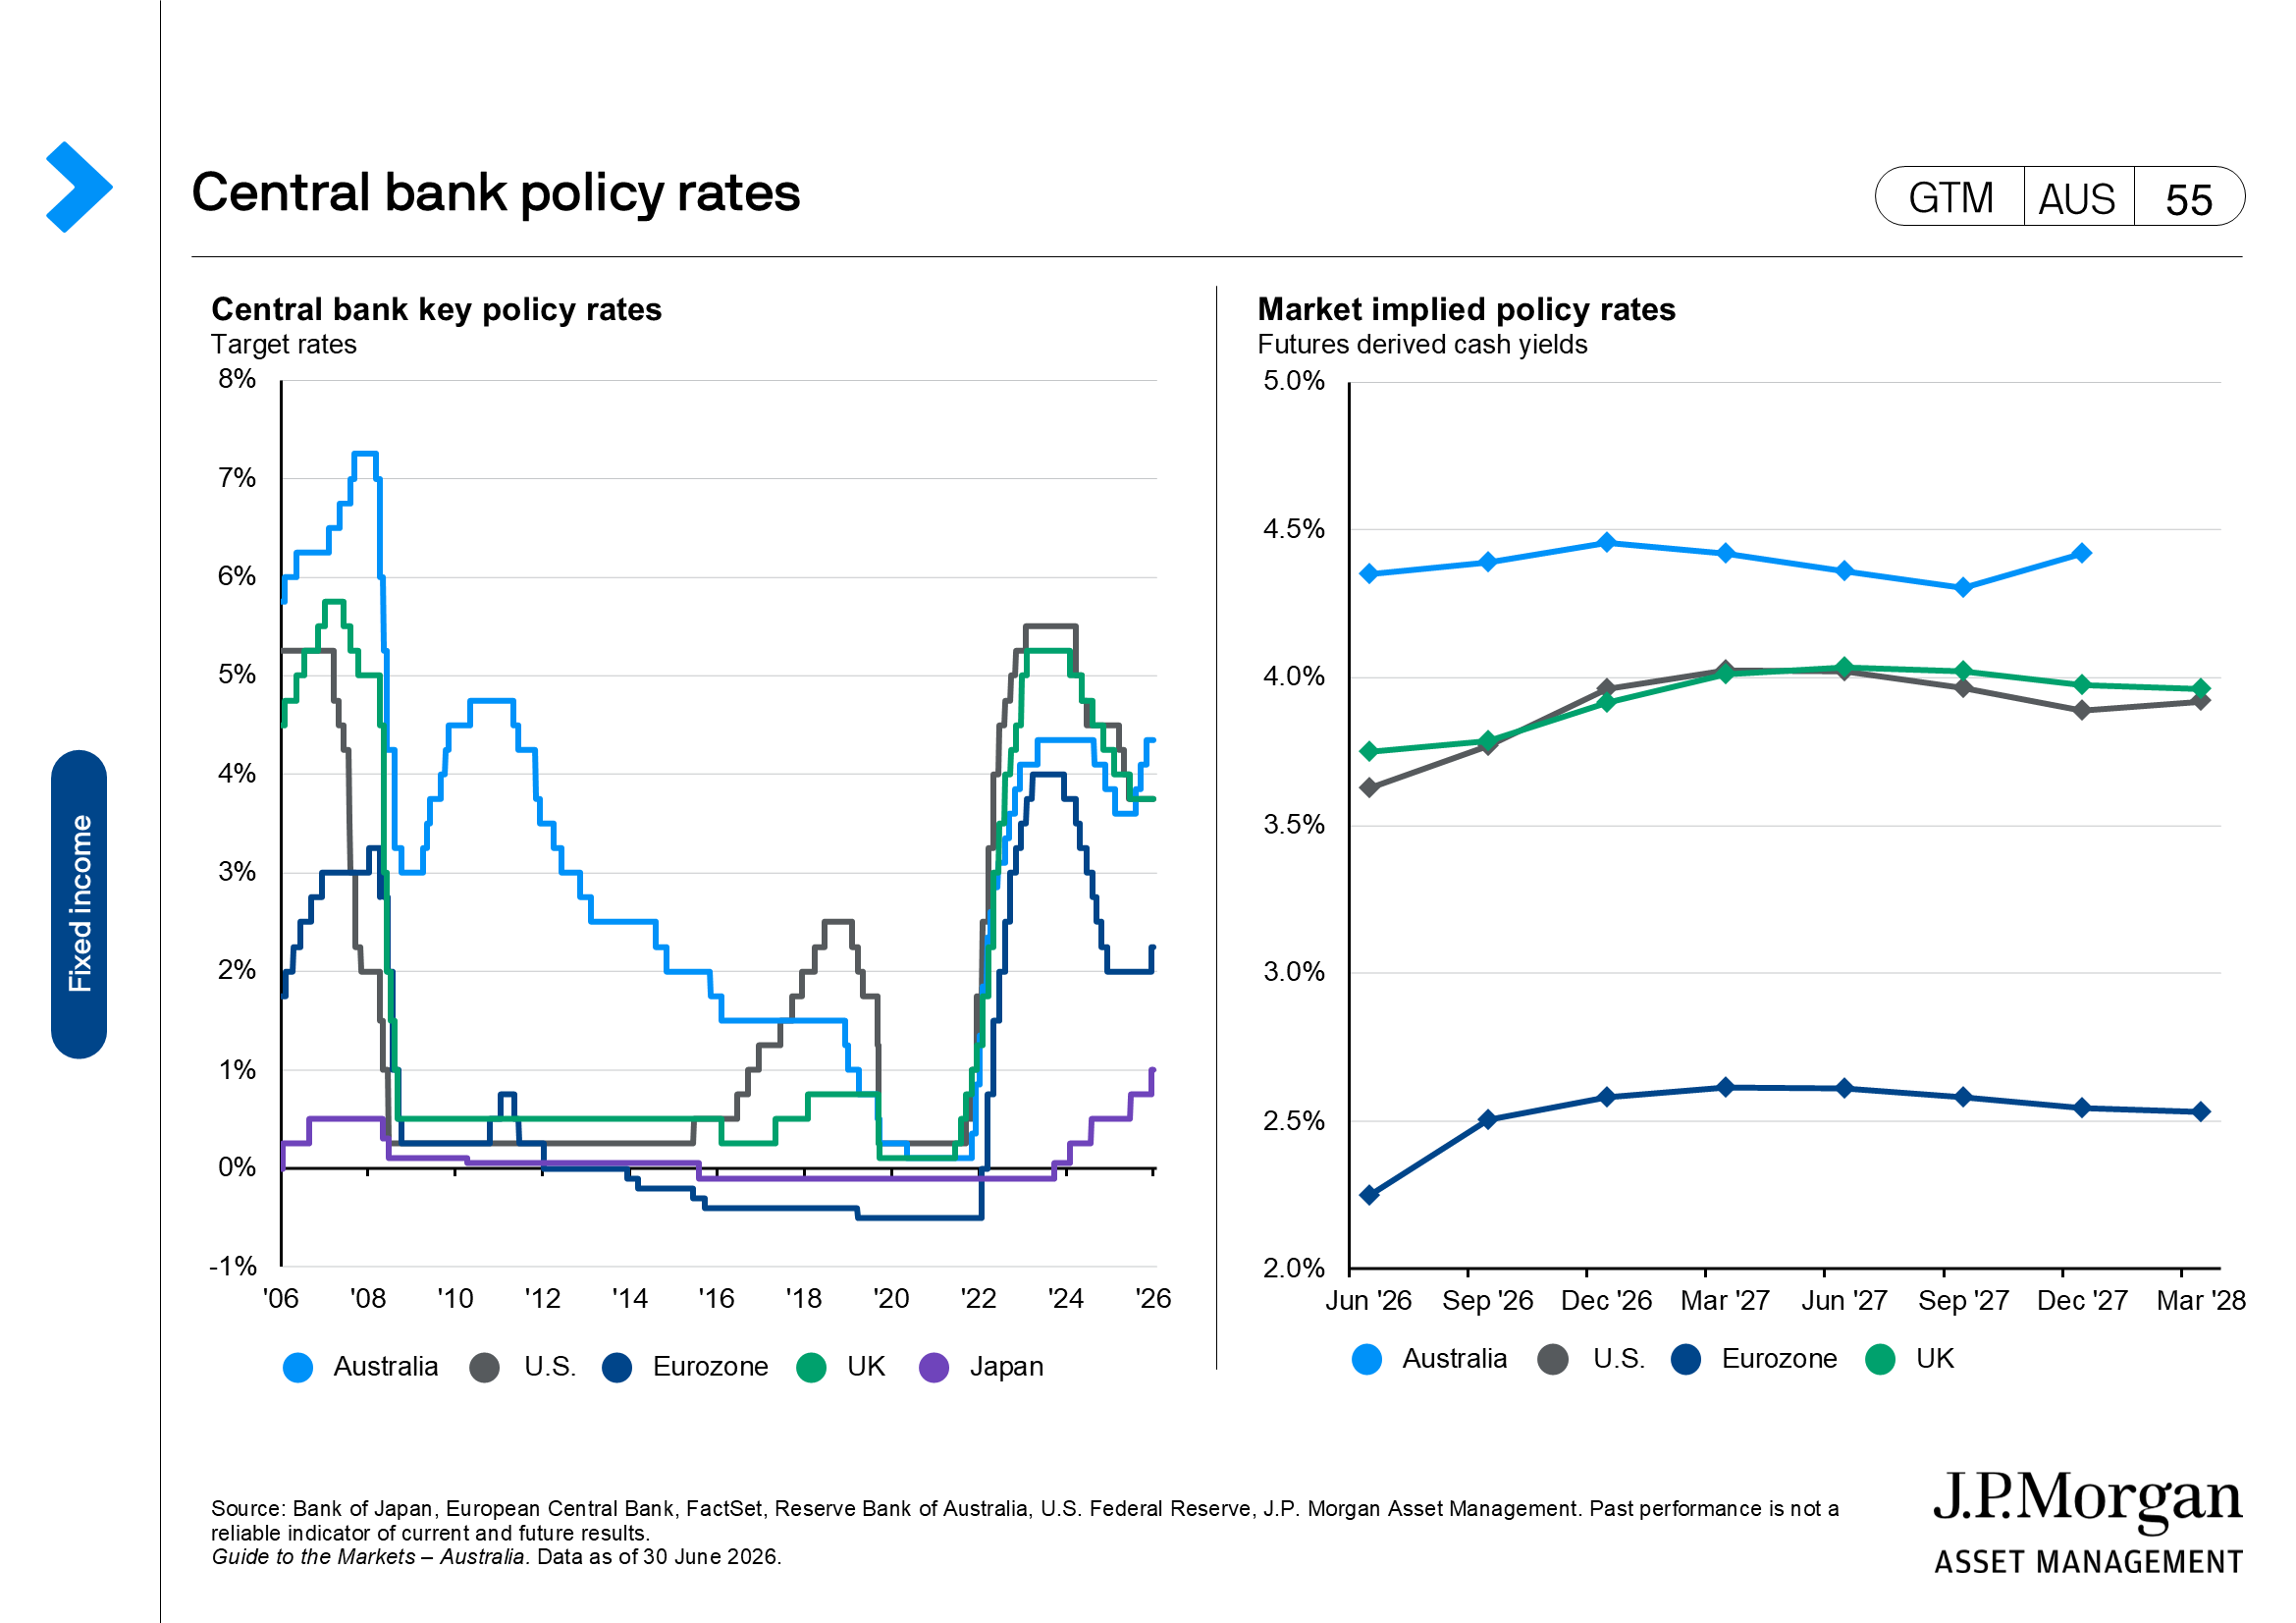
The first FOMC meeting under new Chair Kevin Warsh led to several changes, but the policy rate was not one of them, as the federal funds rate was left in the 3.50–3.75% range. For markets, the most notable was the removal of the dot plot, which previously signalled rate cuts, and the addition of a rate hike for this year.
This was a hawkish surprise relative to views coming into the meeting. Rates and equity markets absorbed this awkwardly: the S&P 500 fell to an intra-month low on 26 June before staging a late recovery. Shorter-dated Treasuries told a similar story, as the yield on two-year U.S. bonds rose 15 basis points (bps). However, at the very long end of the curve, the 30-year yields fell and perhaps signalled that Chair Warsh would do what is required for the economy, and not the White House.
How the U.S. Federal Reserve (Fed) communicates from here is key. The June statement was cut in half, and any semblance of forward guidance was removed. A new task force will assess how the Federal Reserve communicates in the future. Chair Warsh’s unfavourable view on the dot plot is widely known.
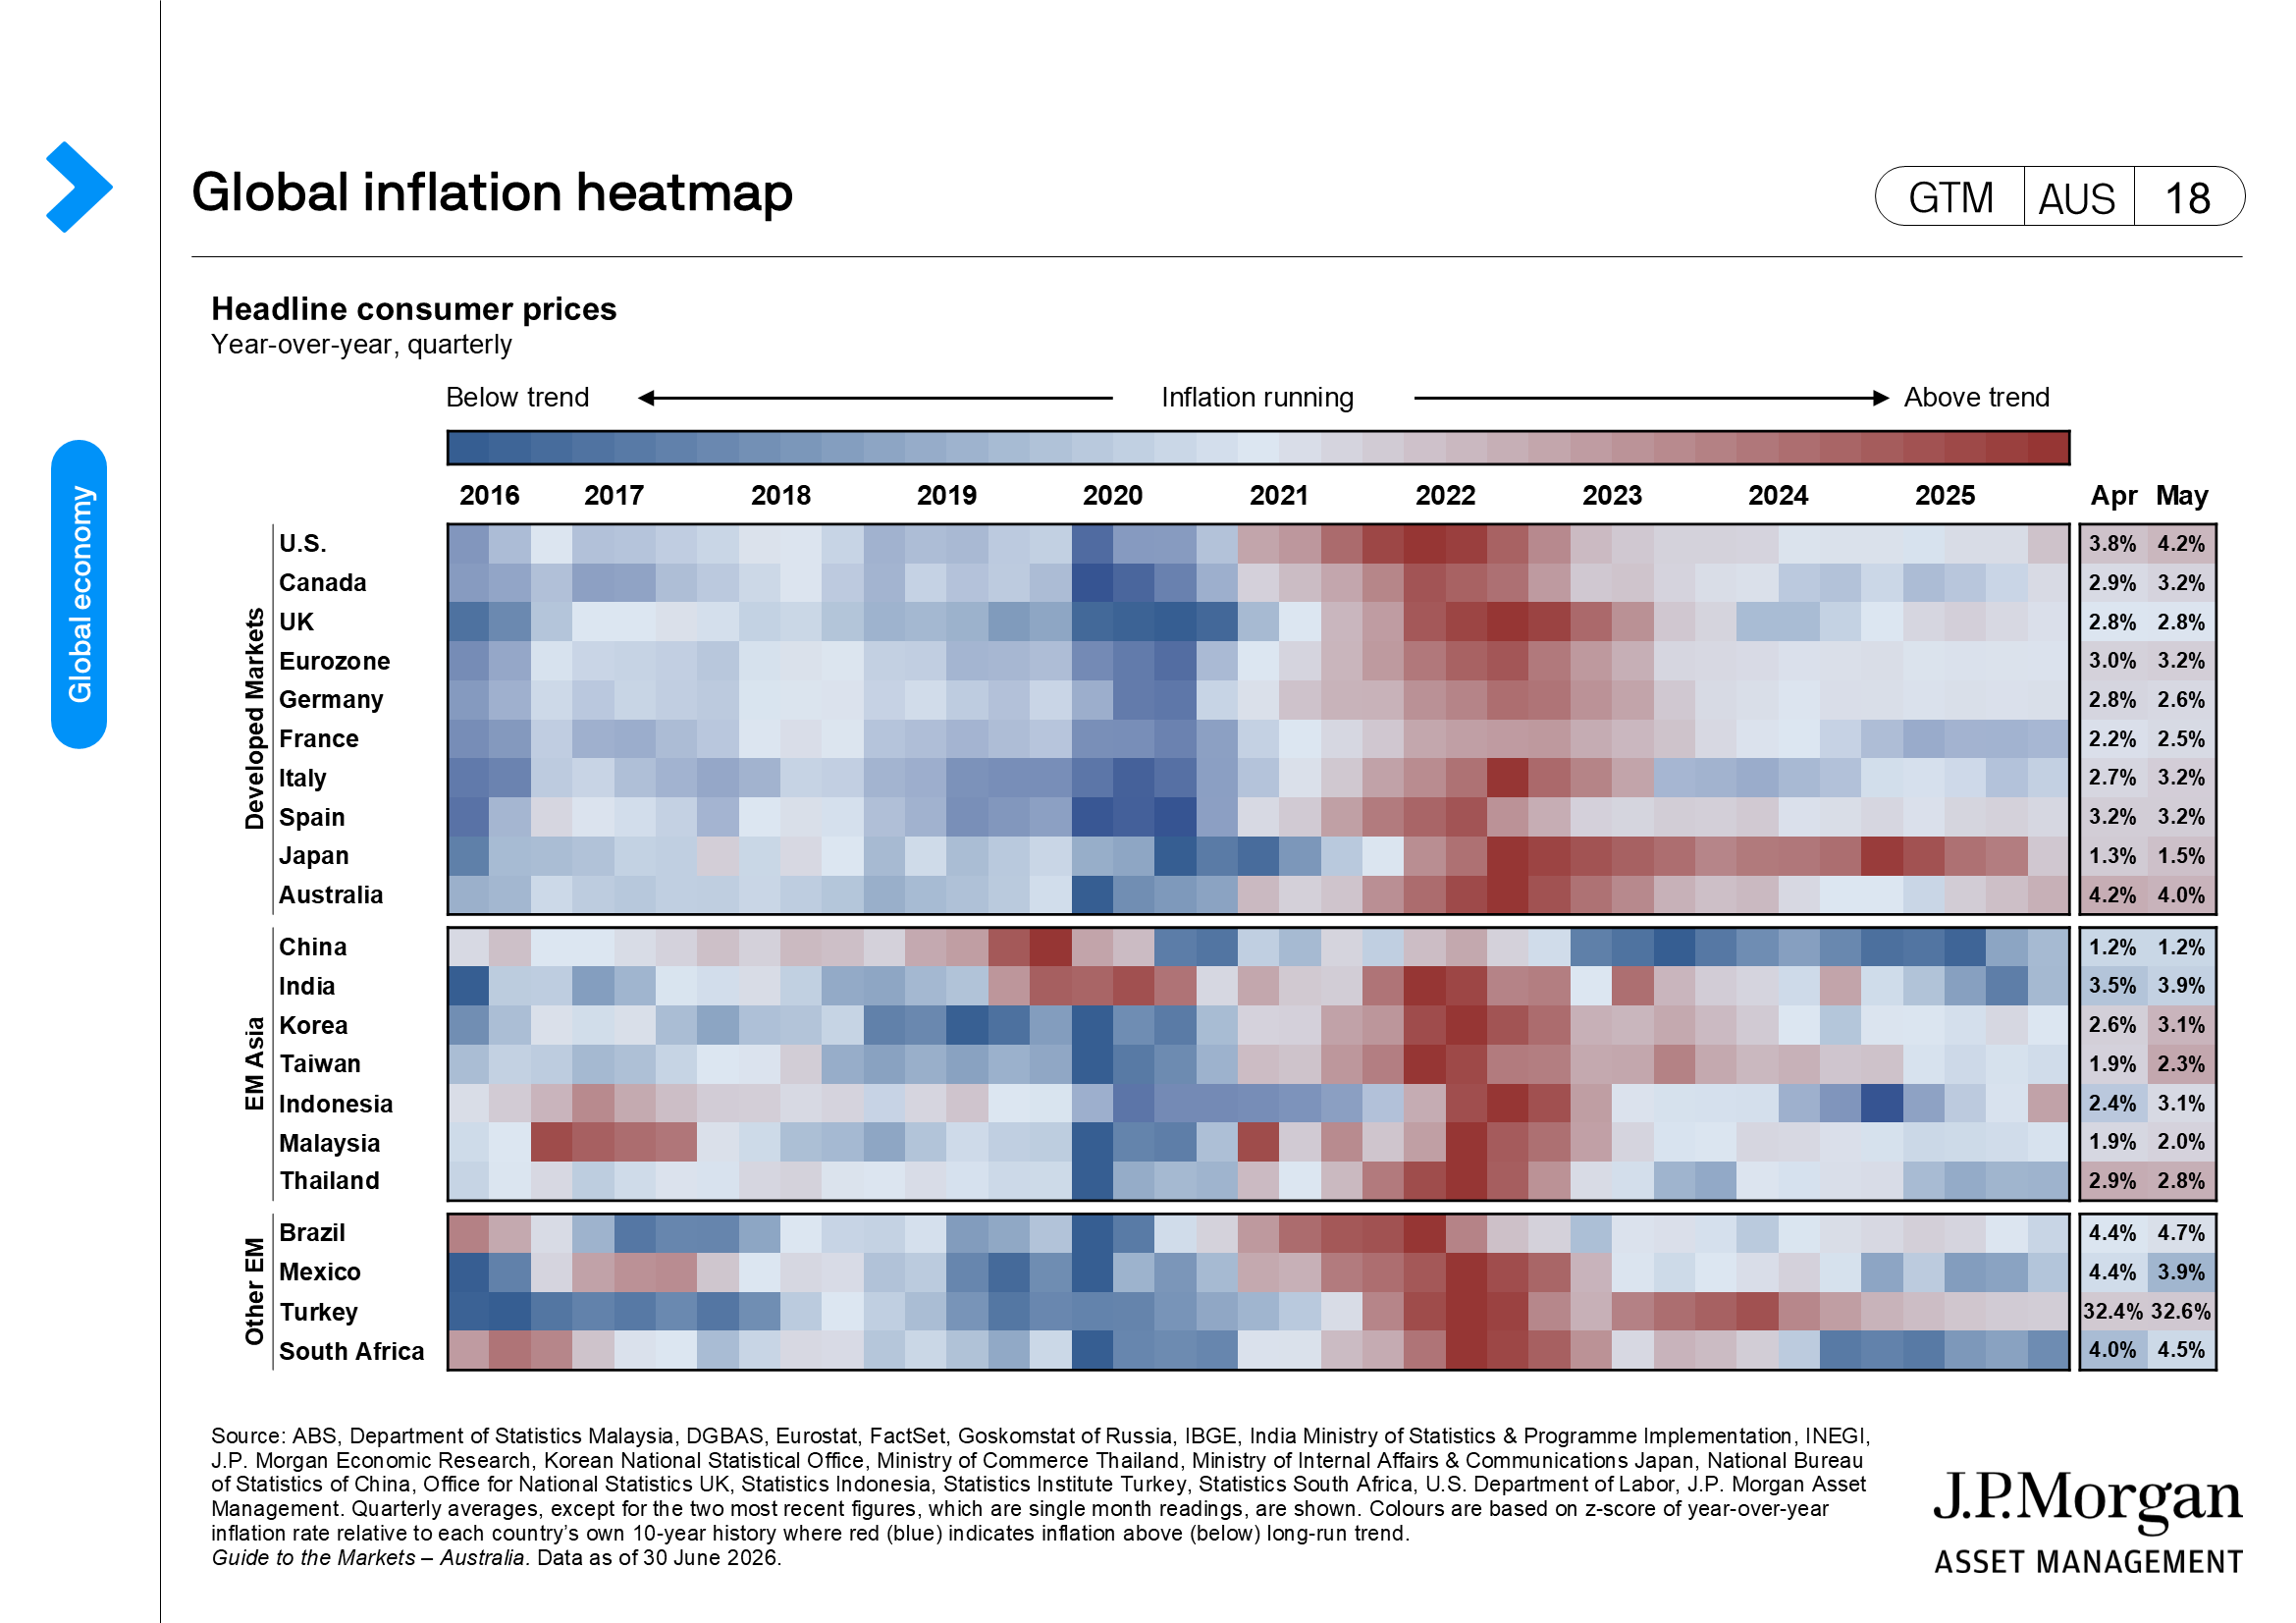
The net effect of the Federal Reserve on the market was a round trip for U.S. assets, as the Fed repricing created a mid-month air pocket rather than a big deterioration in corporate or economic fundamentals. The first-quarter real gross domestic product (GDP) figure was raised to 2.1% quarter-over-quarter (q/q) seasonally adjusted annual rate and perhaps sat a little awkwardly against the rise in personal consumption expenditure (PCE) inflation to 4.1% year-over-year (y/y) for May, and 3.4% y/y for core inflation. However, this will likely be the high-water mark for inflation given the collapse in energy prices in June. Better growth and a disinflationary impulse will renew focus on the continued growth in employment in the U.S. and the potential for wage-driven inflation.
Asia tech-led volatility
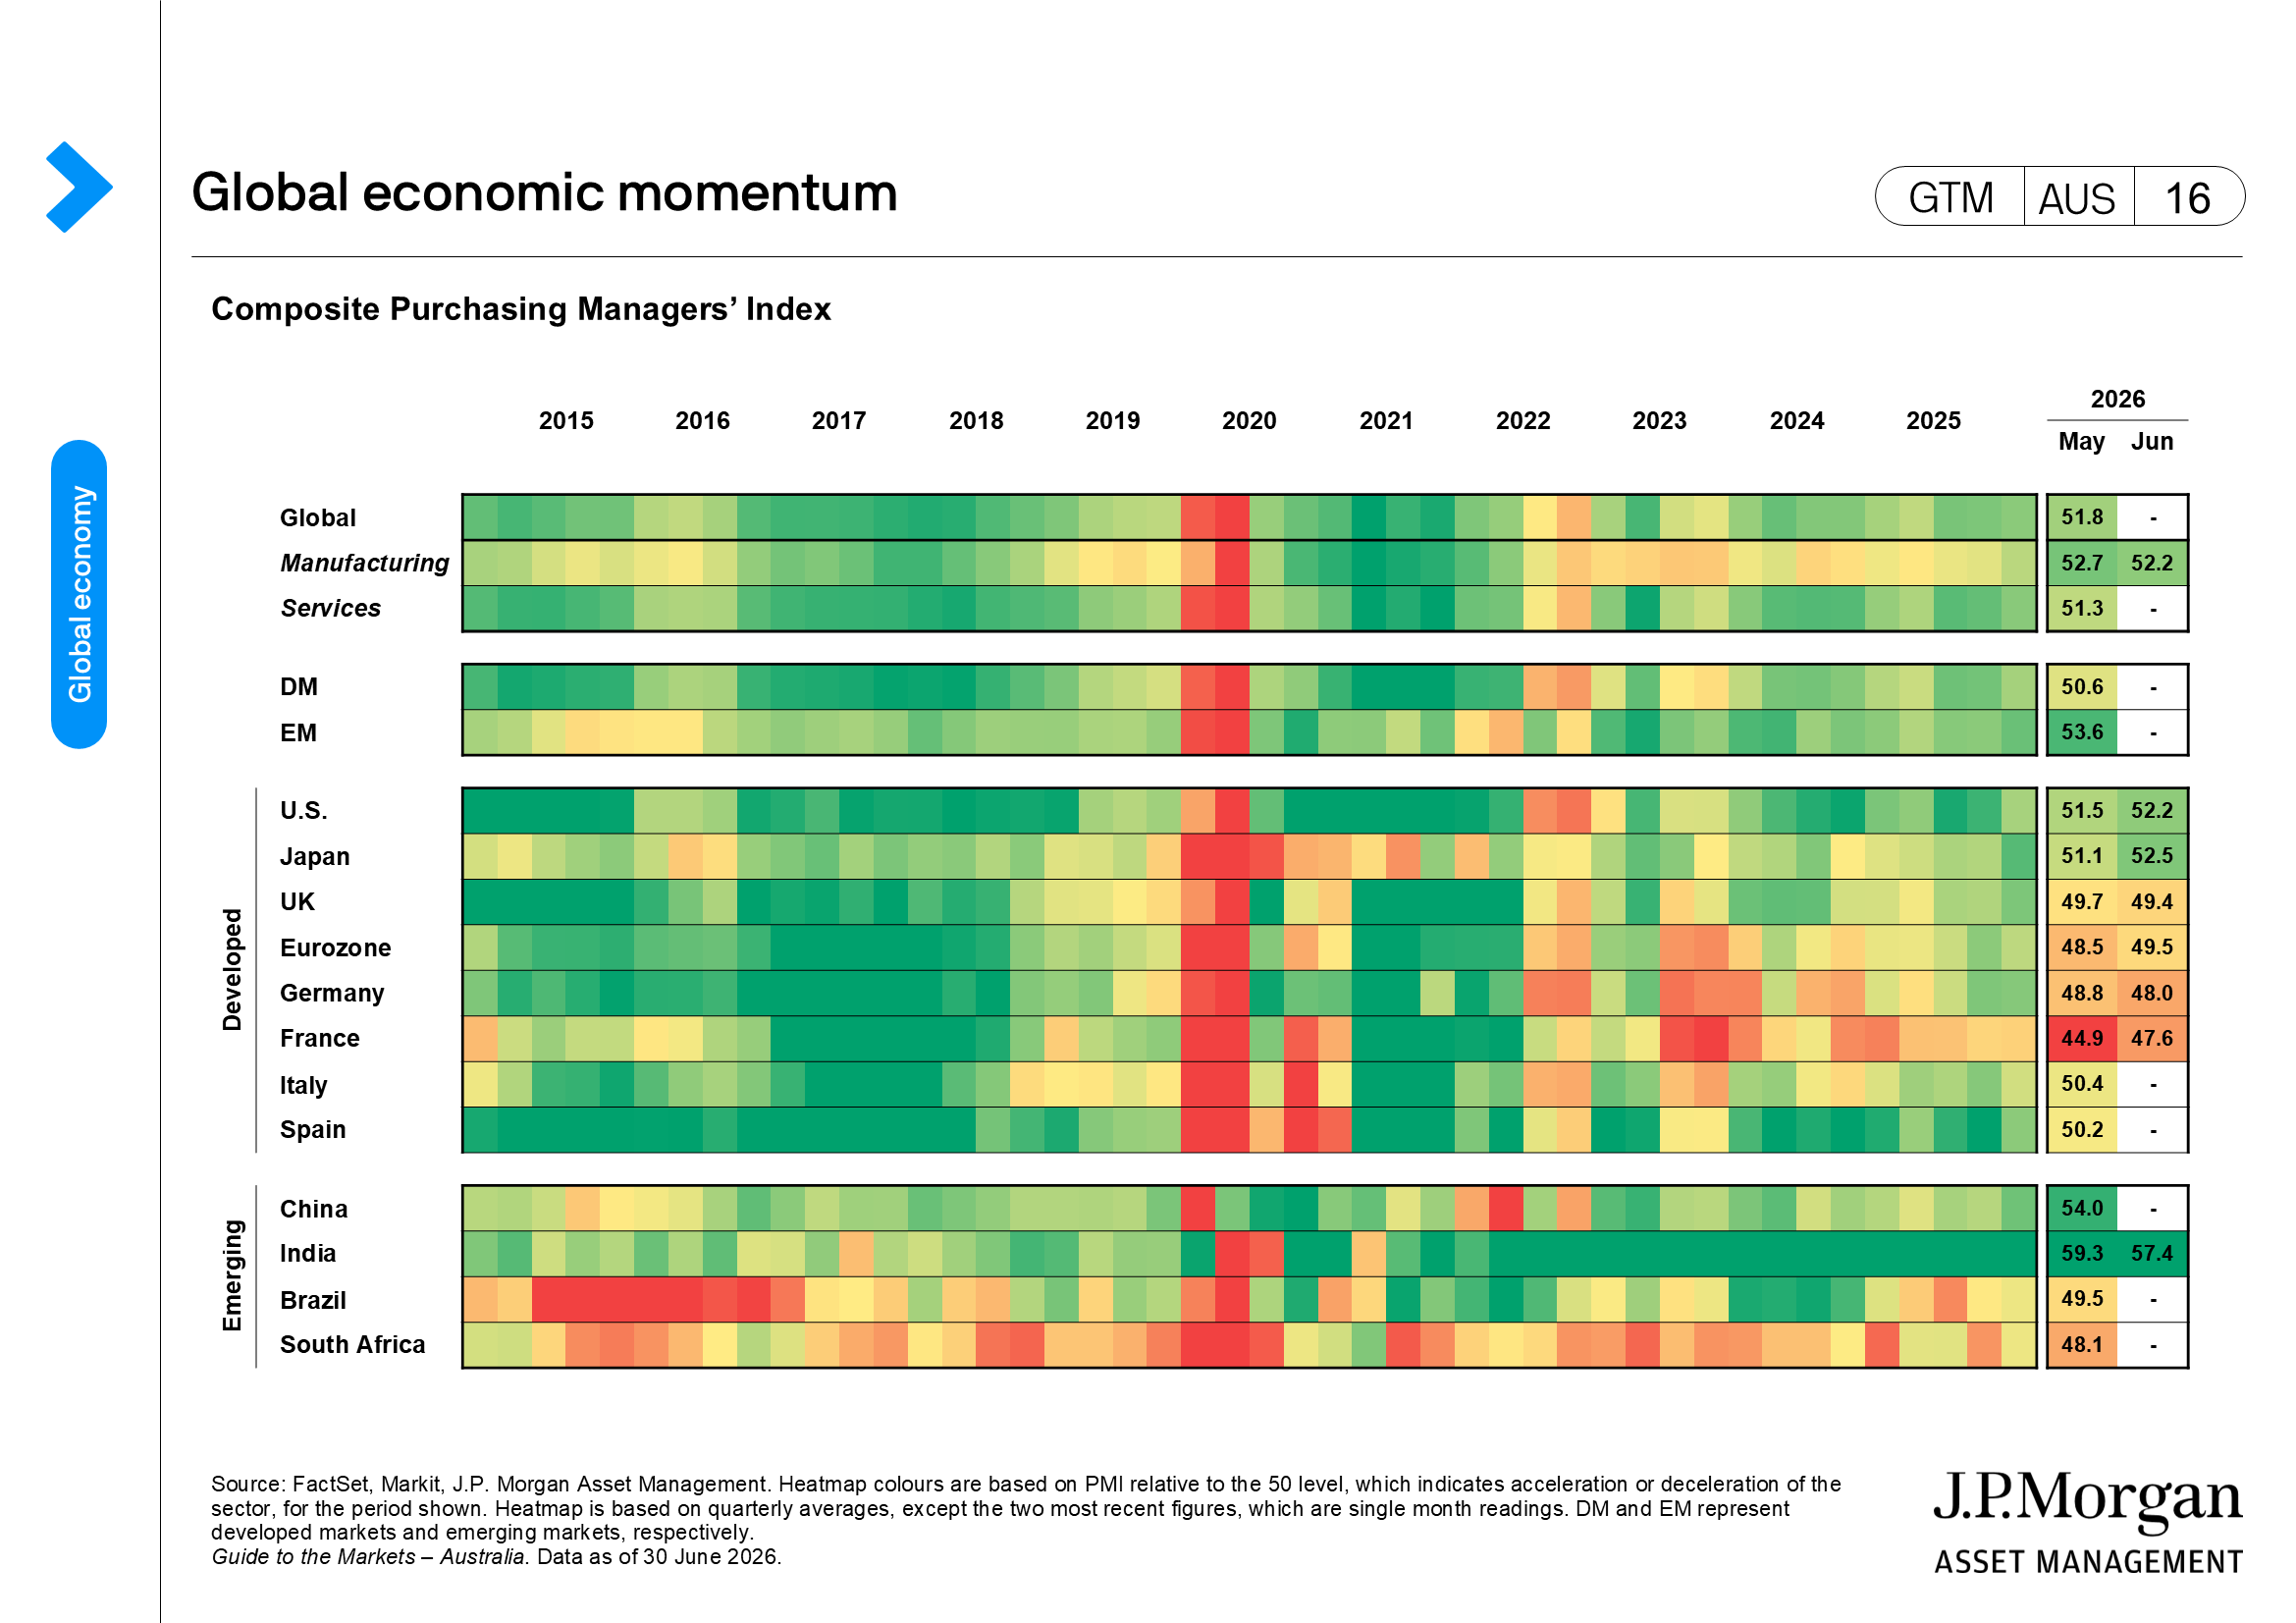
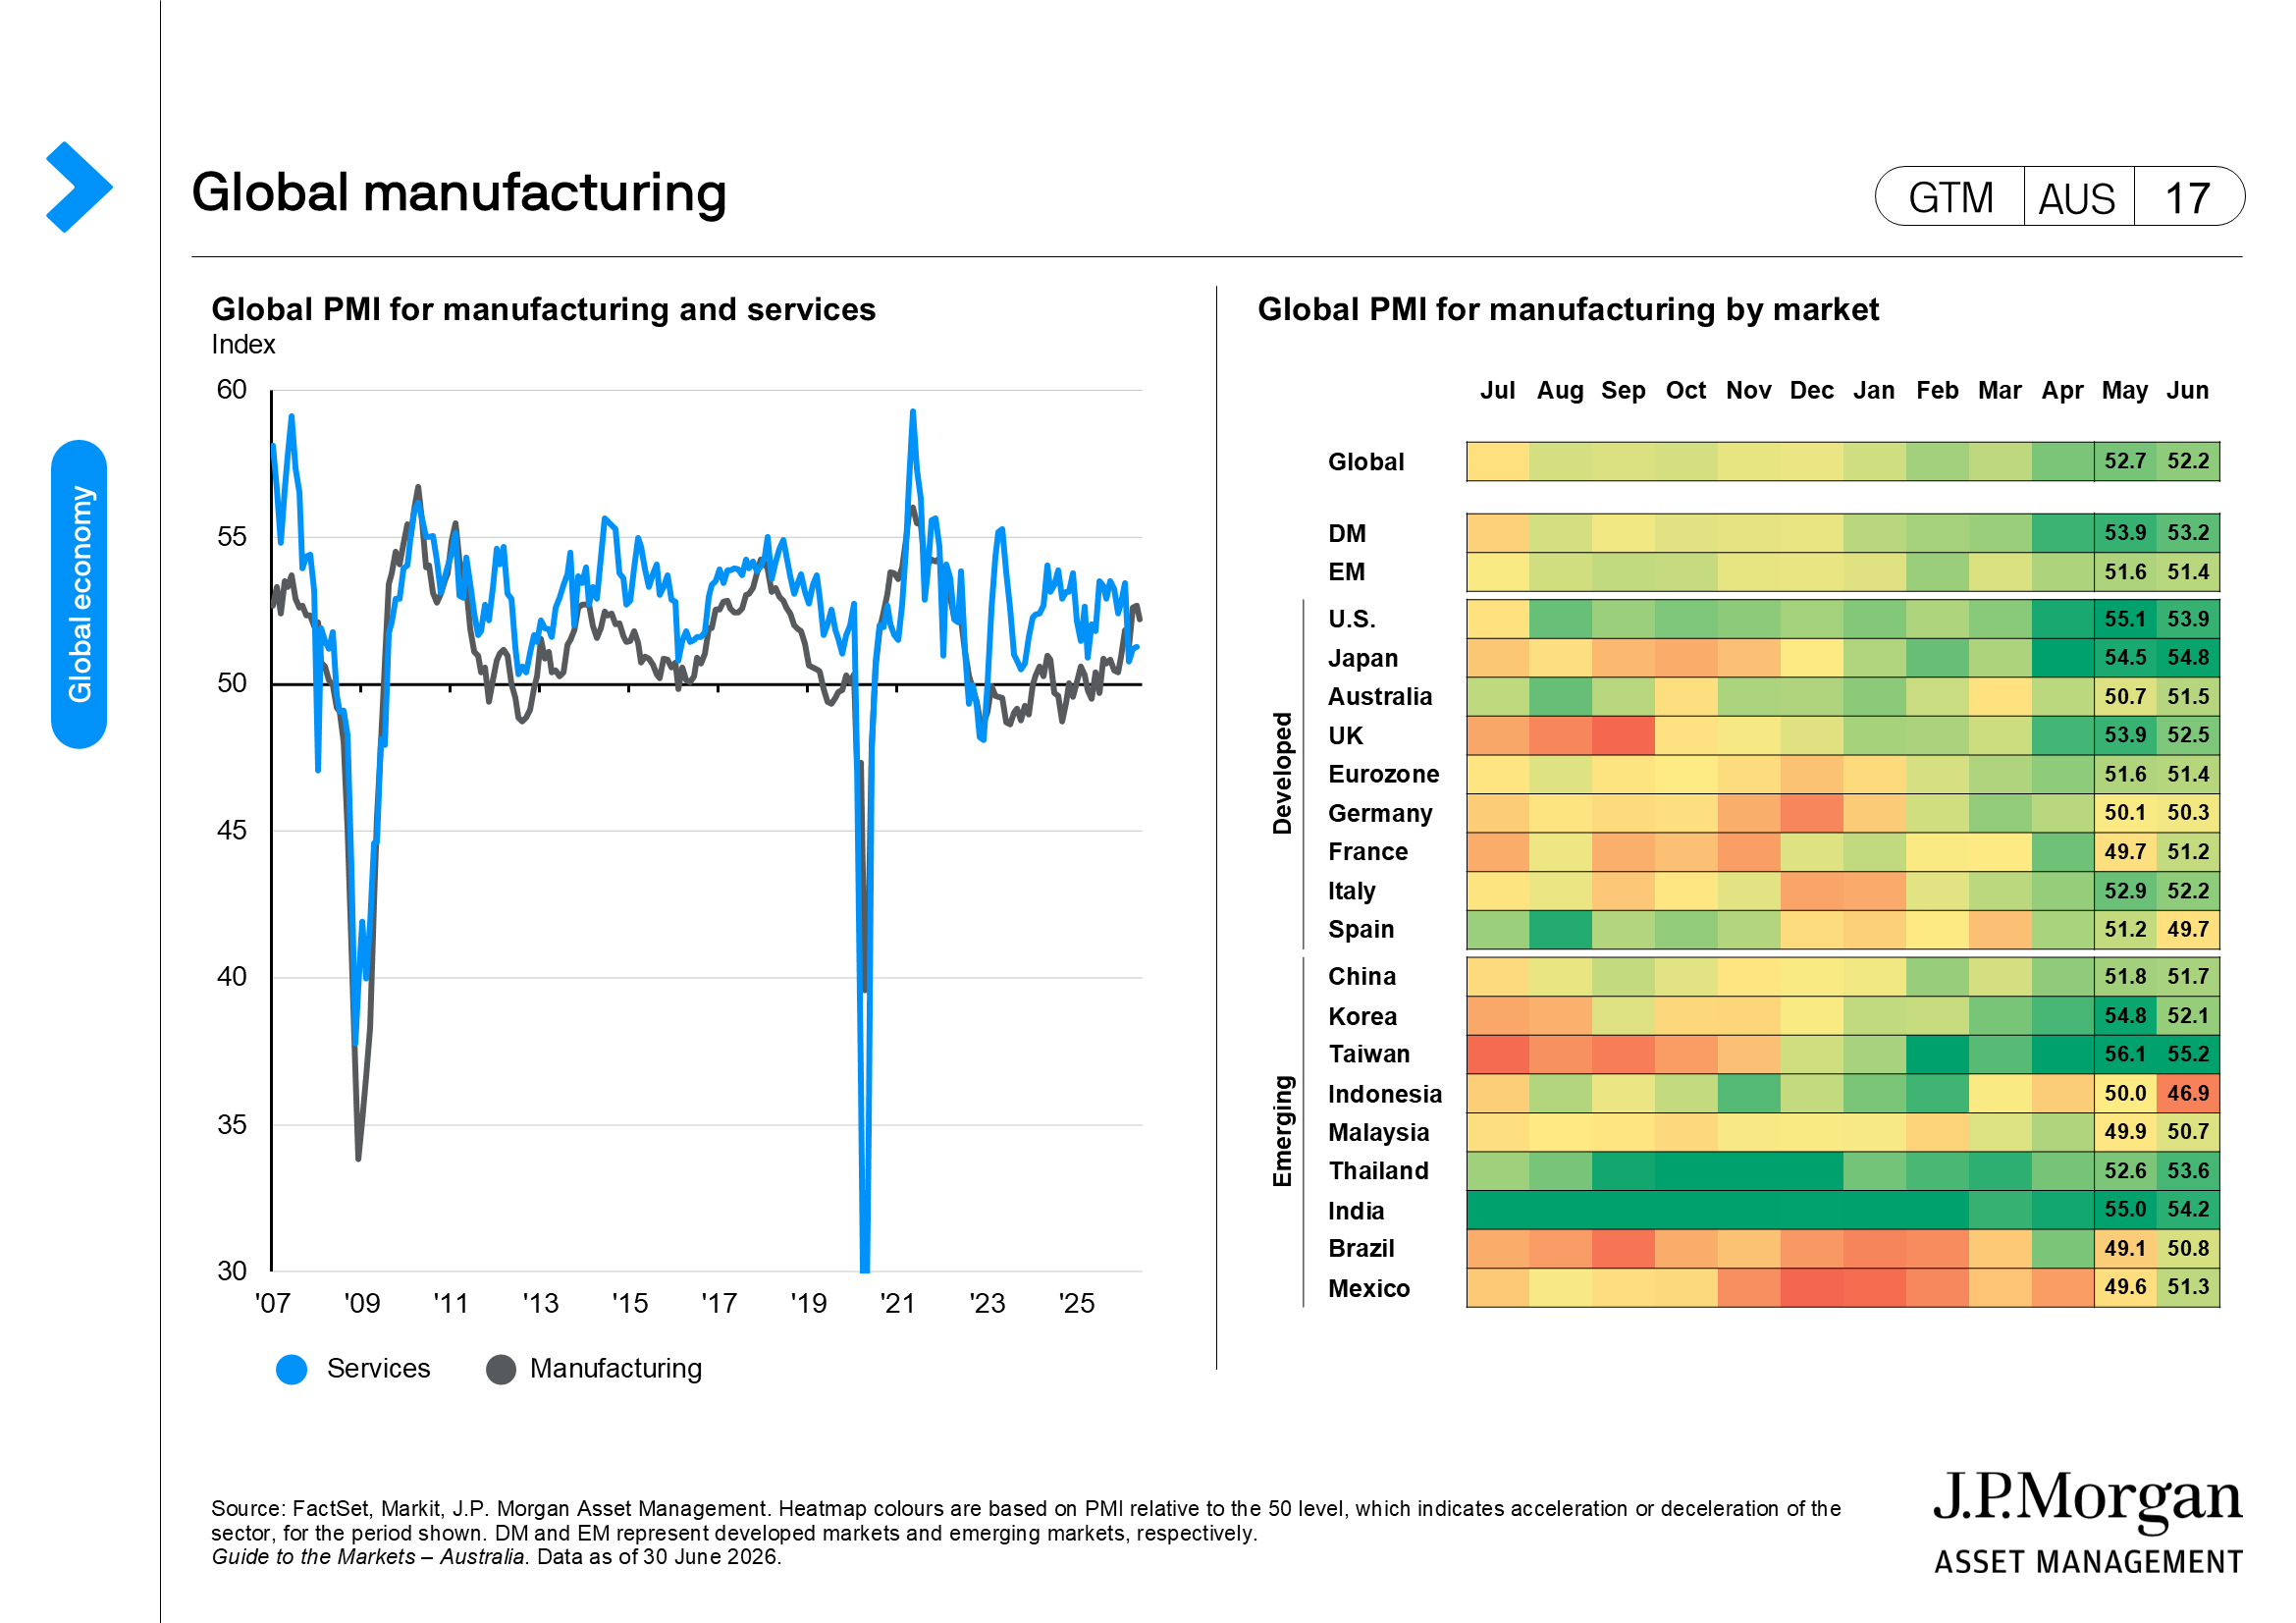
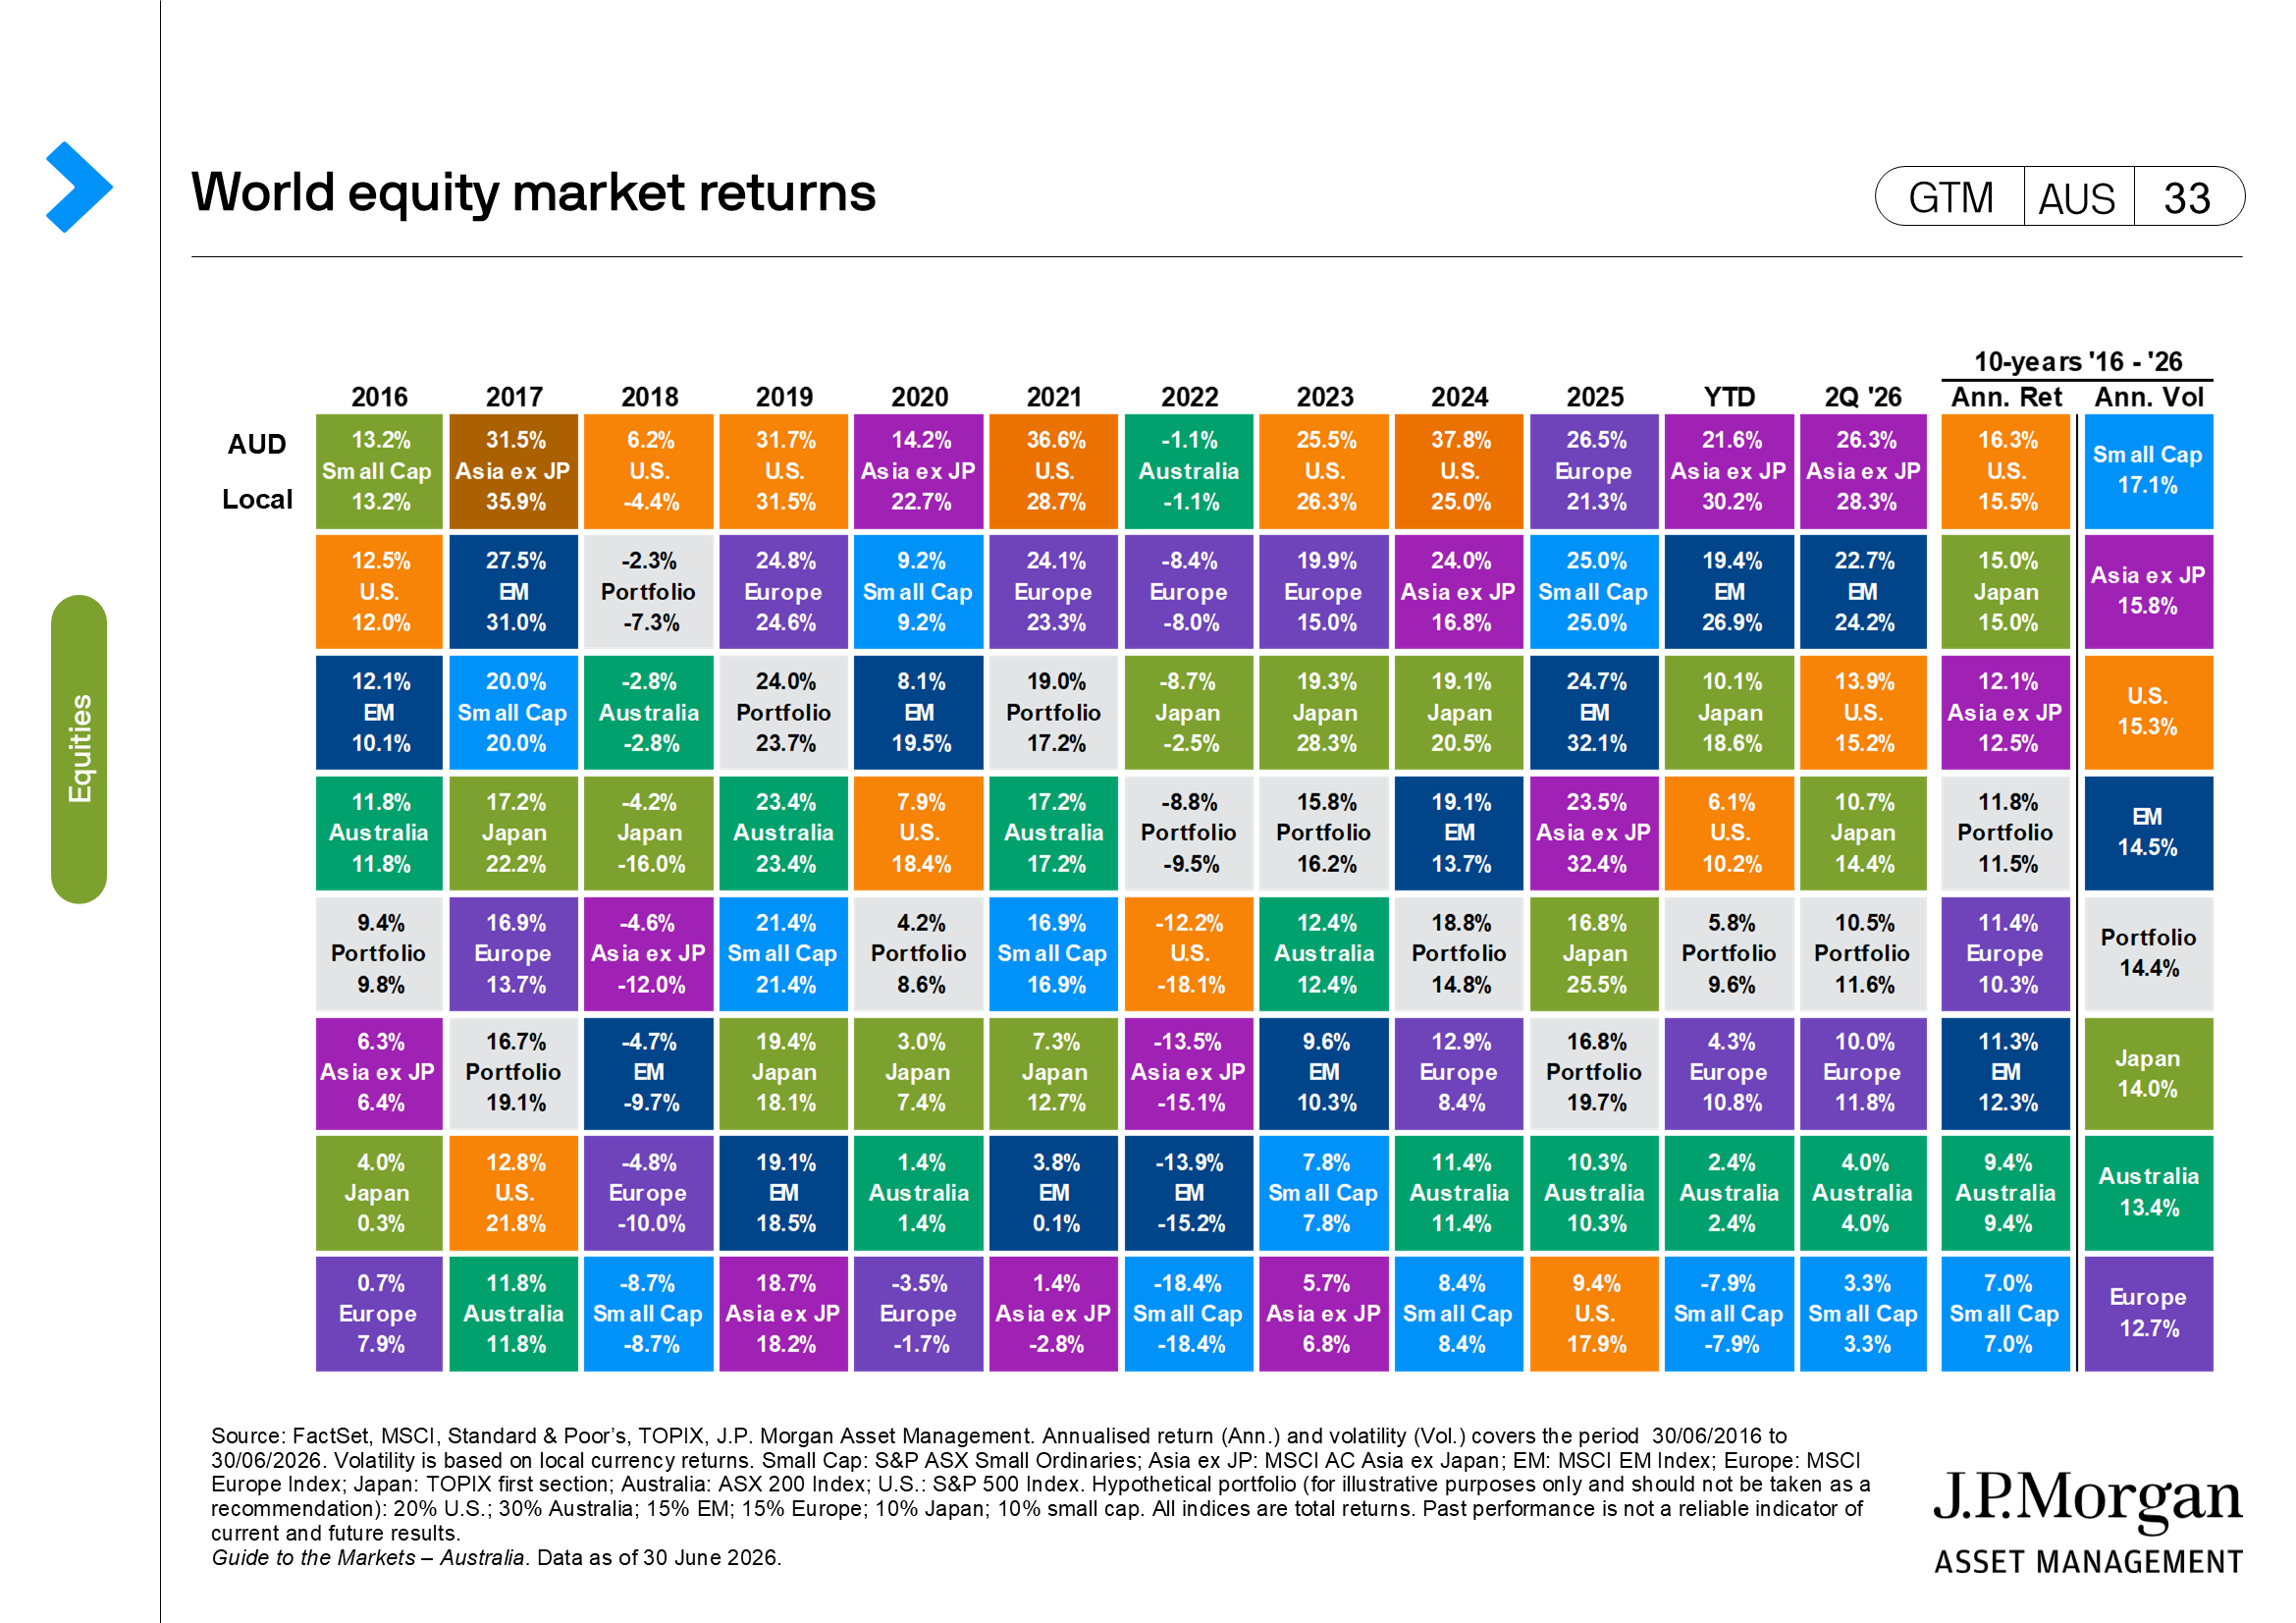
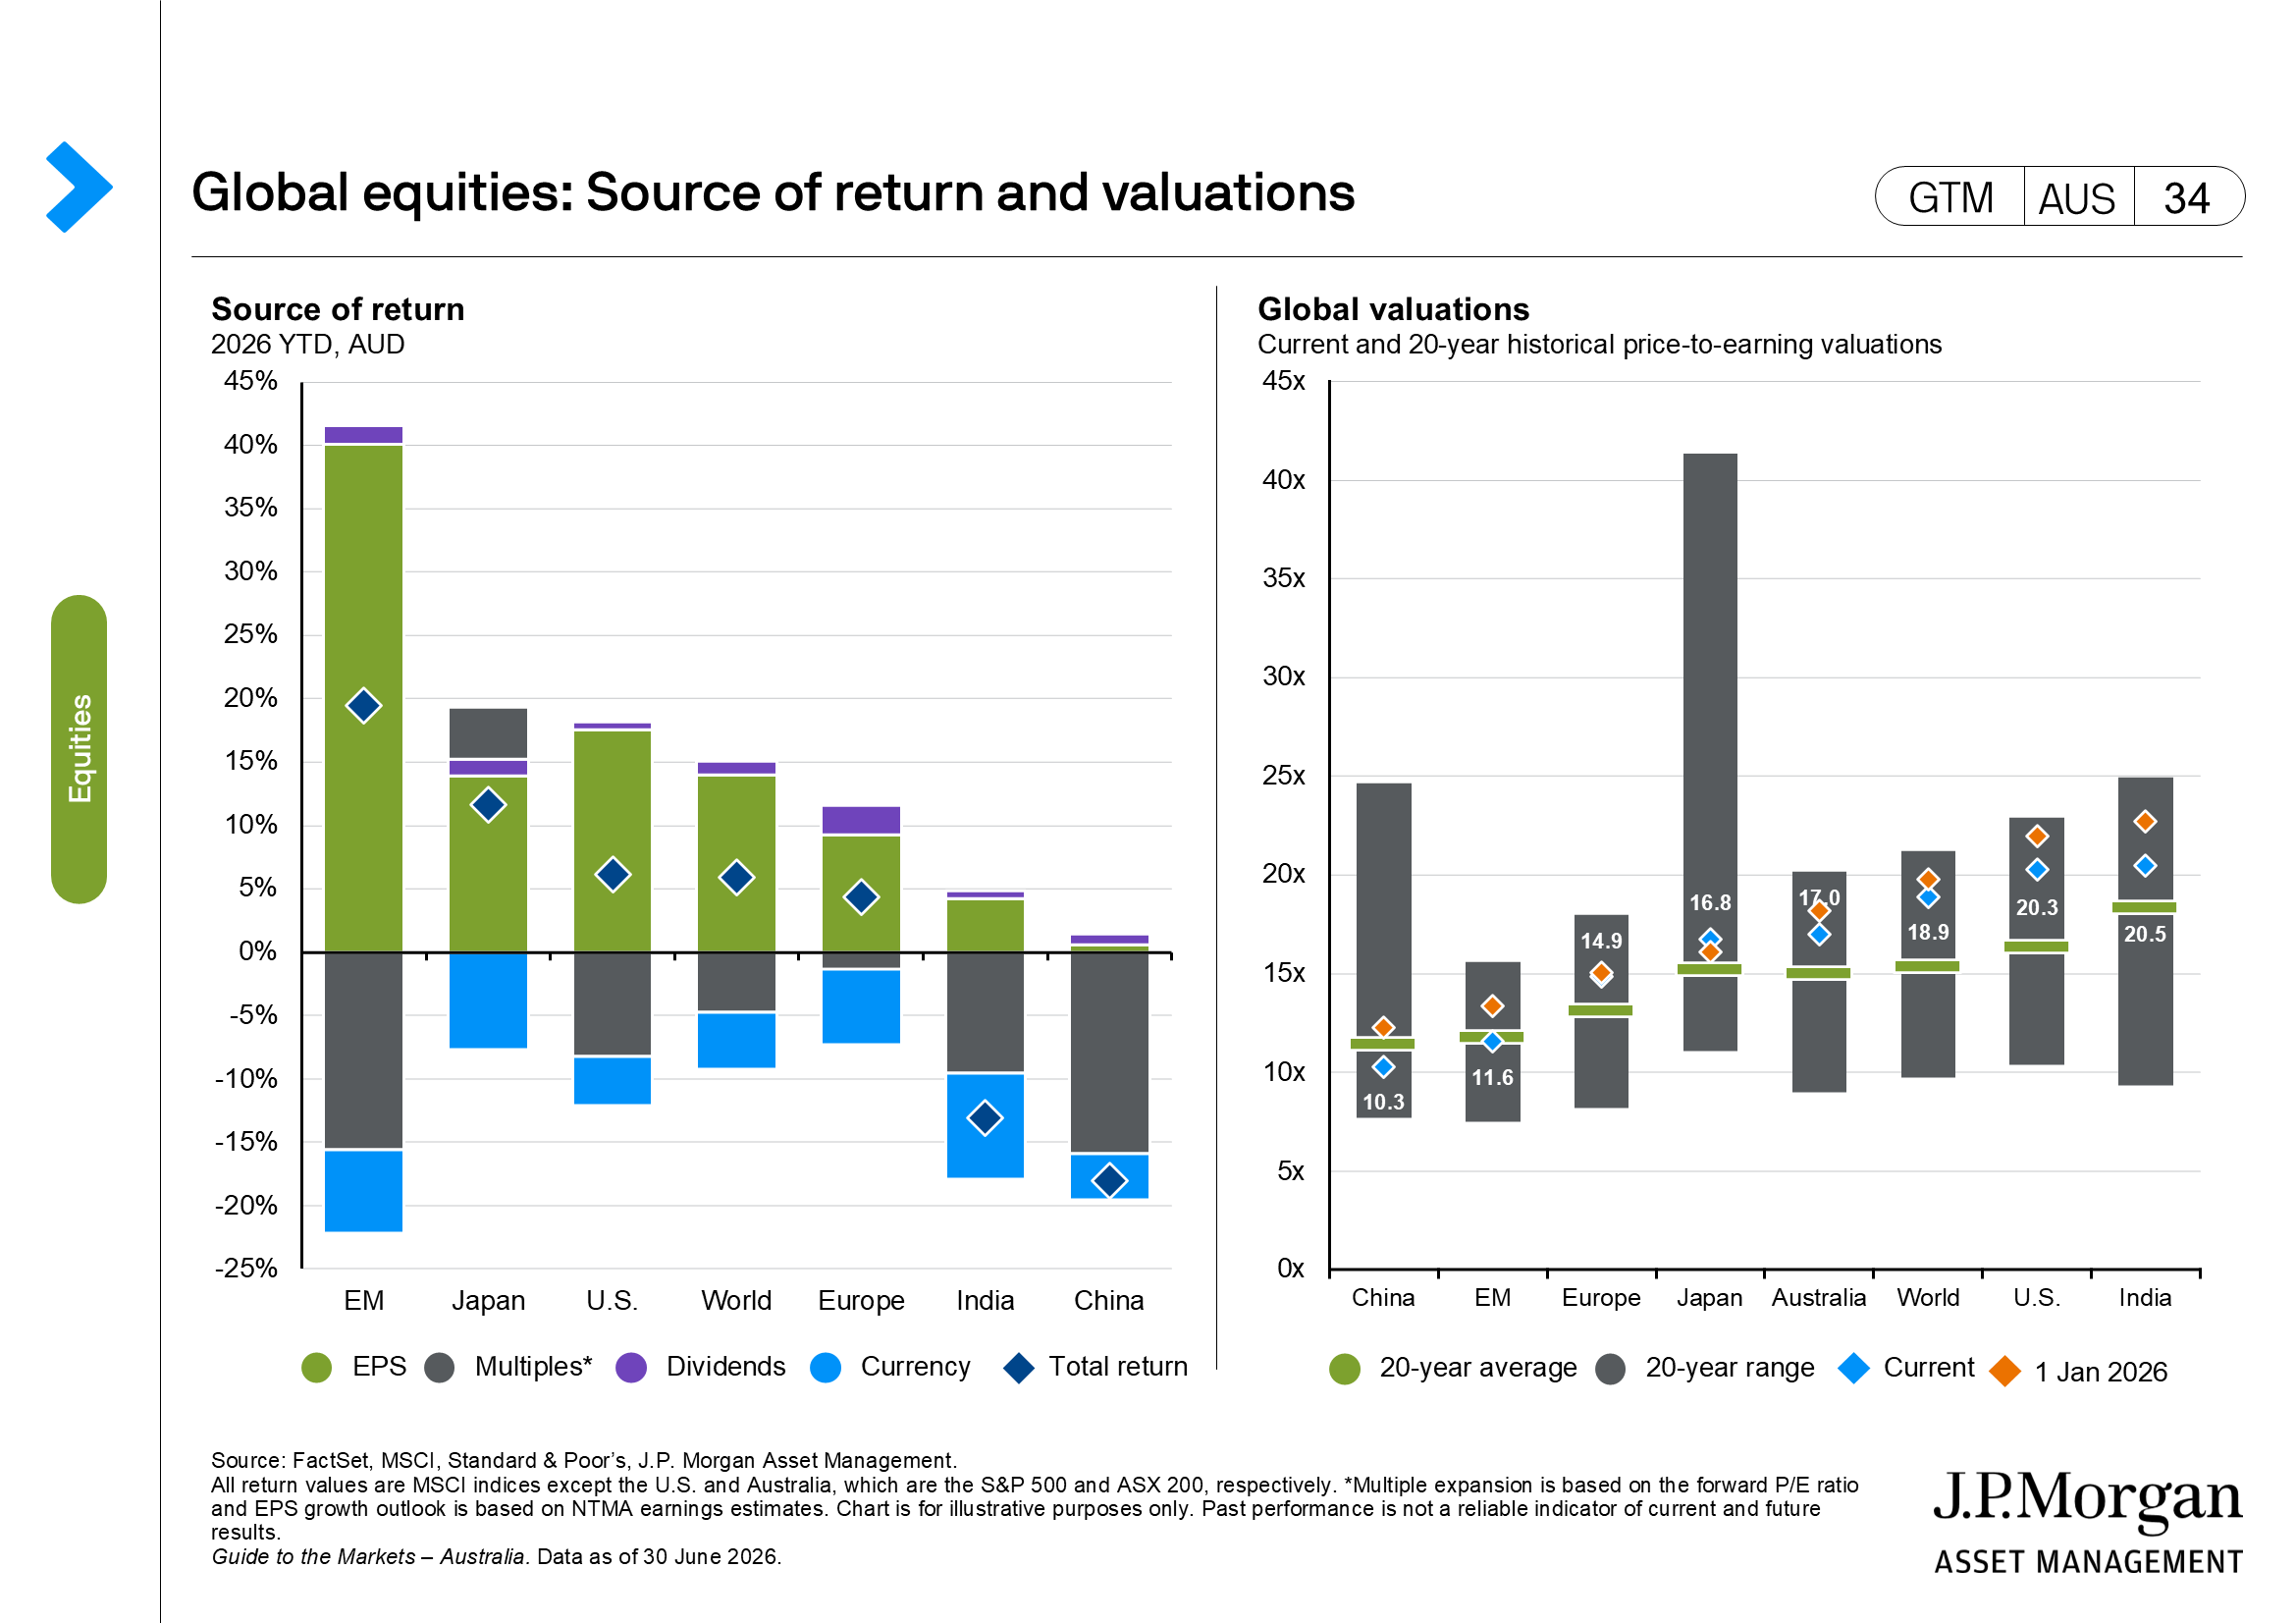
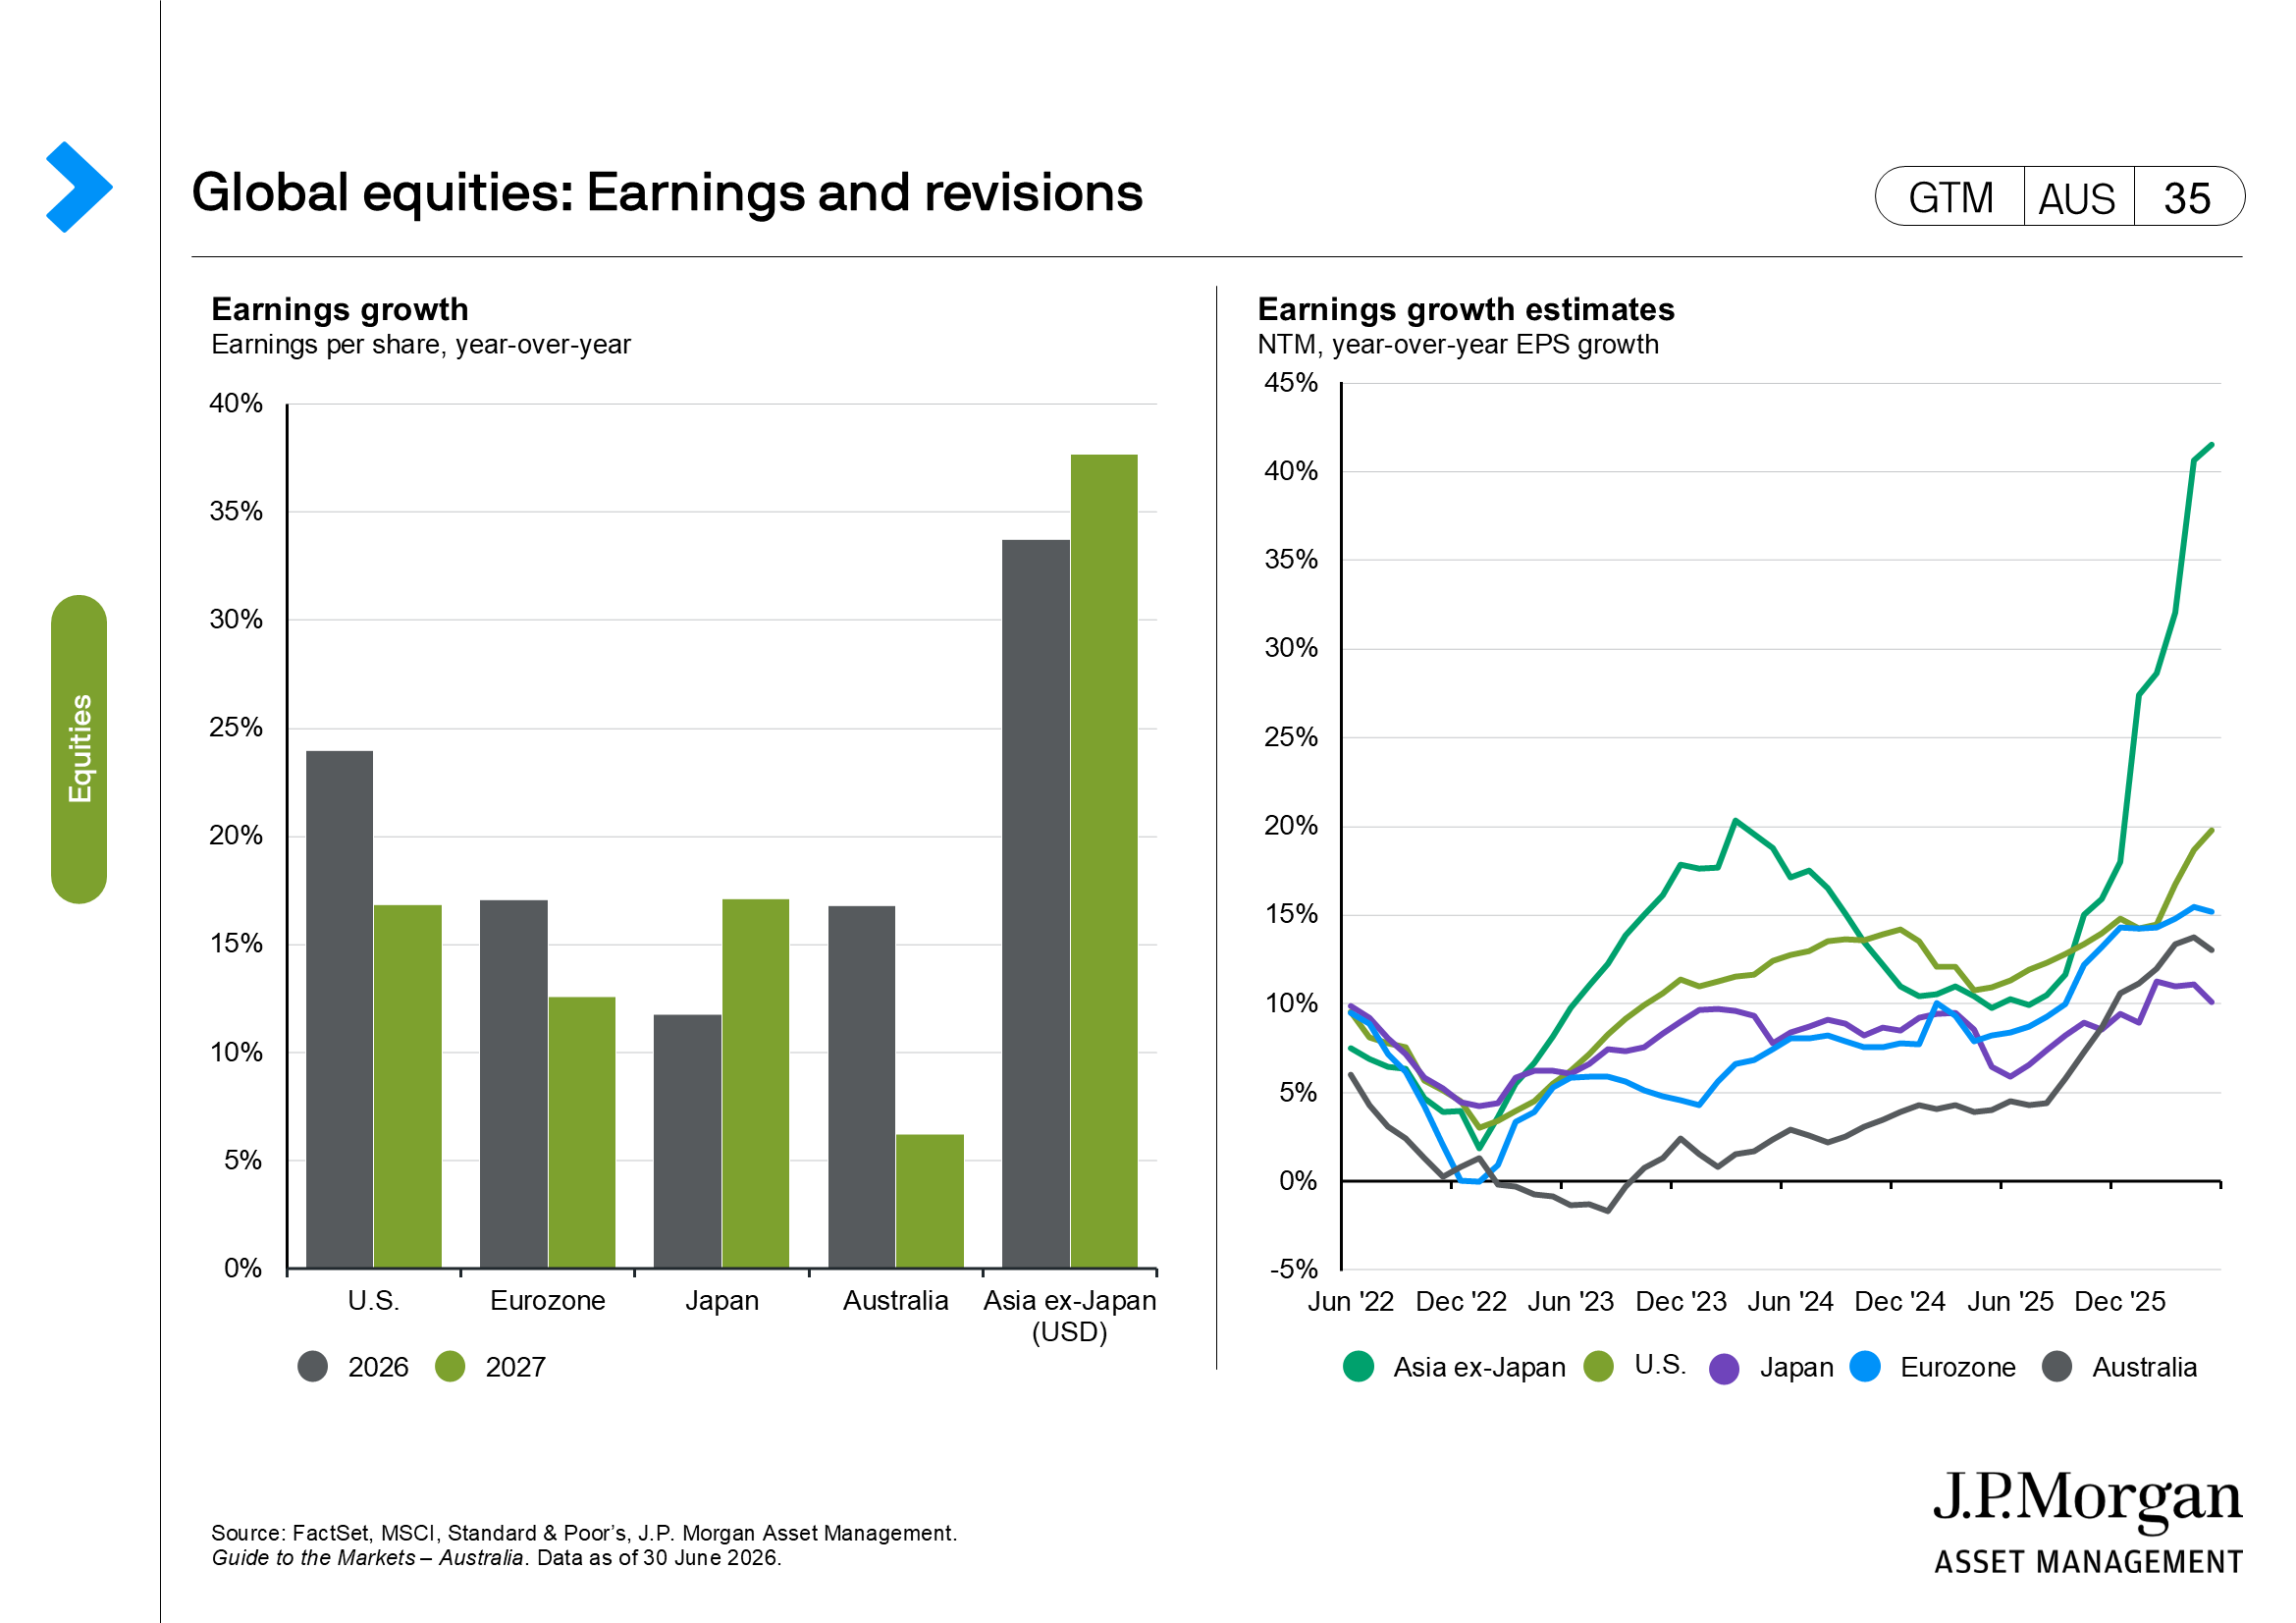
Asian equities surged 28.3% in the second quarter. The large share of semiconductors and information technology hardware in the MSCI Asia Pacific ex-Japan index explains this landmark performance, as investors’ preference continued to shift to companies that produce the “picks and shovels” of the artificial intelligence (AI) boom. For this same reason, Asian markets bore the sharpest brunt of market volatility during June, concentrated almost entirely in technology and semiconductors.
In the Korean equity market, single-session moves of around 10% were a repeated feature. Investors have treated Korea as a proxy for broader sentiment towards AI capital expenditure; however, the pattern of sharp moves played out in semiconductor names globally. This has raised concerns about the highly correlated nature of global equity markets, and how leveraged non-U.S. markets are to U.S. hyperscaler capital expenditure. However, U.S. hyperscalers continue to raise their capital expenditure guidance for 2026 (now an impressive USD 758billion). Meanwhile, the commitment to growth at the market level is strong, as evidenced by the South Korean government’s announcement of a USD 3.1trillion investment plan that would cover semiconductor production, robotics, and data centres as three major growth pillars.
Better month for Australian equities but not the currency
Australian markets lagged other developed markets during the second quarter but picked up some performance in June. The 0.7% gain for the ASX 200 was ahead of the S&P 500 (-1.0%) but lagged European and Japanese markets.
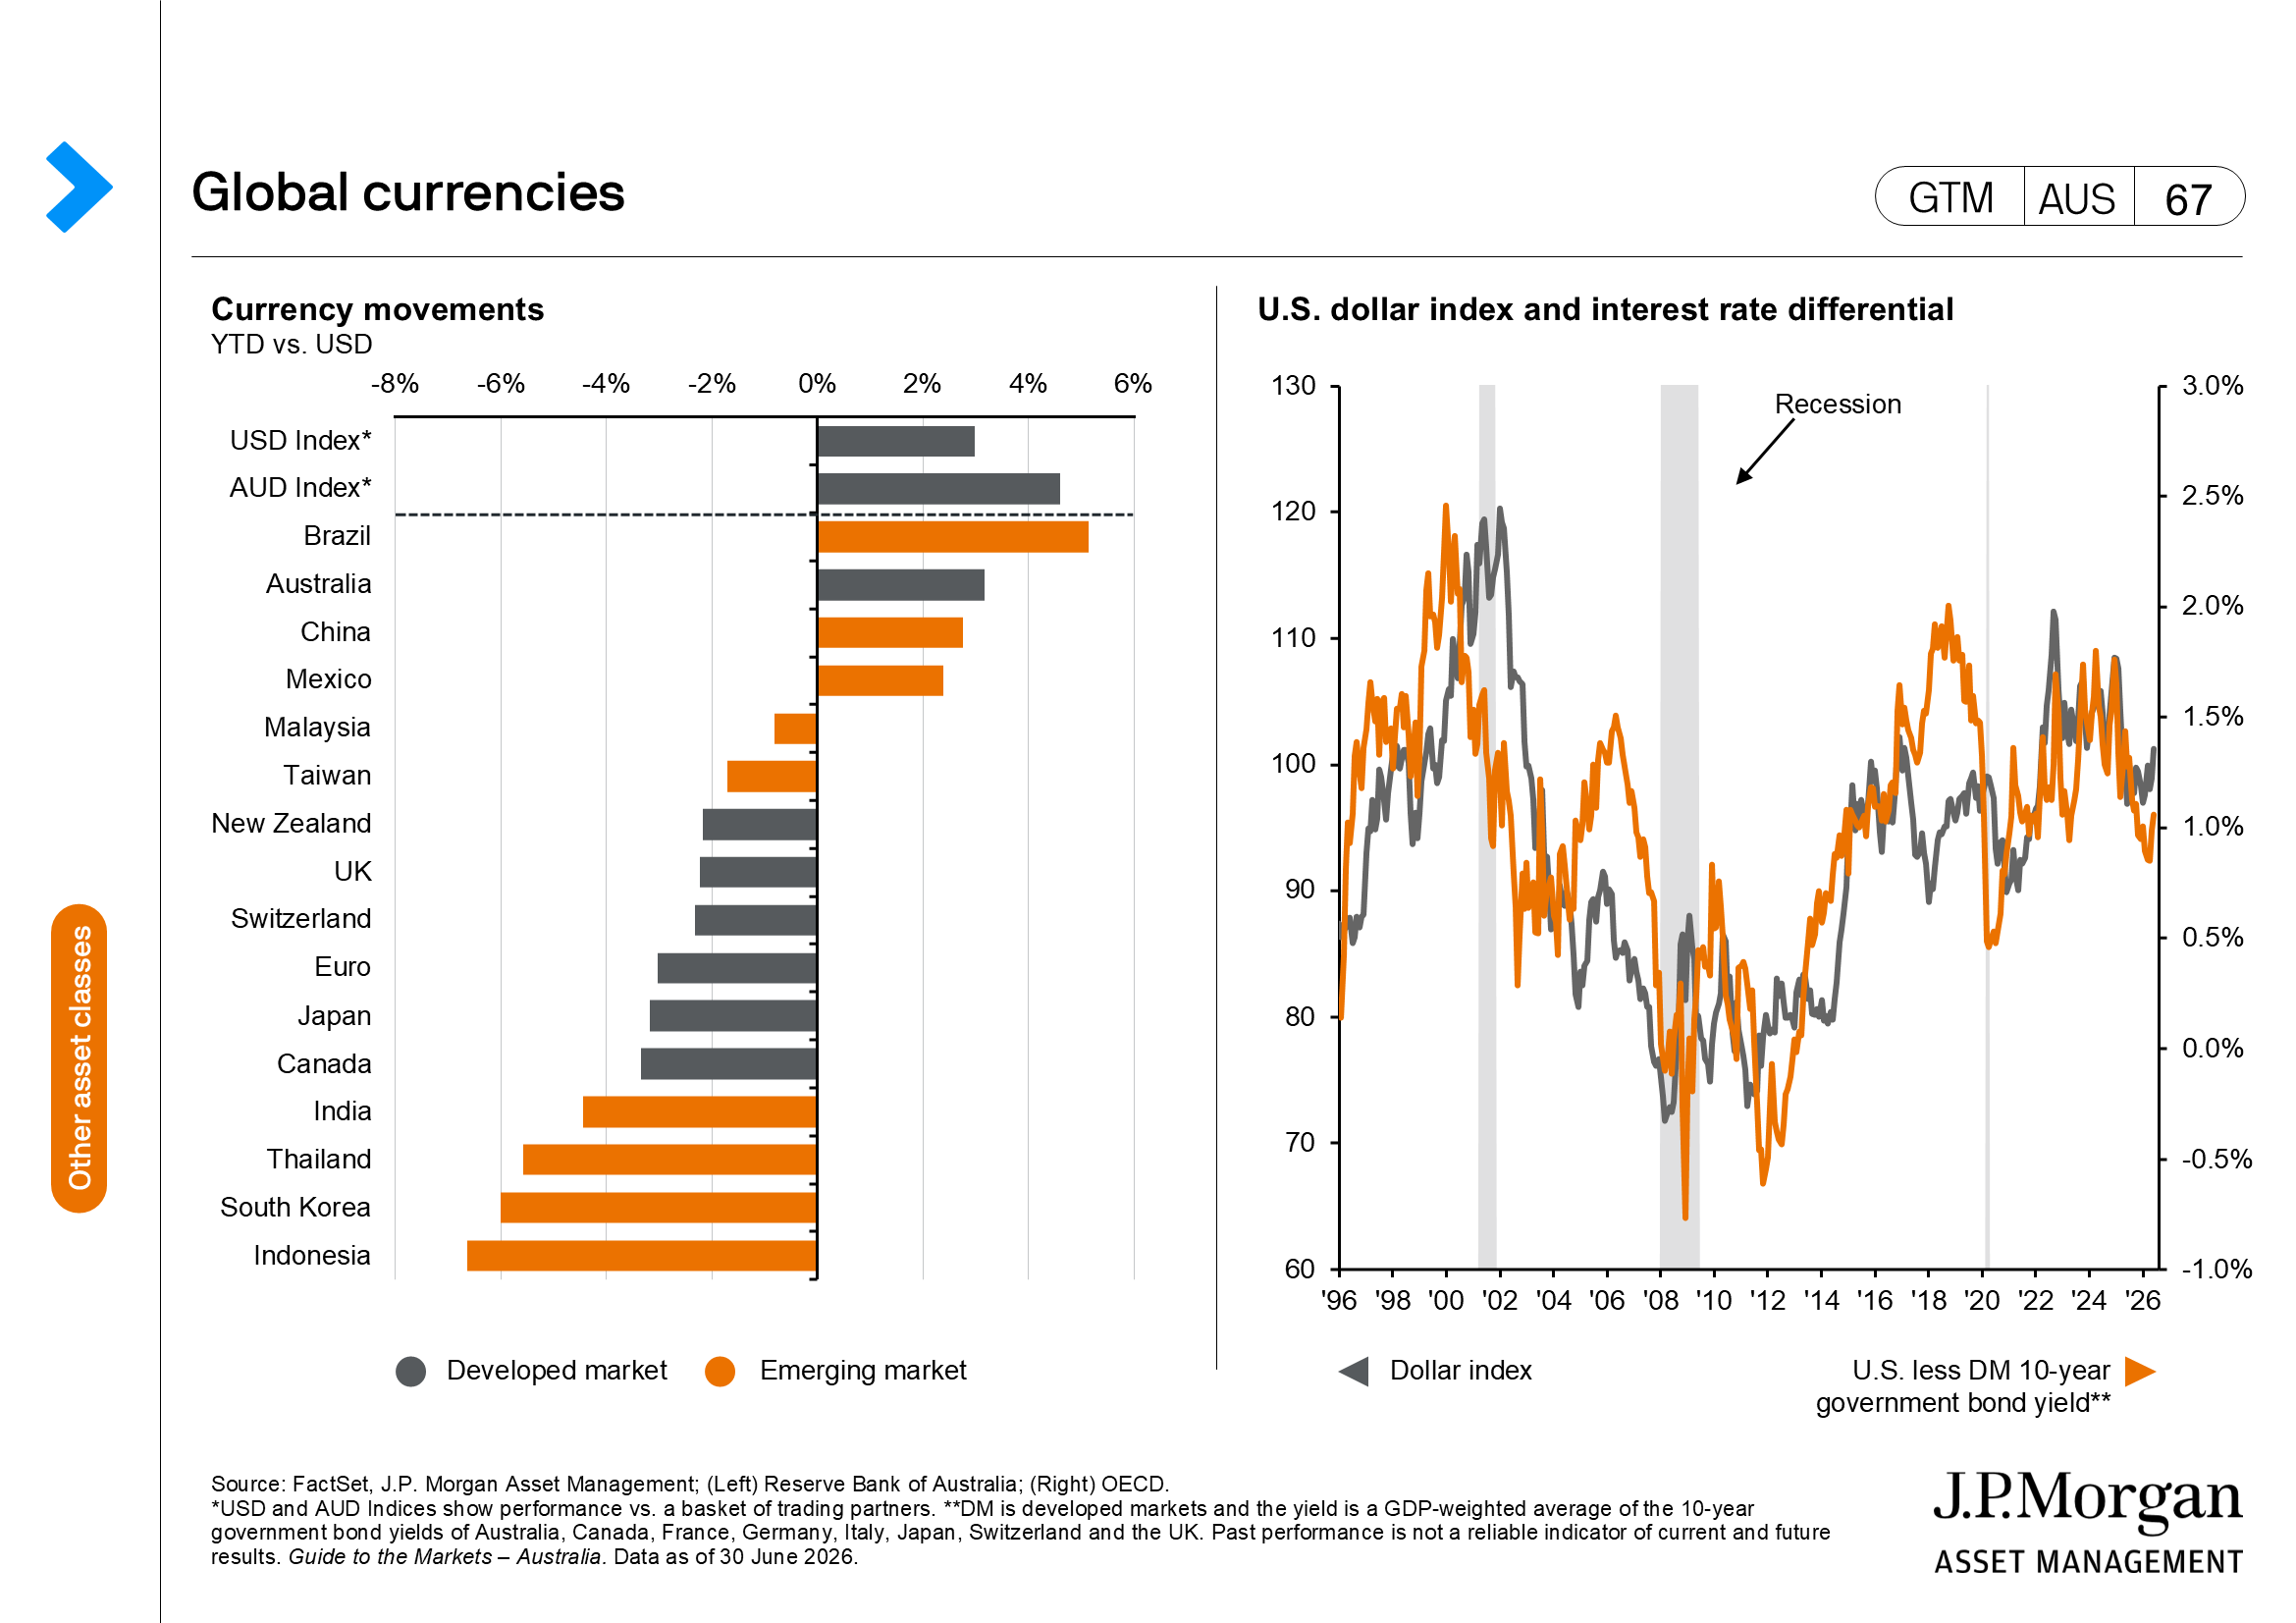
The Australian dollar (AUD) was notably lower, sliding 3.7% against the U.S. dollar over the month. Against the backdrop of falling energy prices, which should bode well for growth and a cyclical currency like the AUD, the weakness was more a function of USD strength and the firming U.S. rates outlook, compared to the Reserve Bank of Australia (RBA), which may be done.
The RBA is facing a two-sided outlook on inflation. Falling energy prices are a clear disinflationary force, but domestic price pressures are still firm, and a persistently weaker AUD would raise the price of imports. The RBA is likely to wait it out on inflation as it digests incoming macroeconomic information. The past rate hikes are still taking hold and may be enough to curb the inflation that has troubled the RBA for so long.
Half time hydration break
The market moves in June were more about the unwinding of the risk premium rather than a sharp change in the underlying growth or inflation trajectory. Oil and gold fell in tandem, alongside a round trip in equities and bonds, suggesting investors were recalibrating for a more complex outlook that could lead to broader participation in equity markets and more attractive fixed income markets.
Global economy
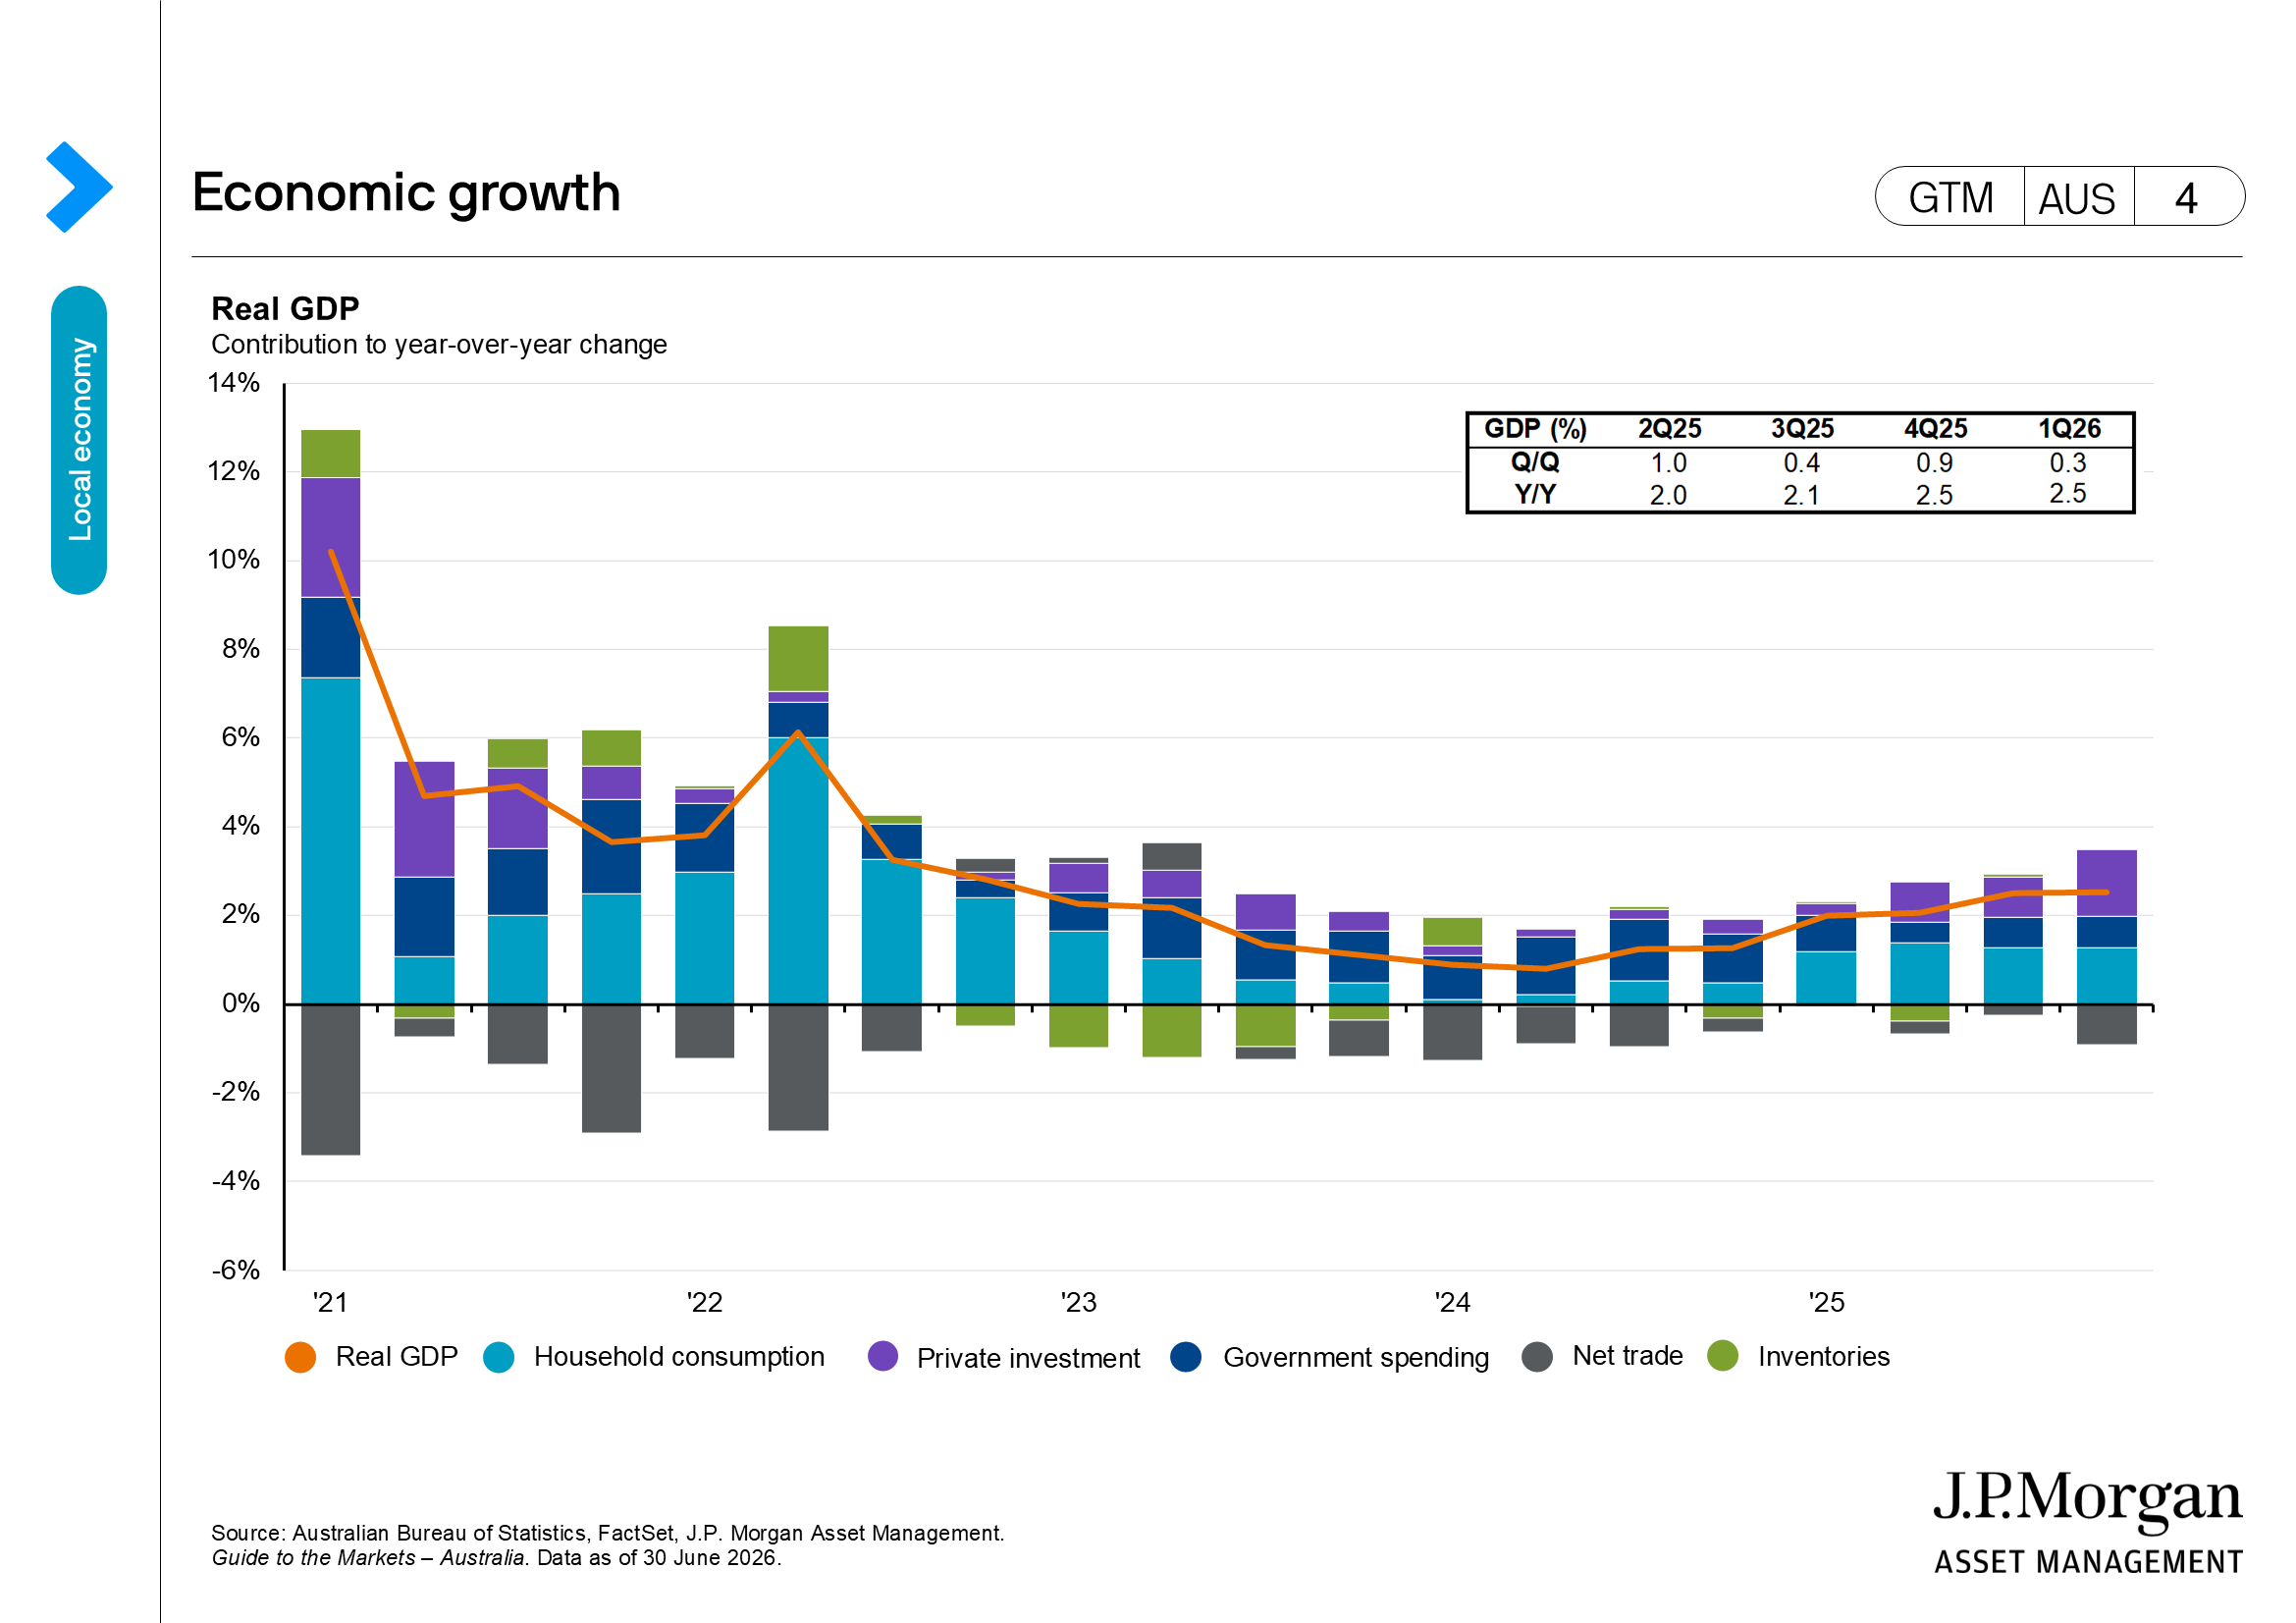
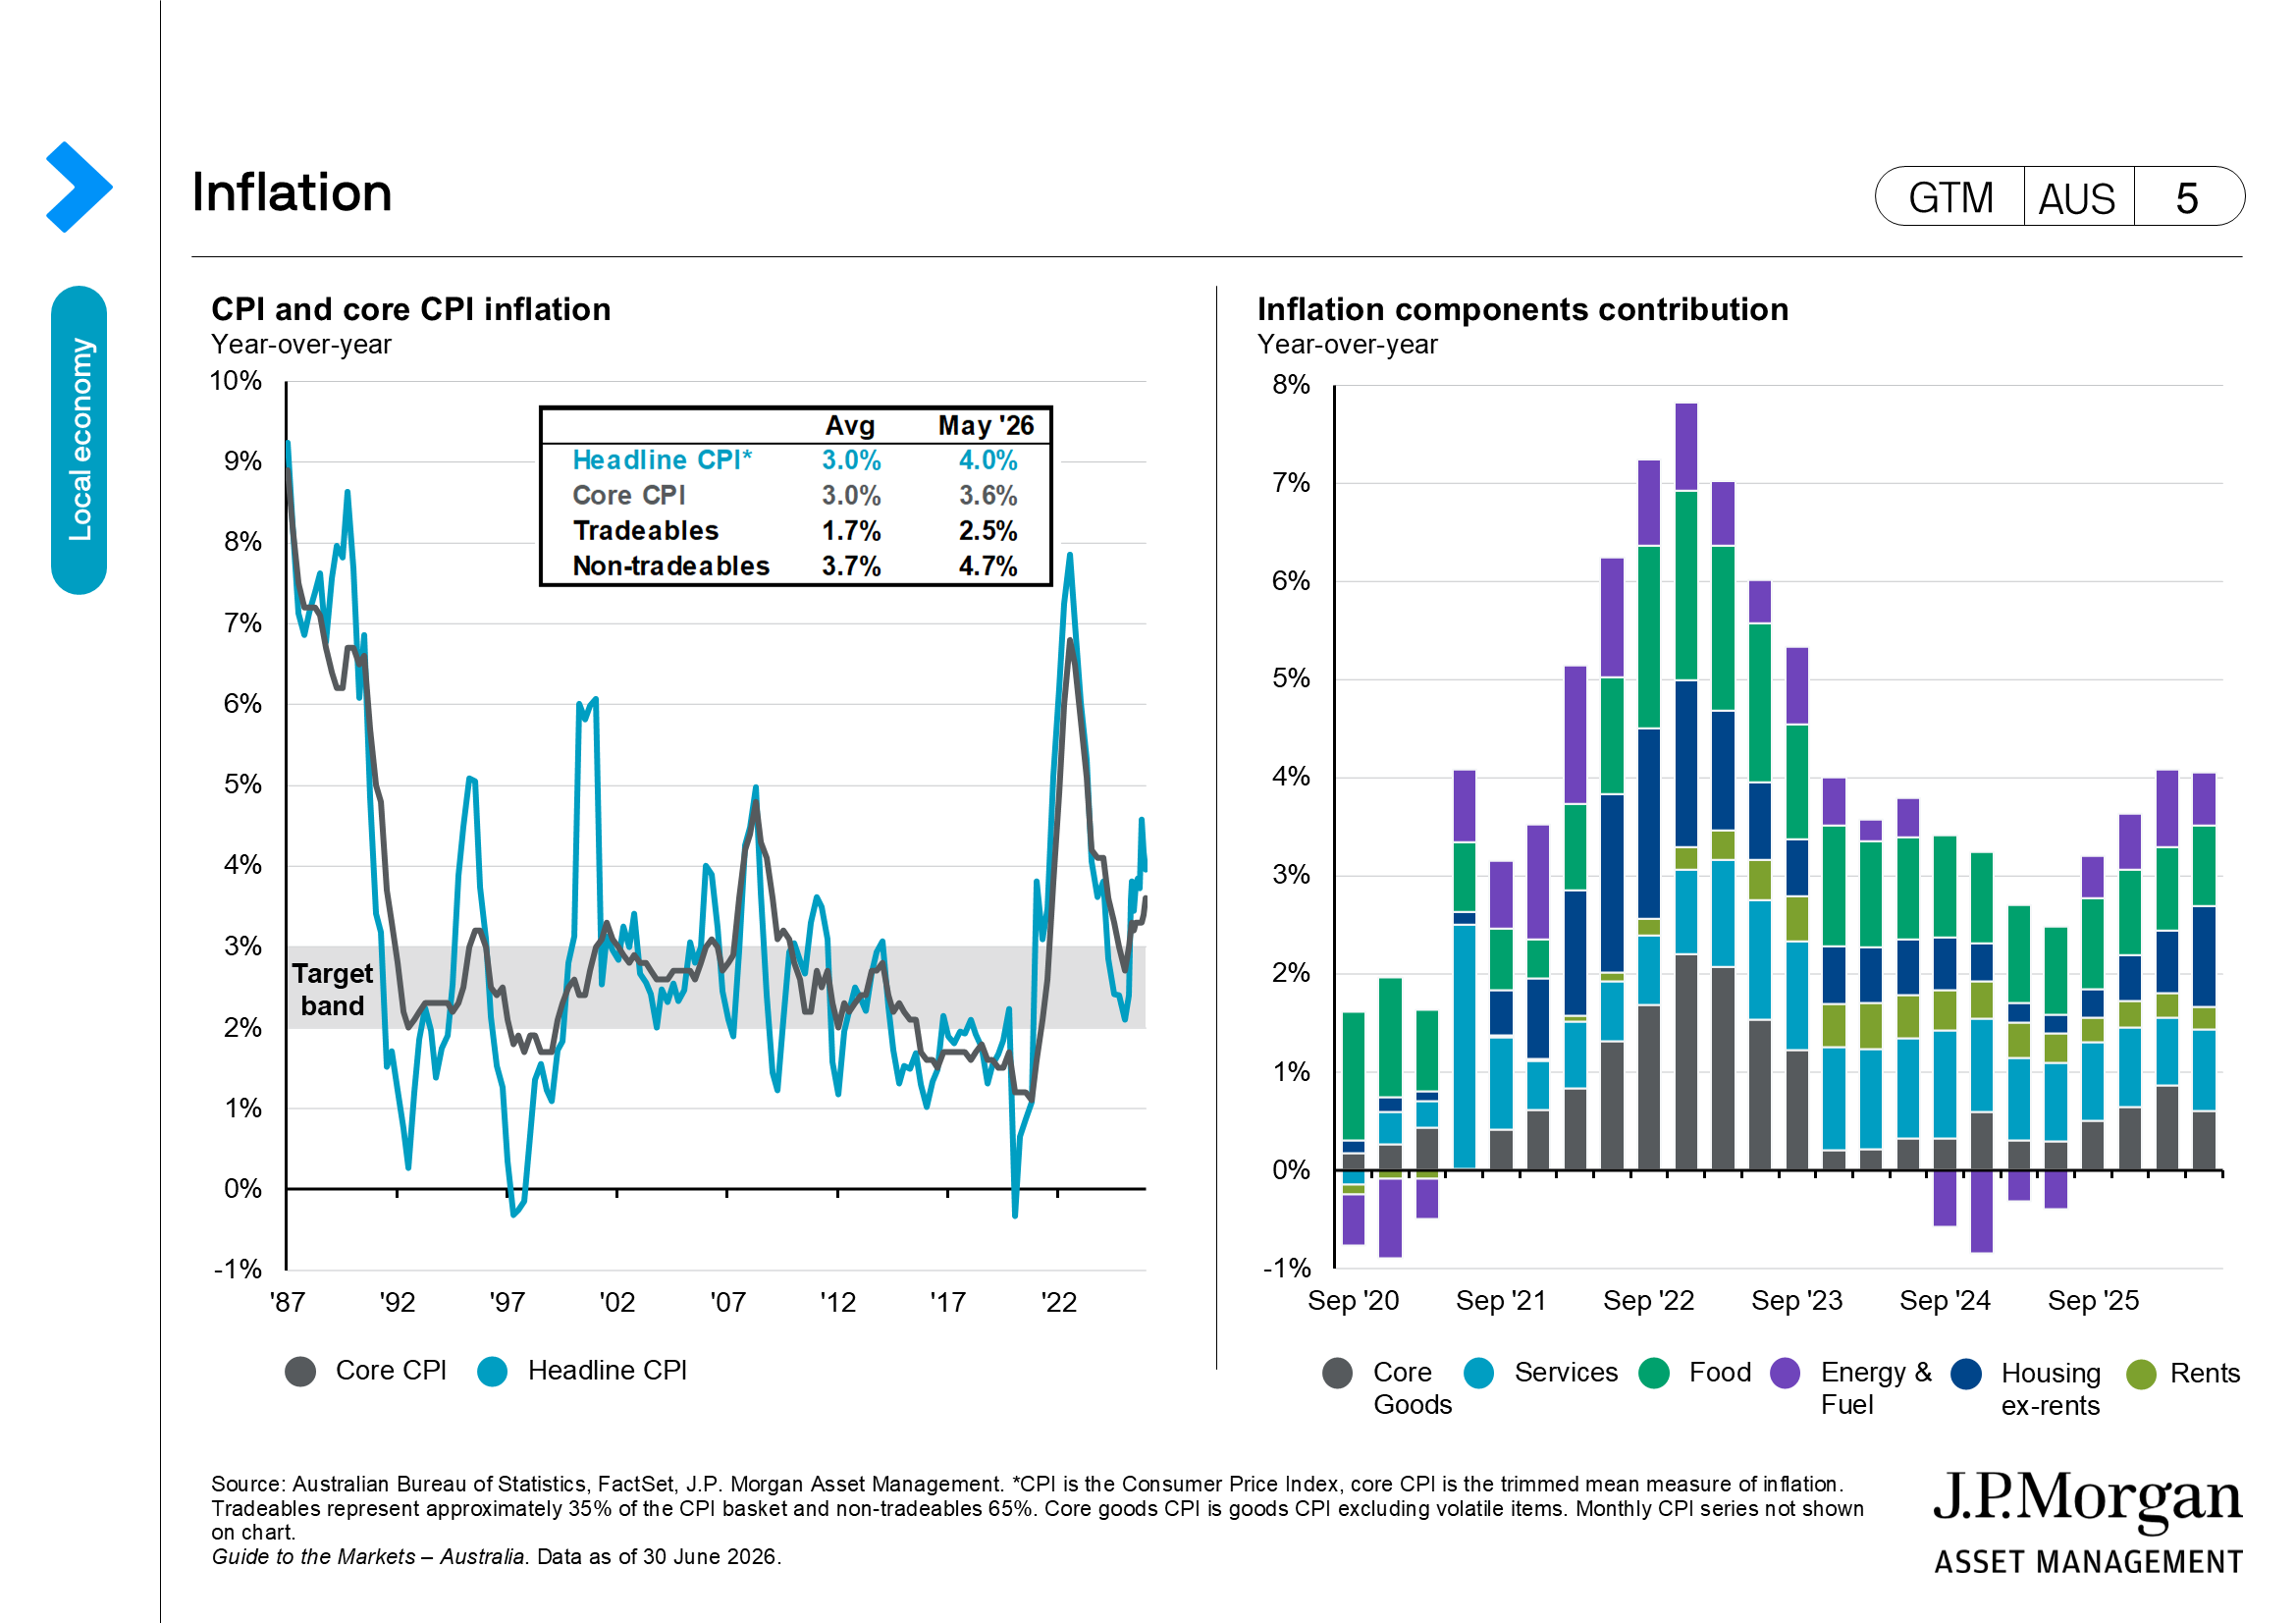
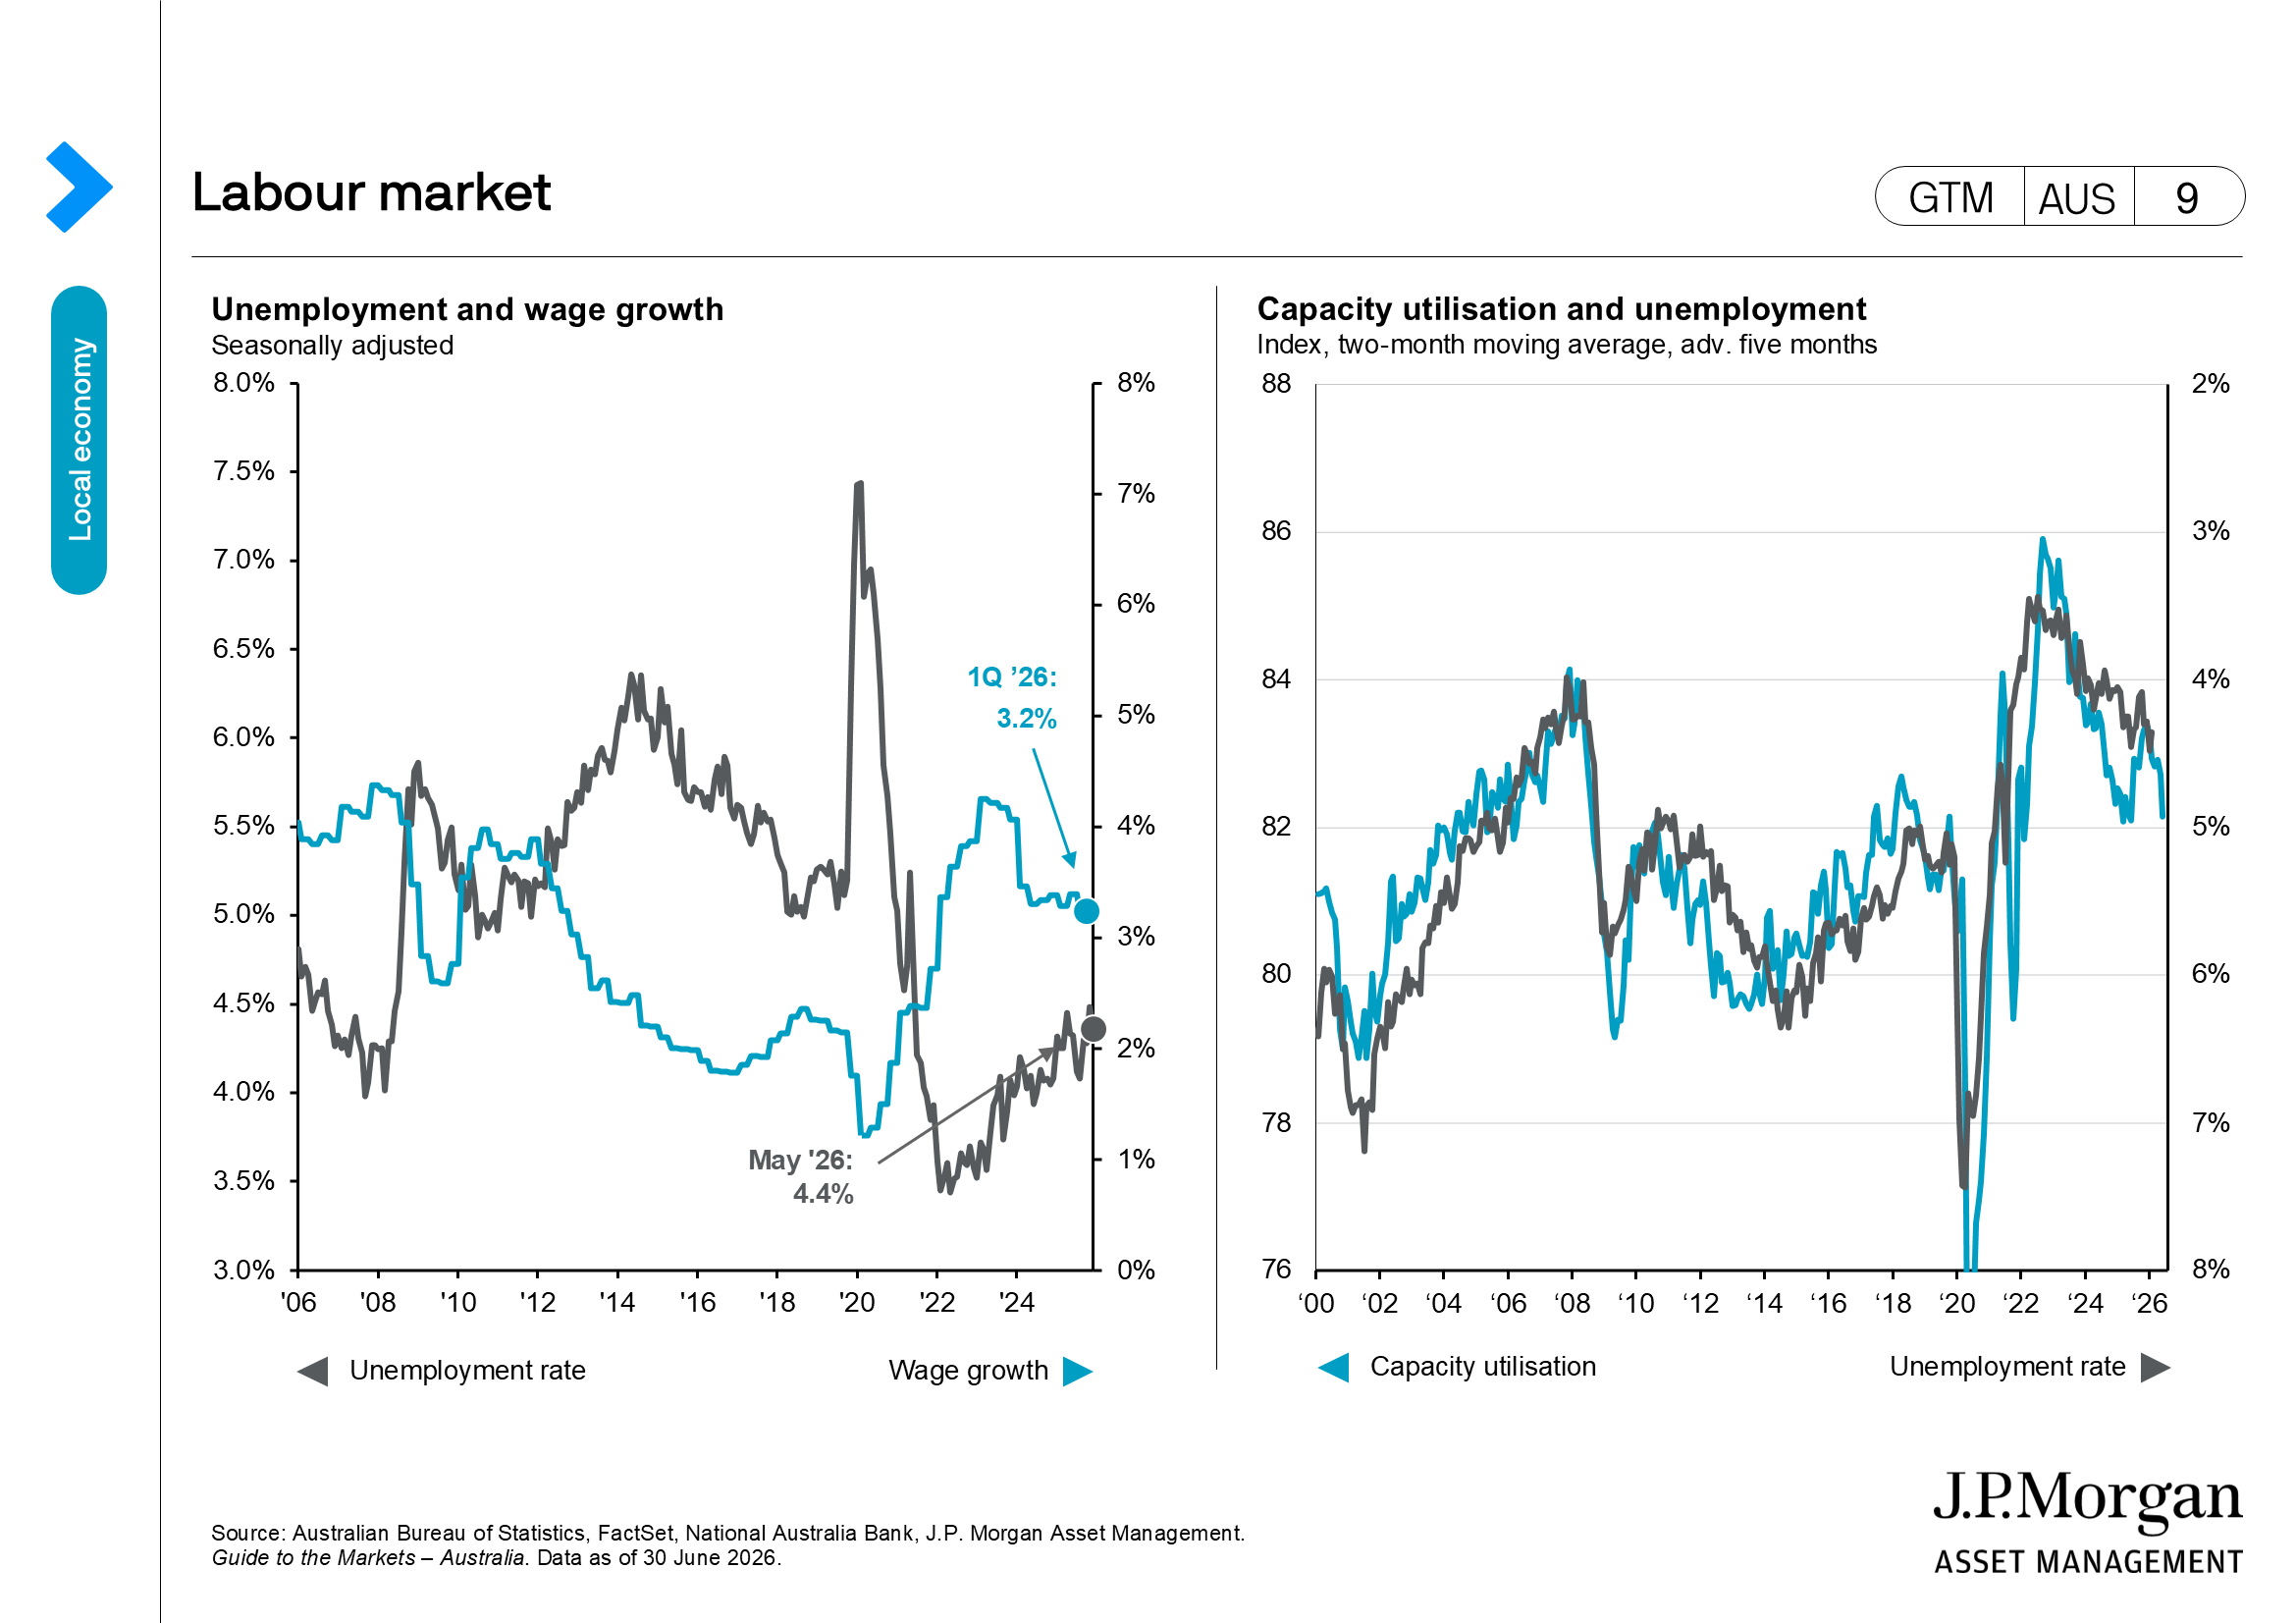
- Australia data for May was more benign than feared, given inflation rates fell, as did the unemployment rate. Inflation was softer than expectations at 4.0% y/y, and the 2Q inflation rate may peak below the RBA forecasts, keeping rates on hold. Meanwhile, the drop in the unemployment rate to 4.4% and the unwinding of the surge in employment in prior months reinforces the view of a gradual softening in labour market conditions.
- Kevin Warsh’s first meeting as Fed Chair delivered a hawkish hold, with the FOMC keeping rates at 3.50%–3.75% while removing forward guidance and the prior easing bias. The Fed described growth as solid and the labour market as balanced, but raised inflation forecasts sharply, with inflation not expected to return to target until 2028. The median dot now implies one hike this year, while Warsh also announced task forces on Fed communications, the balance sheet, data quality, AI’s productivity impact and the inflation framework.
- The European Central bank (ECB) raised the deposit rate by 25 bps to 2.25% and maintained a data-dependent, meeting-by-meeting stance. While the Governing Council acknowledged both inflation and growth risks from the energy shock, Lagarde sounded more concerned about inflation, highlighting elevated energy prices, broadening price pressures, and inflation returning to target only toward the end of 2027. Markets remain focused on whether the ECB delivers one more hike this year.
- In China, May activity disappointed as retail sales, investment and home prices weakened, underscoring pressure from soft consumption and the property sector. Industrial production remained a bright spot, supported by strong exports, while unemployment edged lower to 5.1%. Inflation was mixed, with headline consumer price index (CPI) flat, softer core inflation, and higher producer price index (PPI). The strong year-to-date exports are helping offset weak domestic demand and are keeping Beijing’s 4.5%–5.0% growth target in reach.
- The Bank of Japan (BoJ) raised the policy rate to 1.00% in June, as upside to inflation dominated the downside to growth, as the risks of falling “behind the curve” gradually build. The BoJ also decided to pause its tapering plan and keep monthly purchases steady at JPY 2trillion per month from April 2027, showing caution against overly aggressive tightening. On fiscal policy, the government has called for over JPY 370trillion public-private growth investment in 17 strategic areas by FY 2040.
Equities
- Global equities were mixed in June, with the S&P 500 and Nasdaq finishing lower despite fresh record closes early in the month, while the equal-weight S&P 500 outperformed on renewed signs of market broadening. AI remained the key under-the-surface driver, but leadership rotated sharply. Semiconductors and memory stocks were all higher over the month, though they saw significant volatility, while the Magnificent 7 were sold off amid concerns around AI return on investment, rising memory costs and heavier equity supply. Industrials, healthcare, financials, utilities, real estate and staples outperformed, while communication services, energy, consumer discretionary and technology lagged.
- Asian equities were broadly flat in June, with the MSCI Asia Pacific ex Japan index unchanged, though aggregate performance masked high volatility and sharp country-level dispersion. Japan and India outperformed, supported by falling oil prices and resilient macro conditions, while Taiwan posted modest gains and South Korea declined as extreme volatility in chip and AI-linked shares triggered trading halts and weighed heavily on the KOSPI.
- Australian equities gained 0.7% over the month, with large caps outperforming small caps. The Small Ords Index fell 2.0% over the month. Energy (-8.9%) and materials (-6.7%) suffered the biggest drawdowns given the movement in commodity prices. Meanwhile, healthcare (13.3%), consumer staples (13.0%) and consumer discretionary (12.2%) led returns as the rates outlook was tempered by domestic economic data.
- Greater China was mixed: Mainland markets rose, led by a surge in hardware and semiconductor-related shares amid AI infrastructure spending and Beijing’s self-sufficiency push, while Hong Kong underperformed sharply as internet and consumer-facing technology names came under pressure from weak consumption, AI capex concerns and company-specific headlines.
- Elsewhere, Southeast Asian markets were mixed, with Indonesia notably weaker but the Philippines, Vietnam and Singapore higher, while regional currencies broadly weakened against a stronger U.S. dollar despite policy support from several central banks.
Fixed income
- The U.S. Treasury (UST) yield curve twist-flattened over the month, with 2-year yields up 15 bps but 30-year yields down 5 bps. A set of robust May employment data and a hawkish outcome at the June FOMC meeting put more pressure on the short end of the curve than the long end. With the median projection from the latest SEP also pointing to potential rate hikes ahead, this prompted a similarly hawkish pricing in markets, with the Overnight Index Swap (OIS) suggesting a total of 37 bps in rate hikes by the end of this year.
- Australian government bond yields fell over the month on the back of lower-than-expected inflation and reduced market pricing for RBA hikes. The 10-year Australian government bond yield fell –12bps to 4.72%, and the 2-year yield declined a similar 10bps to 4.42%. By month end markets were pricing in only 10bps of policy tightening by the RBA.
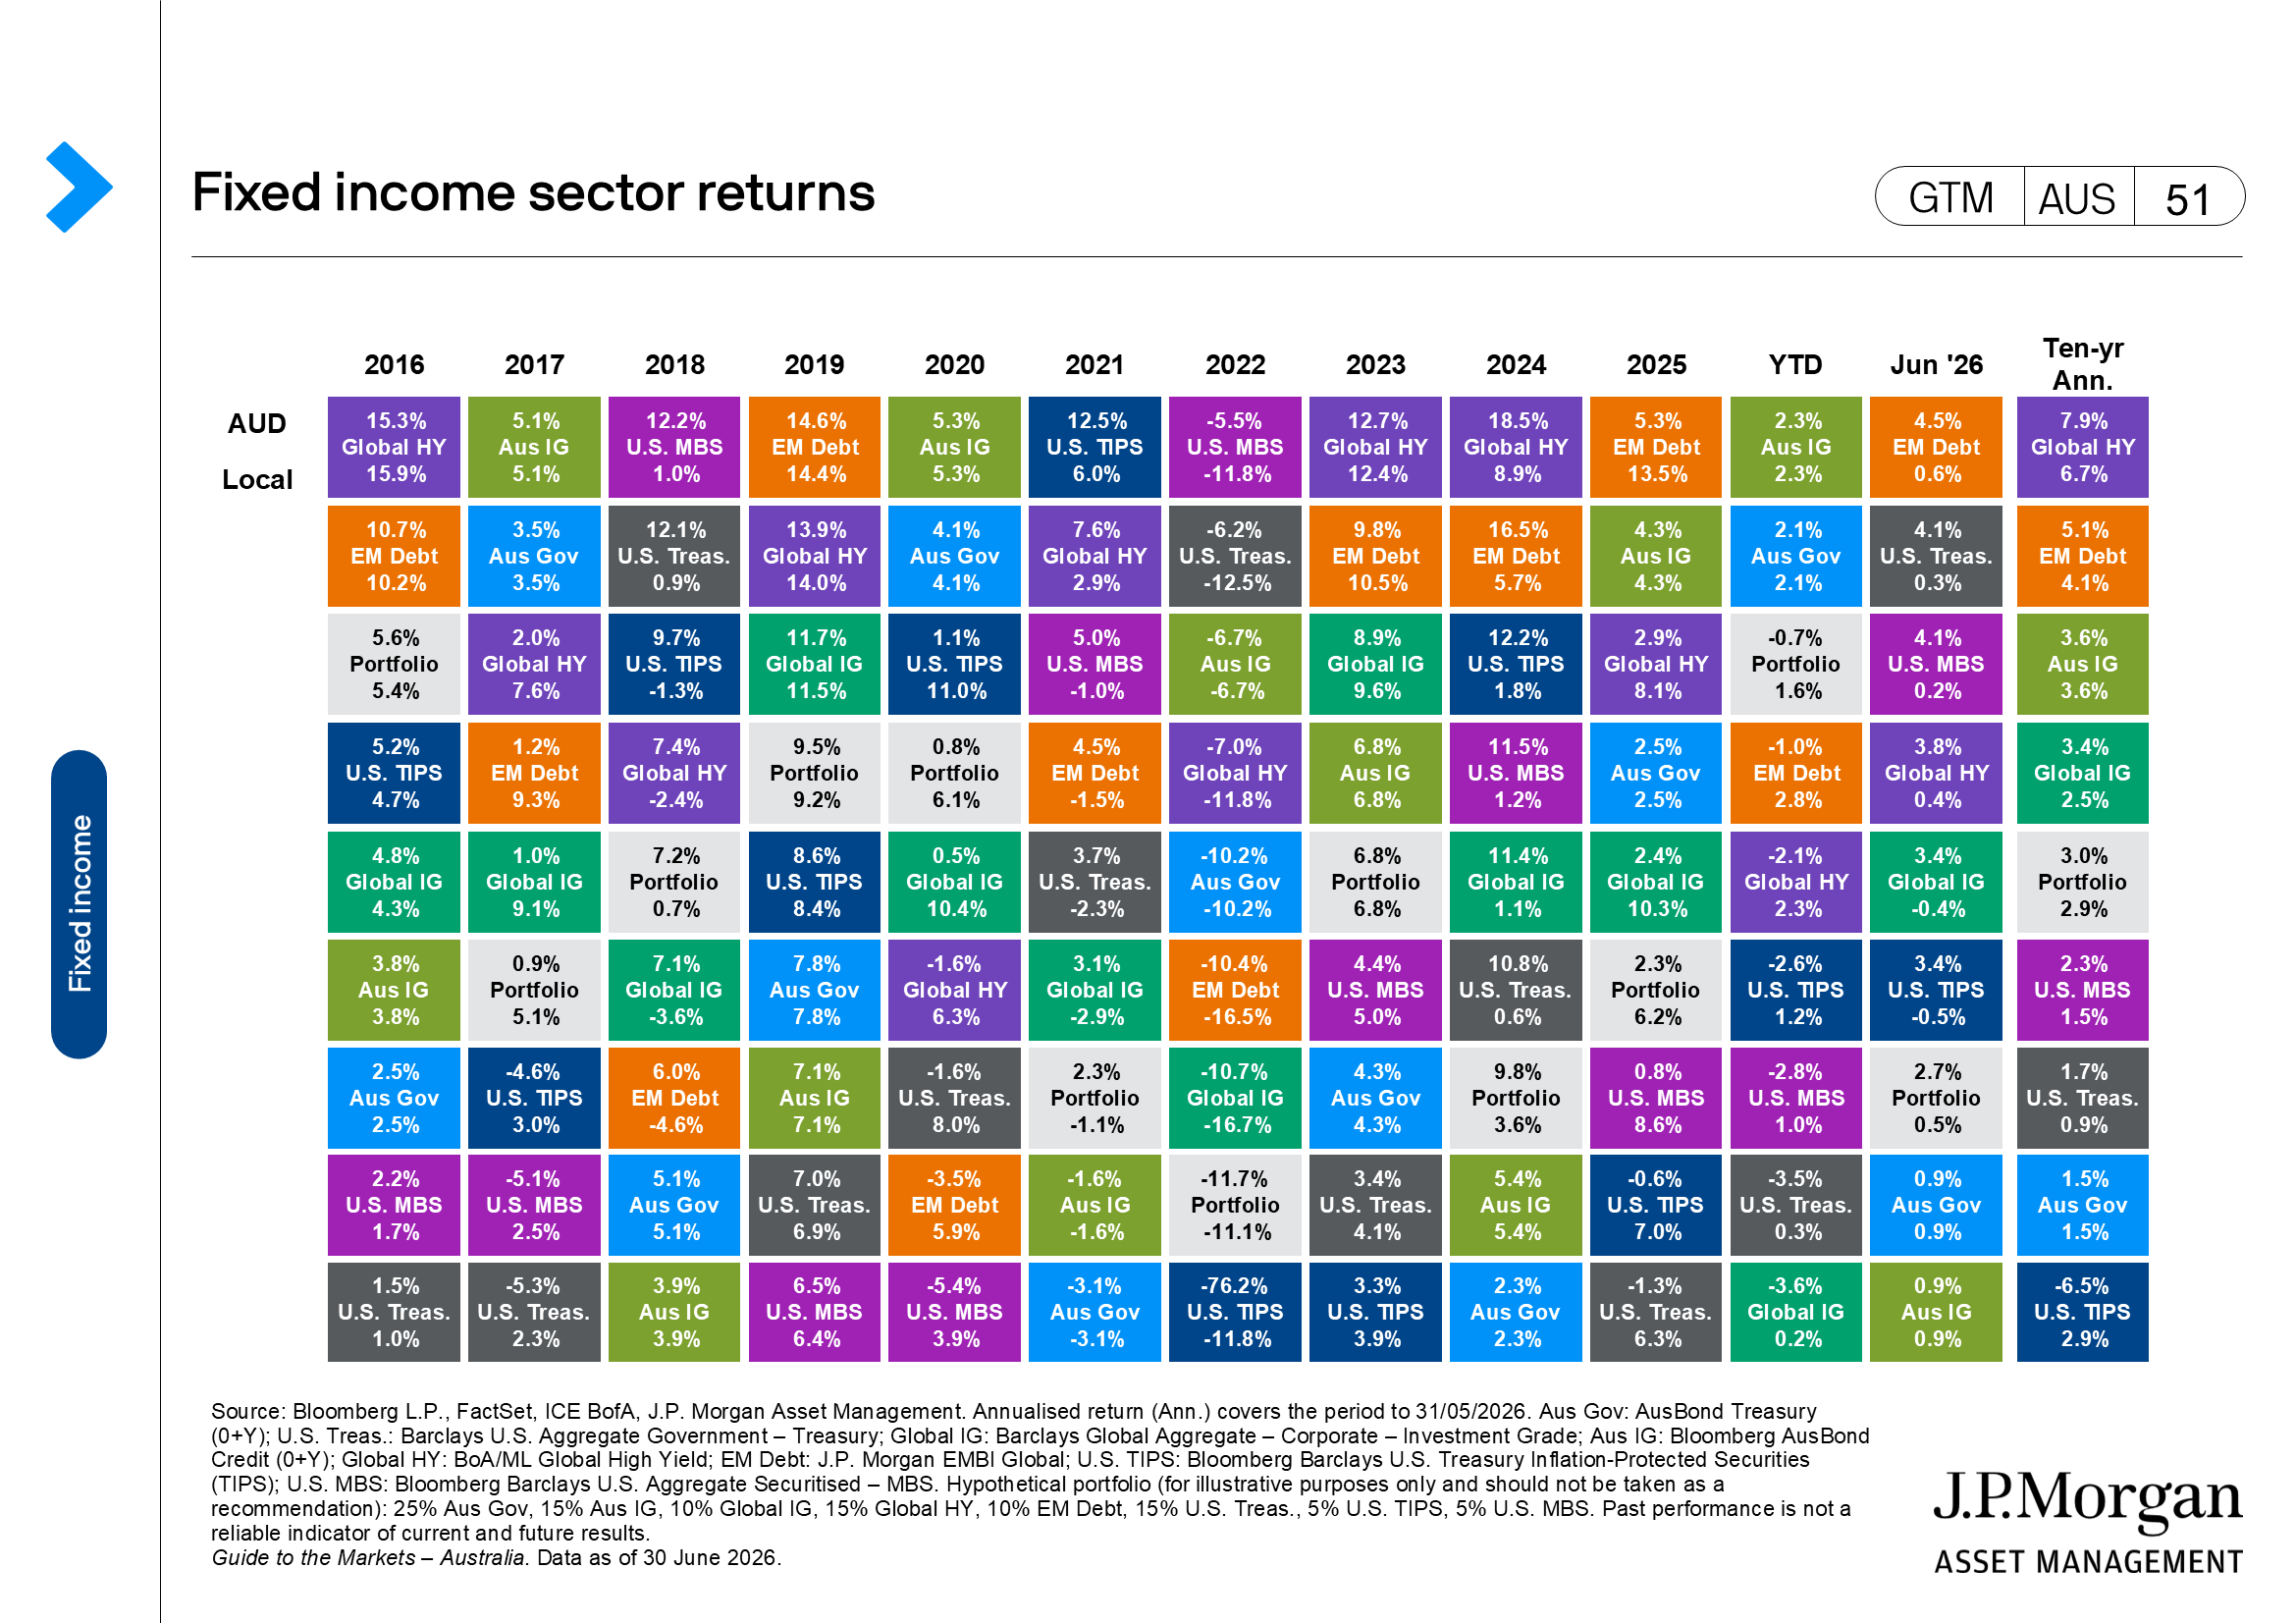
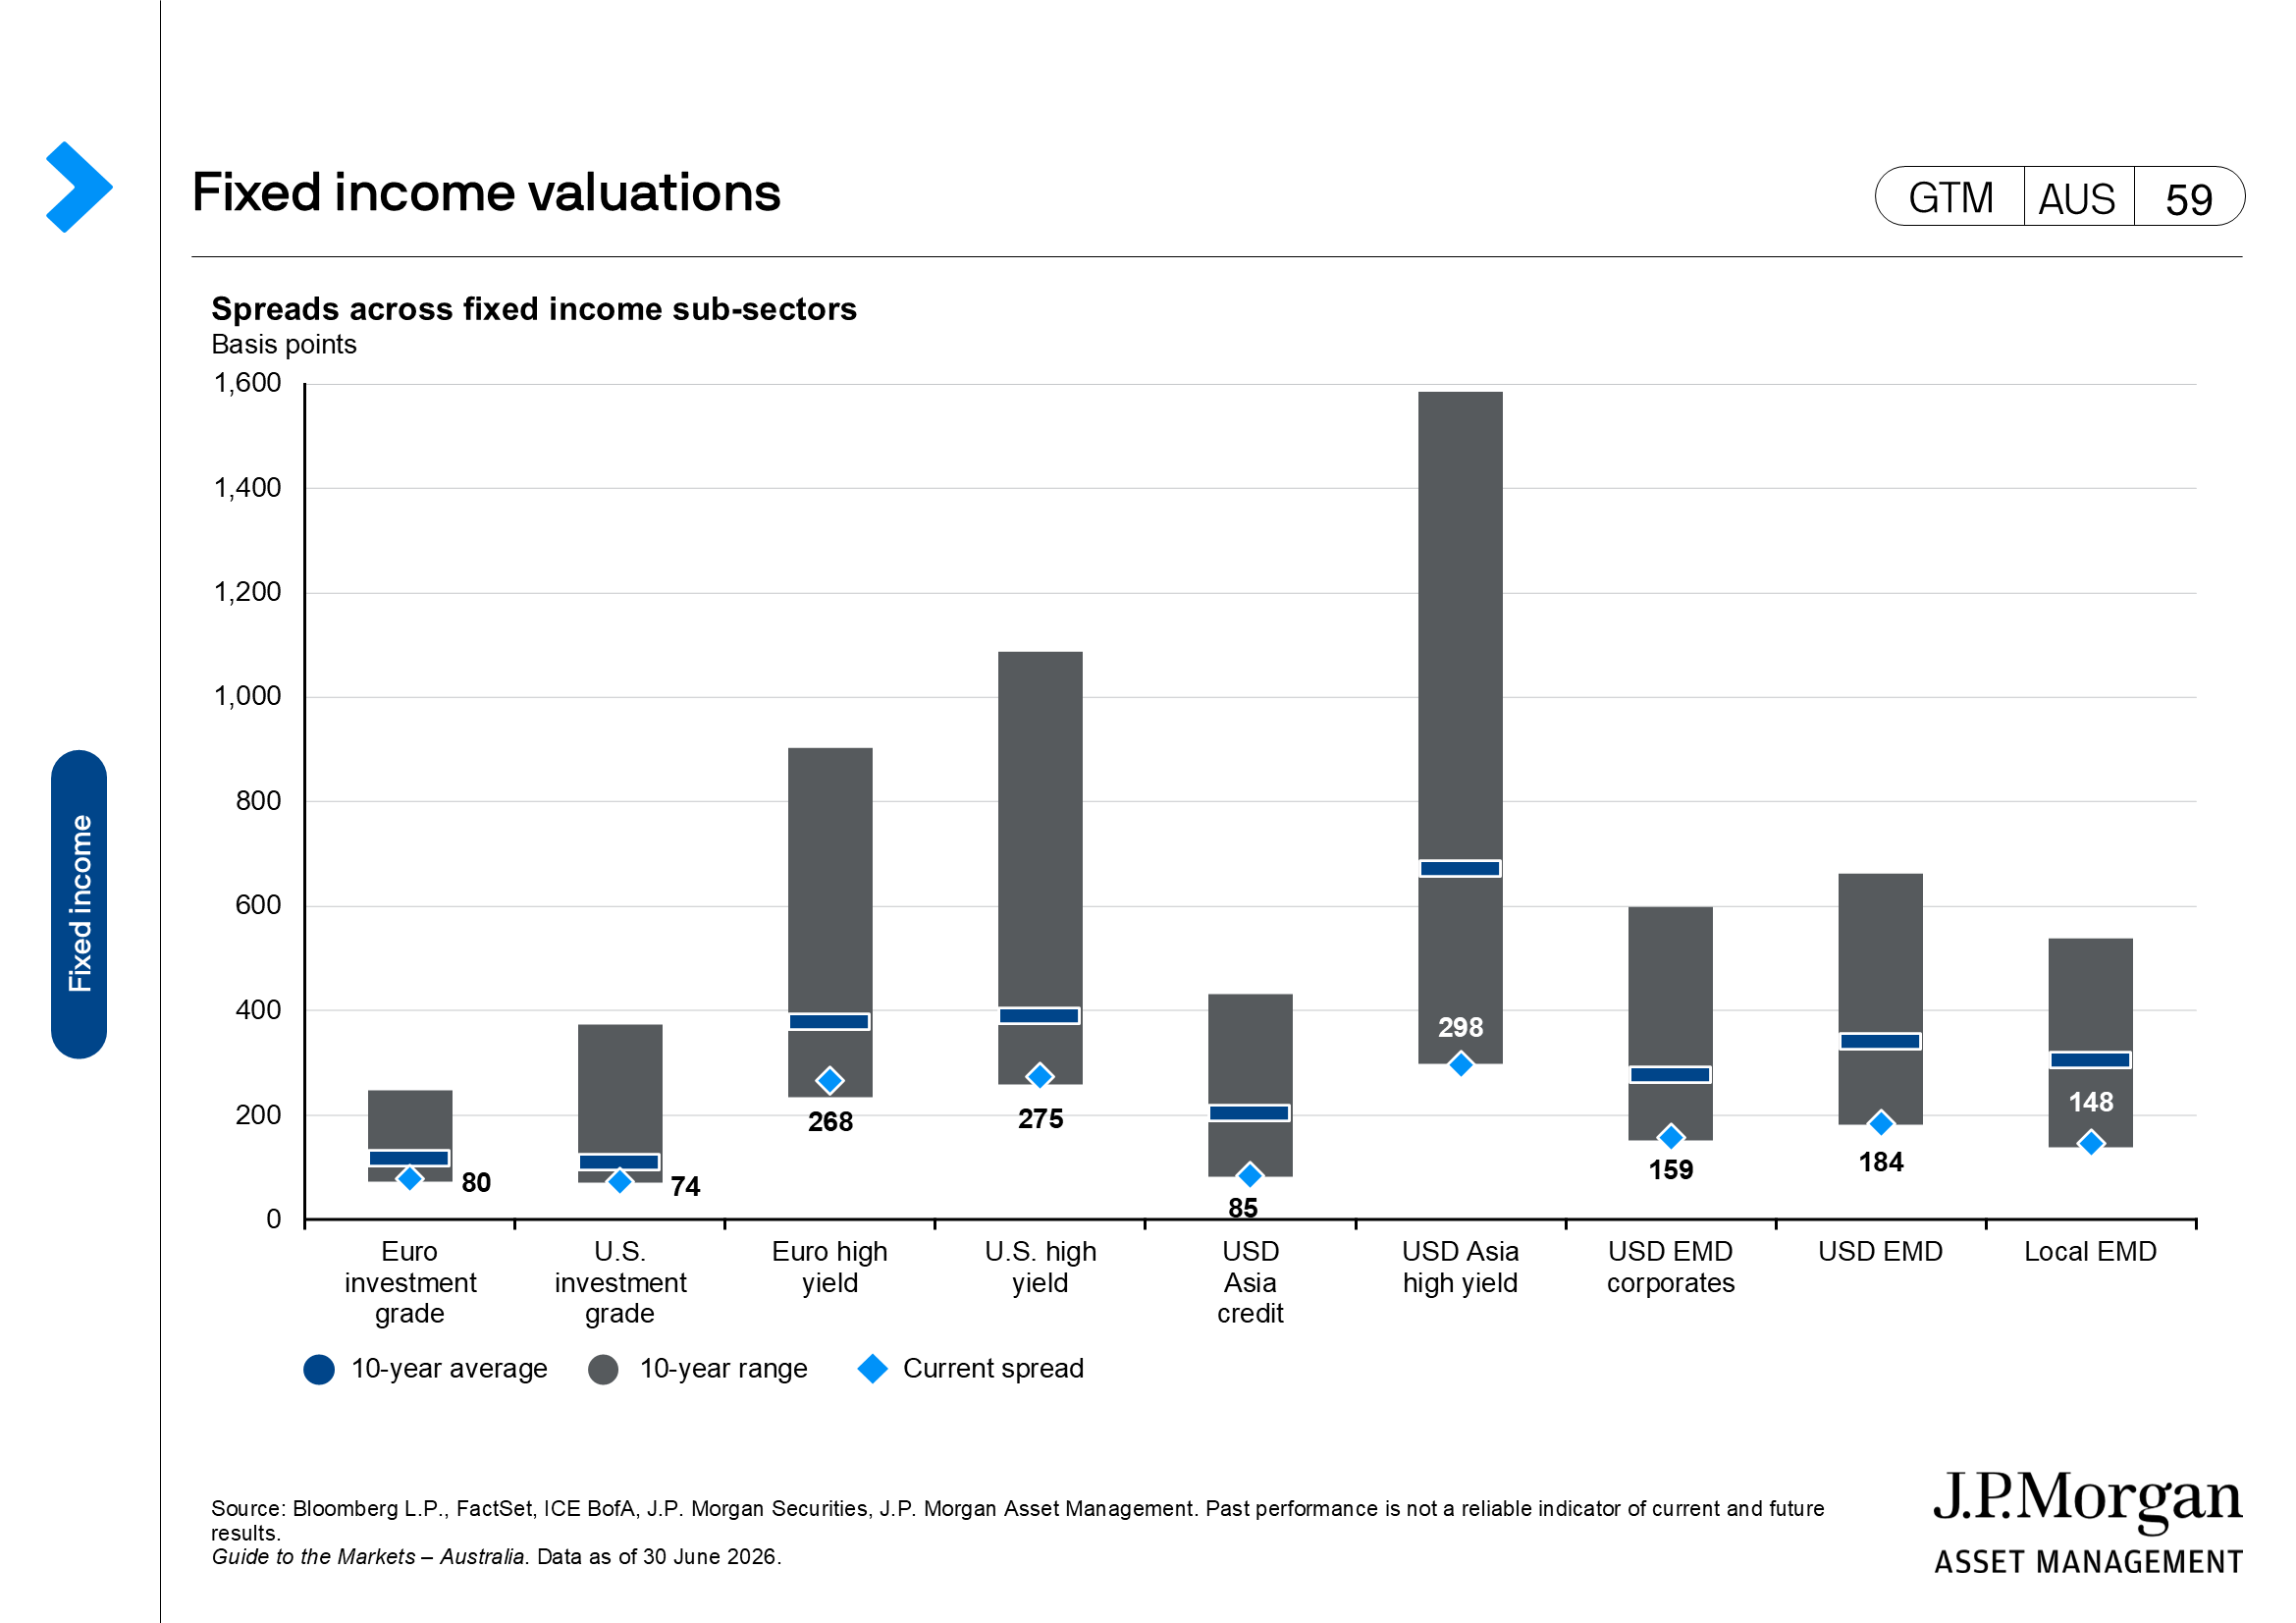
- Credit spreads nudged wider over the month, despite intra-month volatility due to the ongoing developments in the Middle East conflict. As such, global investment grade and high yield bonds returned -0.4% and 0.2%, respectively, with spreads widening by 2 bps and 3 bps and remaining near the tighter end of the historical range.
Alternatives
- According to PitchBook data, the number of global private equity deals in 2Q26 is estimated to have increased to 5,672, up from 5,552 in the last quarter. Momentum on deal value stalled, however, with deal activity estimated to amount to USD 420billion in 2Q26, lower than USD 544billion in the last quarter. Exit activity in global private equity also slowed, with USD 275billion across 948 exits estimated in 2Q26, down from USD 343billion across 1,000 exits in the last quarter.
- As for global venture capital, 2Q26 deal activity is estimated at USD 228billion across 10,595 deals, below the USD 333billion across 11,574 deals in the last quarter. However, exit activity has notably surged to USD 1,908billion in 2Q26, up from USD 438billion in the last quarter, due to a concentrated pipeline of mega-IPOs, while deal count is estimated to have increased modestly to 899, up from 871 in the last quarter.
- Based on LCD data, direct lending deals have slowed over the quarter, recording USD 33billion across 149 transactions, below the USD 74billion across 217 deals in the previous quarter, as borrowers likely struggled with rising input prices and a compounding effect from weak sentiment over software exposures.
Other financial assets
- Oil prices moved sharply lower as investors focused on the U.S.-Iran ceasefire, which reopened the Strait of Hormuz and began a 60-day window for further talks, particularly around Iran’s nuclear program. As flows through the Strait recover, oil prices fell back near pre-conflict levels by month-end. While renewed hostilities late in the month and U.S. President Trump’s threat to resume the war kept geopolitical risk in focus, the prospect of improved supply flows and easing disruption concerns outweighed those risks.
- Momentum on the USD continued, with the DXY index up 2.3% to 101.2 by month-end, as markets priced in a more hawkish interest rate path ahead. By contrast, most developed market currencies declined, with the EUR down 2.0%, the GBP down 1.5%, and the CHF down 3.1%. Asian currencies similarly pared losses, with the JPY down 2.0%, the KRW down 2.7%, and the TWD down 1.7%. That said, the CNY was relatively most resilient over the month and fell only 0.3%, and the INR also gained 0.4% as a result of the Reserve Bank of India’s policy changes to stabilize its currency.