


Insights on Artificial Intelligence
Artificial intelligence has moved from clever chatbots to an economic force reshaping industries, markets and global competition. This hub explores the AI story in depth, from the infrastructure supercycle to the winners and risks across the value chain.
-
The Agentic Boom
-
Financing the AI Buildout
-
Energy and AI Infrastructure
-
Business Adoption
-
AI and the Labor Market
-
Productivity Potential
-
The Private Market Landscape
The Agentic Boom
Since the launch of ChatGPT in late 2022, using AI usually meant asking a question and reading the answer. Today, AI usage looks a lot more involved, as users hand a model an entire task and let it work, reasoning through the problem, calling tools and writing code across many steps before returning a result, sometimes a few minutes or even hours later. Reasoning models of this kind already dominate AI usage, having gone from a negligible share at the start of 2025.1 This move from single-turn question-and-answer toward sustained, agentic workflows is reshaping the economics of compute, the competition among AI providers and the scale of the infrastructure built to run it.
AI is getting increasingly better at completing real world tasks

Agents are a lot more economically useful…
- AI is getting a lot better at completing real work. The length of task a model can complete on its own, measured against how long the same work takes a skilled technical human, has doubled roughly every three months since 2024.2 The most capable models now sustain multi-hour coding and research tasks, up from under 10 minutes a year ago, though that horizon shortens sharply outside software.
- Productivity gains are starting to show up. Where work is codifiable, the kind of task you could write down in a manual, delegating it to AI can be very effective. Businesses are citing profitable use cases across customer service, software engineering and sales and marketing. At Google, AI now generates roughly 75% of new code and the frontier AI labs report even higher shares, helping shorten product-development cycles and free engineers for higher-value work.3
- "Vibe coding" may be accelerating business creation and innovation. Coding agents empower people with no programming expertise to build software, and those users are likely behind the surge in new apps on the iOS App Store, up roughly 160% year-over-year, and in U.S. business applications, which are running near record highs of over 500,000 a month.4
… but they require a lot more compute
Because a single automated task can trigger dozens of inference calls, inference demand has compounded quickly, overtaking training as the dominant compute workload. Jensen Huang, CEO of Nvidia, puts the compute required for an agent working through a problem at 15 to 100 times what a person using the same model consumes.5 We are using more compute per query and using AI far more overall, and adoption is still early across most measures.
… and present real institutional challenges.
Capability is running ahead of the organizational changes needed to use it. Putting agents to work means orchestrating them across systems, redistributing tasks among teams, controlling the cost of running them at scale and retraining the people who work alongside them, and most firms are early in all of it. The result is a wide gap between what is technologically feasible and what has actually been adopted. Closing that gap, more than any further leap in capability, will set the pace and magnitude of AI’s productivity gains.
“Vibecoding” may be accelerating product development and new business formation

1 OpenRouter, "State of AI," December 2025.
2 METR, "Measuring AI Ability to Complete Long Software Tasks," August 2026.
3 Sundar Pichai, Google Cloud Next, April 2026.
4 New apps: Sensor Tower, July 2026. Business applications: U.S. Census Bureau, Business Formation Statistics, July 2026.
5 Nvidia 2Q earnings call, August 2026.
Financing the AI Buildout
Hyperscaler capital spending is on track to approach $800 billion in 2026, roughly 5 times what those same companies spent in 2023, and is expected to exceed $1 trillion annually from 2027. That is a faster buildout, and a larger one relative to the economy, than the late-1990s telecom buildout at its peak.
Spending on such a magnitude has surfaced two key debates for investors: whether it is sustainable, and whether it will pay off.
Building in response to robust demand
The rapid pace of spending reflects surging demand for compute, a key difference from the late-1990s internet buildout. Then, capacity far exceeded usage around the peak of the dot-com bubble in 2002, only 7% of the fiber-optic grid was in use, and it took years for demand to catch up. Today, the reverse is true, with more than 80% of data center capacity under construction already leased and hyperscalers routinely citing capacity constraints on their earnings calls. Cloud revenue across the major platforms is growing fast, up an average 52% year-over-year in the second quarter of 2026, and as AI adoption broadens and deepens, leading providers are racing to secure compute years in advance.
The composition of that spending has also turned healthier. Two years ago, the bulk went to training ever-larger models on a speculative bet about future demand. Today, most new capacity is built for inference, the utility layer enterprises actually use, now roughly two-thirds of AI compute. That ties more of the buildout to monetizable demand rather than pure speculation, which helps explain how spending has held up even as scrutiny of returns has intensified.
Balance sheets are strong but starting to fray at the edges.
A defining feature of this investment wave has been how much of it the hyperscalers can self-fund. Operating cash flow across the five largest is set to approach $800 billion this year, a significant feat from a small number of companies. However, as large as that cushion is, it is thinning quickly. Capex absorbed roughly 60% of operating cash flow in 2025 and is set to take essentially all of it in 2026, pushing free cash flow negative for the first time in the group’s history.6
AI capex is overwhelming free cash flow, but hyperscaler valuations better reflect the risk
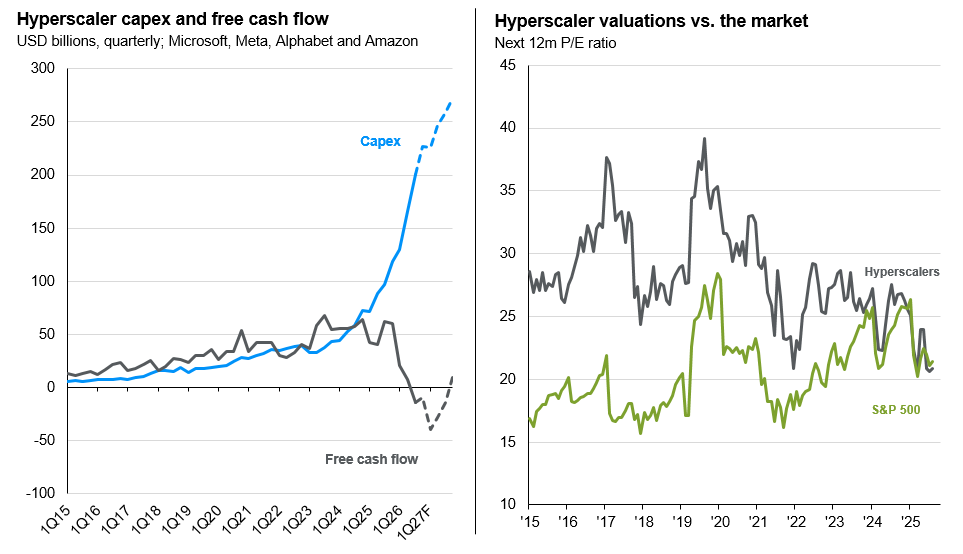
To bridge the gap, the most cash-rich companies in the market have become major bond issuers, at a scale that is now reshaping the asset class.
- Hyperscaler issuance is set to more than double this year, taking these five companies from just under 3% of the investment grade index before the buildout to more than 7% by next year.
- A growing share of the financing is off-balance sheet, structured instead as leases, joint ventures and private credit vehicles.
- In aggregate, the balance sheets of these companies remain sturdy, with a more inclusive leverage metric at 1.3x net debt-to-EBITDA, well below the 2.7x typical of investment grade issuers.
- But investors are demanding a premium, with hyperscaler spreads widening about 30bps this year against just 2 bps for the broad investment grade market, and spreads could continue to widen as issuance grows.
The spending is, in part, existential.
There is good reason to expect the buildout to continue. It is grounded in real demand today, but it is also defensive—these are incumbents reinventing themselves for an AI era, and missing the wave could erode their market dominance. Less certain is whether the spending pays off on the timeline the market wants, and their share prices are increasingly bearing the brunt of that uncertainty, leading to growing divergence in performance across the AI value chain this year.
For investors, diversification across the spenders and the builders can help navigate this uncertainty. So long as capex remains robust, companies selling "picks and shovels" should be well positioned, across chips, networking, power, cooling and the industrials and utilities serving the load growth. The financing side is widening the opportunity set too, with the surge in hyperscaler bond issuance and the growing use of private credit bringing more high-grade AI exposure into fixed income and alternatives. But whether through the equity or the debt, the durability of this boom rests on the same conditions: that the spenders earn their return, that end-user demand shows up and that leverage stays contained as issuance climbs.
As investment and adoption deepen, value shifts across the AI value chain

6 Bloomberg consensus, August 2026.
Energy and AI Infrastructure
Power is emerging as the binding constraint of the AI buildout. After 25 years of essentially flat U.S. electricity demand, data centers have triggered load growth not seen since the 1950s, and the gap between when a data center can be built and when the power to run it becomes available is creating critical bottlenecks.
Demand is surging at every level of the stack.
- Data centers currently account for roughly 4% of U.S. electricity consumption, a share that could roughly triple by 2030.7
- A single large campus can now draw more than a gigawatt of power, as much electricity as Boston, and the largest planned sites target several times that.
- Each new chip generation raises the bar further, with power-per-server rack climbing from 5-20 kilowatts a few years ago toward 600 kilowatts for the latest systems.
- Grid planners now expect the country’s peak electricity draw to rise by about 24% over the next decade, a nearly 70% larger increase compared to what they estimated just a year prior due to data centers.8
While supply cannot keep pace.
A new data center can be built in two to three years, but new power generation typically takes five to ten, and the transmission to connect it can take longer still. Much of the U.S. grid is decades old, designed in the 19th century and built out in the mid-20th, now absorbing 21st-century loads, and closing the gap could require an estimated $720 billion of grid investment through 2030.9 This has led to acute scarcity in the market. Data center vacancy at the major U.S. markets sits at a record-low 1.4% even as construction has hit an all-time high of 7.5 GW, with a potential 300 GW in planning stages.10
The “all hands on deck” approach to secure power has brought renewed focus to many energy alternatives and technological solutions:
- Interest in nuclear has reignited, with hyperscalers signing long-term deals for everything from restarting Three Mile Island to new small modular reactors, though only two new U.S. reactors have come online this decade and most remain years from producing power.
- Natural gas is filling the near-term gap, with every major turbine maker now sold out through 2030 (up from almost no U.S. orders in 2022).11
- Operators are also reaching for on-site fuel cells, geothermal and co-located solar paired with battery storage, and increasingly building their own power rather than waiting for the grid.
Local opposition is reshaping where data centers get built, and who pays for them.
Community resistance has hardened sharply. A 2026 Gallup poll found that seven in ten Americans would oppose a data center near them, including 48% who were strongly opposed.12 Data Center Watch estimates that local opposition blocked or delayed roughly $200 billion of planned projects in the first half of 2026 alone.
The pushback is also changing the economics of projects that do move forward. Regulators and utilities are increasingly adopting “large-load” tariffs designed to reduce the risk that households and other customers bear the cost of grid infrastructure built for data centers. More than 100 approved or proposed large-load tariffs and service rules now span 37 states. In Ohio, for example, large new data centers are generally required to pay for at least 85% of their contracted capacity for up to 12 years, even if actual electricity use falls short.
This means large electricity users are likely to commit more capital and assume more of the risk associated with the infrastructure built to serve them. That can raise the upfront cost of development, but it can also give utilities greater certainty to invest in the generation and grid capacity needed to support continued load growth.
For investors, power and energy infrastructure still offer an attractive, more defensive way to access the AI theme, since these assets typically carry contracted revenues, regulated returns and real asset backing, and the grid modernization cycle looks structural rather than cyclical. Feasibility varies by geography and depends on regulatory, community and cost-allocation hurdles, so a close read of the underlying assets is critical and can give active managers an edge across power generation, transmission, grid modernization and private infrastructure.
The time to build new power extends 5 to 10+ years for many sources

7 DOE/Berkeley Lab, 2025; Goldman Sachs.
8 North American Electric Reliability Corporation, 2025 Long-Term Reliability Assessment, January 29, 2026.
9 Grid investment: Goldman Sachs, "AI to Drive 165% Increase in Data Center Power Demand by 2030;" CBRE, North America Data Center Trends, H2 2025.
10 Current capacity: CBRE's North America Data Center Trends H1 2026; Planned capacity: JP Morgan Investment Research, “AI Capex - Financing the Investment Cycle,” Nov. 2025.
11 GE Vernova and Siemens Energy order books, 2026.
12 Gallup, “Americans Oppose AI Data Centers in Their Area,” June 2026.
Business Adoption
AI adoption across U.S. businesses is accelerating, but while the technological frontier appears exponential, diffusion through the real economy is much more linear, jagged and full of organizational friction.
Roughly 20% of firms report using AI in the Census Bureau's survey and measures of corporate spending, investment and earnings-call attention run far higher, yet only a small minority can point to specific improvements in the bottom line.13 That does not necessarily mean AI efforts are failing or underwhelming, but it does emphasize the need for businesses to think holistically about proper AI adoption.
We identify these three potholes as People, Processes and Price.
Business adoption has been rising gradually

People. Habits are slow to change, and harnessing AI requires a period of discovery for workers and businesses. The first step is simply putting the tools in employees' hands, and employees seem well ahead of their employers here—roughly 78% of AI users bring their own tools to work.14 Left to ad-hoc usage, adoption stays fragmented and seldom translates to a firm’s bottom-line. Approaches vary widely, but firms that establish proper AI governance and retrain their workers are more likely to pull ahead and scale productivity gains.
Processes. Putting AI to work in an enterprise requires several key decisions:
- What to trust AI with, and what to keep under human judgment?
- How to train reliable agents for specific tasks?
- Which workflows need oversight, and how much?
- Whether to build or buy, and from whom?
Most companies are picking the 'low hanging fruit' of doing today's tasks faster and automating routine work, but larger gains will come from redesigning workflows and even job descriptions around the work handed to AI. Few firms are there yet—among businesses using AI, only about one in five have built new workflows around it and roughly two-thirds have made no operational changes at all.15
Price. Agentic tools are turning out to be expensive and hard to budget for. After Uber gave their engineers access to agentic coding tools, the company blew through its full-year 2026 AI coding budget in April.16 An era of “tokenmaxxing”, or using as much AI as you can, is shifting to a focus on “token-optimizing”, where token efficiency will be needed for businesses to properly scale AI. It also raises the question of whether an agent, particularly one sophisticated enough to do a person's work reliably, can do so cost effectively once compute and organizational overhead are counted.
Even so, the willingness to spend keeps climbing. Chief financial officers expect to raise AI spending per employee by about 50% this year, to roughly $2,000 on average, and the Wharton AI Institute found 88% of enterprise leaders expect to increase generative-AI budgets.17 Businesses may be hunting for ways to bring token costs down but are not generally derailing their AI adoption plans.
The enterprise opportunity is a lot bigger than an LLM subscription. In the computer era, Brynjolfsson and colleagues found that each $1 of hardware was associated with close to $9 of complementary investment in the organizational change around it.18 If AI follows suit, most of the spending is still ahead, in the data platforms, agent tooling, security and integration work needed to put AI to use. Bloomberg Intelligence puts the generative AI market on track to reach roughly $2.3 trillion by 2032, more than a fifth of all technology spending.
Firms are ramping AI spending by 50+% this year, especially those in professional services

13 U.S. Census Bureau, Business Trends and Outlook Survey, May 2026.
14 Bring-your-own-AI: Microsoft Work Trend Index, 2025.
15 McKinsey, "The State of AI," November 2025.
16 The Information and Bloomberg, May and June 2026.
17 AI spend per employee: Federal Reserve Banks of Atlanta and Richmond and Duke University's Fuqua School of Business, May 2026. Budget intentions: Wharton AI Institute enterprise survey, October 2025.
18 Brynjolfsson, Hitt and Yang, "Intangible Assets: Computers and Organizational Capital," Brookings Papers on Economic Activity, 2002.
AI and the Labor Market
The U.S. economy continues to operate in a low hiring, low firing equilibrium. The hiring rate has slipped to around its lowest in over a decade while layoffs remain subdued, leaving the unemployment rate steady at 4.1% as of August. But there is a growing sense that AI may be reshaping labor demand. Companies increasingly blame it when they announce layoffs, and while the economy-wide data show no measurable hit to employment yet, high task exposure to AI raises questions around whether human effort will be amplified or replaced.
No signs of a job-pocalypse yet: Layoff announcements overall are falling, despite AI being increasingly cited. Layoff announcements have averaged just 66k per month so far in 2026, the lowest rate since 2022, and announced hiring plans have ran 37% higher than last year. AI was cited most often for layoff announcements, but the hard data on layoffs and unemployment have remained tame.19 Indeed, some of this messaging may be “AI washing,” where companies prefer to cite AI over the real macro reasons inducing belt-tightening, like higher input costs or interest rates. It could also reflect a reshuffling of roles around new AI tools, as AI-related layoffs must also be considered against AI-related hiring, which LinkedIn estimates has resulted in 1.3 million new roles globally.20
So far, AI looks far more augmentative than displacing. Some occupations are clearly more exposed to AI’s capabilities today. Stanford's "Canaries in the Coal Mine" paper, tracking ADP payroll data, estimates a 19% relative decline in employment for young workers in the most AI-exposed roles, with entry-level software developers and customer-service staff among the hardest hit.21 But the strain appears narrow, not broad. Unemployment for all young workers (aged 20-24) sits at 7.1%, only modestly above its 2023 record low. And the popular notion that a tough job market for college grads is due to AI may be misguided. Much of the weakness in recent-graduate employment predates ChatGPT and could reflect higher remote work, which makes junior hires harder to mentor and ramp up.22
Where AI is having a clear impact, it mostly substitutes for narrow, well-defined tasks while augmenting more experienced workers. Anthropic's Economic Index, which analyzes how its models are being used, finds collaborative use still outweighs full automation, at 52% of Claude.ai conversations, and that how people prompt the model closely tracks what they get back, a reminder that the skilled human operator still shapes the result.23
AI is shifting the skills and jobs most in demand today, with demand for AI talent climbing:
- AI Engineer is now the fastest-growing job title. U.S. postings for the role climbed 143% in 2025.
- Companies are hiring for AI literacy. U.S. roles that call for some AI fluency grew about 70% over the same period, spreading well beyond the tech sector.
- AI skills now command a wage premium. Postings that require them offer wages 28% higher than comparable roles without those skills.24
But the bigger reshaping is still ahead. What AI is used for today is only a fraction of what it could do. Across occupations, the share of tasks theoretically exposed to AI dwarfs the share it actually touches now, and the gap is widest in the highest-skill, highest-paid work. In computer and mathematical roles, AI combined with complementary software tools could theoretically reach an estimated 94% of tasks but only 33% of tasks show up in observed Claude usage today. In business and management the gap is even wider, with potential exposure near 90% against current exposure of 10 to 25%.25 Granted, adoption may never reach those theoretical limits, held back by cost, reliability, regulation or the human judgment many tasks still demand. McKinsey’s work suggests as much as 57% of U.S. work hours are theoretically automatable, but only 27 to 30% realistically will be over the next five years.26
Exposure is not displacement, though. Past technologies tended to reshape work rather than erase it: banks hired more tellers as ATMs spread, and radiologists are more in demand than ever despite more than 1,000 FDA-approved radiology tools. The labor market is in the early stages of what could be the most significant reorganization of work in generations, and AI still seems more likely to impact how people work rather than whether they work at all.
High AI exposure across the economy should drive job transformation

Source: Anthropic Economic Index, Eloundou et al. (2024), O*NET, Bureau of Labor Statistics, J.P. Morgan Asset Management.
Potential exposure is the share of an occupation's tasks that large language models, paired with complementary software, could perform with meaningful time savings, from Eloundou, Manning, Mishkin and Rock (2024). Current exposure is the share of tasks with observed, work-related Claude usage, as published by Anthropic. Exposure is not the same as adoption. It captures where AI could do the work or is already being tried on it, not whether firms have built it into how work gets done.
Data as of September 30, 2026.
19 Challenger, Gray & Christmas.
20 LinkedIn Economic Graph, 2026.
21 Stanford Digital Economy Lab, "Canaries in the Coal Mine," Brynjolfsson, Chandar and Chen, August 2026 update, using ADP payroll data through June 2026.
22 Natalia Emanuel, Emma Harrington and Amanda Pallais, "Remote Work Leaves Younger Workers Sidelined," Liberty Street Economics, Federal Reserve Bank of New York, June 1, 2026.
23 Anthropic Economic Index, Jan 2026 and March 2026 reports.
24 AI Engineer ranking and AI-literacy demand: LinkedIn Economic Graph, 2026. AI-skill wage premium: Lightcast, 2026.
25 Potential versus current AI exposure: Anthropic Economic Index (current exposure, as of February 28, 2026), Eloundou, Manning, Mishkin and Rock (2024) (potential exposure), O*NET and U.S. Bureau of Labor Statistics. Potential exposure measures tasks theoretically exposed to AI, not adoption.
26 McKinsey Global Institute, “Agents, Robots and Us,” 2025.
Productivity Potential
Paul Krugman once noted that “productivity isn’t everything, but in the long run it is almost everything.” Productivity growth raises living standards, supports corporate earnings and tends to moderate inflationary pressures, a backdrop that is constructive for both equities and fixed income. With AI poised to become the next general-purpose technology, the evidence increasingly suggests the economy may be on the cusp of a new productivity upswing.
In our 2023 whitepaper, The transformative power of generative AI, we explored adoption scenarios that could lift U.S. productivity growth to between 1.0 and 4.0% annually over the next decade. The signs of an upswing may already be emerging. Nonfarm business productivity rose 2.8% over the four quarters through Q1 2026, a notable acceleration from the 1.8% averaged over the previous ten years.
We are cautious, however, about crediting AI for that strength. General-purpose technologies work through long lags, and the economy still appears to be in the early innings of diffusion, with AI’s larger gains ahead. However, early evidence has emerged, with a growing body of research suggesting encouraging, though varied, productivity impacts across a range of white-collar work.
Source: J.P. Morgan Asset Management. Studies are randomized controlled trials or field quasi-experiments measuring task-level productivity gains. Brynjolfsson et al. (2023) studied 5,179 customer service agents using generative AI, with the largest gains for novices. Noy & Zhang (2023) ran a writing experiment with 453 professionals using ChatGPT. Dell'Acqua et al. (2023) studied 758 BCG consultants in a field experiment, measuring how AI impacted performance on relevant consulting tasks. Microsoft (2025) analyzed internal Copilot use for knowledge work (i.e. email and document production). UK AISI (2026) is a field study of knowledge workers across mixed occupations. METR (2025) studied experienced open-source developers working on their own GitHub codebases: AI users took 19% longer despite self-reporting they were 20% faster, attributed to excess review/debugging time. METR could not replicate the study in late 2025 using more agentic tools because 30-50% of participants refused to complete tasks without AI. Agarwal et al. (2026), Ju & Aral (2025), and Choi & Xie (2025) cover agentic coding, marketing/ad creation, and accounting; see Stanford AI Index 2026, Figure 4.4.27. Data as of September 30, 2026.
How quickly this reaches the aggregate data is the open question. Past general-purpose technologies took 15 to 20 years to show up in the productivity statistics, and AI’s pace will depend on how fast firms adopt it and reorganize around it.
For investors, this is one of the most fundamental forces we build into our long-term view. As we set out in our Long-Term Capital Market Assumptions, a stronger productivity trajectory underpins our conviction that U.S. equities remain well-positioned, that profit margins can expand and that margin gains can broaden beyond the technology leaders. It could also lift the economy’s neutral rate, a question the Federal Reserve will face if AI drives a genuine boom. And while AI is often cast as disinflationary over time, its early phases are more likely to add to inflation than subtract from it, as capital floods scarce infrastructure assets well before the efficiency gains from using AI fully materialize.
AI presents significant long-term productivity upside

*J.P. Morgan Asset Management estimates plausible productivity gains of 1.4-2.7% from generative AI and other AI technologies over the next few years, in addition to the expected 1.5% annual productivity growth projected by the Congressional Budget Office.
Source: BLS, NBER, J.P. Morgan Asset Management. Data from 1888 to 1957 reflect productivity data for the total private economy from John Kendrick, “Productivity Trends in the United States,” NBER. Data from 1958 to 2023 reflect non-farm productivity data from the BLS. Forecasts, projections and other forward-looking statements are based upon current beliefs and expectations. They are for illustrative purposes only and serve as an indication of what may occur. Given the inherent uncertainties and risks associated with forecasts, projections or other forward-looking statements, actual events, results or performance may differ materially from those reflected or contemplated. Data as of September 30, 2026.
The Private Market Landscape
Unlike the dot-com era, which saw an explosion of young companies going public pre-revenue, today’s AI race is characterized by disruptive firms achieving public-company scale and valuation while staying private. As a result, the contest for AI leadership is now playing out largely in private markets.
2026 is shaping up to be a record year for AI deal activity. AI companies captured 86% of every venture dollar deployed in the first half, up from roughly two-thirds in 2025, and U.S. startups took in more capital in six months than in any full year on record.27 Exit activity also accelerated, led by SpaceX’s June listing, which raised more than $85 billion at a record $1.7 trillion valuation and accounted for the vast majority of second-quarter exit value.
Liquidity is beginning to return, but the recovery remains narrow.
For much of the past three years, capital continued to flow into private markets even as exits remained limited, leaving investors with fewer distributions and employees and founders with fewer opportunities to sell. 2026 marks an improvement, but the headline numbers remain highly concentrated. Excluding SpaceX, exit activity looks much closer to the subdued levels of recent years. And exit value does not translate immediately into cash returned to investors, as lockups and fund distribution timelines mean liquidity can take time to reach investors and employees.
Several dynamics are worth watching:
- AI companies are scaling faster. Breakout AI-native startups are reaching $100m in annual recurring revenue (ARR) in as little as 18 months to four years, milestones the average software unicorn historically took 8-10 years to reach.28
- Private for longer. Private markets now total roughly $20 trillion in assets, and that depth of capital is changing when and whether companies go public at all. Roughly 40% of private unicorns are now more than ten years old, and 41% have not raised since at least 2022.
- AI startups are major acquirers themselves. Well-funded AI startups, beyond Big Tech, accounted for roughly a third of all venture-backed M&A deals in 2025. This gives startups another potential path to liquidity beyond an IPO or acquisition by a public company, and points to greater consolidation in the AI race.
- IPOs remain selective. 17 unicorns went public in 2025 and the broader U.S. IPO market has accelerated in 2026. Yet IPOs remain selective, and public markets could prove to be a tougher crowd for some of these companies, particularly as the AI behemoths test the waters.
In portfolios, there is a real appeal to private markets for investors. Our Long-Term Capital Market Assumptions puts the long-run expected return on private equity at 10.2%, among the highest of any asset class, an estimate recently raised in part on the strength of AI. Venture capital sits slightly lower at 8.5% and carries the highest volatility of the group, so the most concentrated AI exposure also brings the widest range of outcomes. Indeed, private investments are illiquid, offer less visibility into the underlying companies, and carry a high risk of failure in a fast-moving AI landscape. Those features make diversification essential, and investors are generally better served by vehicles built to spread risk across many managers and companies within private equity, and across alternatives more broadly, than by concentrated exposure to any single fund or name.
Private AI companies are reaching meaningful scale before going public

Source: Bain and Company, PitchBook Data, Inc, J.P. Morgan Asset Management.
(Left) Classification categories are from PitchBook. A unicorn is defined by PitchBook as a venture capital-backed company with a post-money valuation of over $1 billion. Companies that have gone public, been acquired by another company or had their valuation fall below $1 billion are no longer counted as a unicorn. Past performance is not a reliable indicator of current and future results.
Guide to Alternatives. Data are based on availability as of September 30, 2026.
27 PitchBook NVCA Venture Monitor, second quarter 2026, data as of June 30, 2026.
28 Bessemer Cloud 100 Benchmarks.
AI Presentation


Latest Insights
206c164a-6480-11ee-8fe5-9dc5c8727cb0