The US recovery is now the longest on record. Nobody knows exactly how much longer this expansion will last. But as we discussed in our turning the dial 1 paper, expansions do not last forever. For those investors who are concerned about an equity market downturn, we outlined a number of shifts in allocation that might increase the resilience of a portfolio.
1Turning the dial: Portfolio considerations in the late cycle, Karen Ward & Michael Bell, J.P. Morgan Asset Management, September 2018
HERE, WE CONSIDER THESE SEVEN STRATEGIES IN MORE DETAIL.
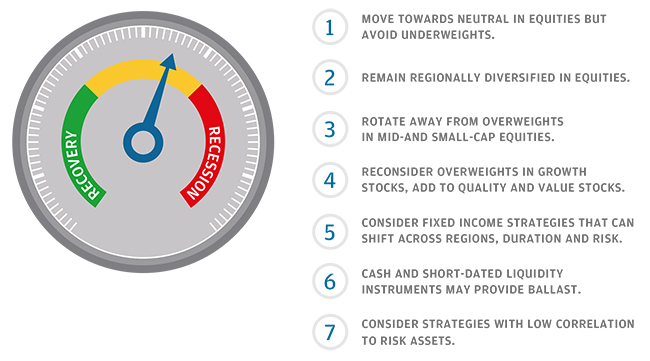
1. Move towards neutral in equities but avoid underweights
In the run-up to the start of a US recession equities can deliver strong positive returns. This highlights the risk of going underweight equities too early. For example, an investor who called the dot-com bubble too early would have missed out on a return of 39% in the final two years, or 19% in the final year, of the S&P 500 rally. Once the market starts to price in recession though, equities struggle. Markets have peaked anywhere between zero and 13 months prior to the start of a recession. Given the difficulty of precisely timing market peaks and troughs, investors may want to consider moving closer to neutral in equities in the late stage of the economic cycle.
Late cycle equity returns can be very strong
S&P 500 RETURNS AROUND MARKET PEAKS
% PRICE RETURN, BEFORE AND AFTER MARKET PEAK
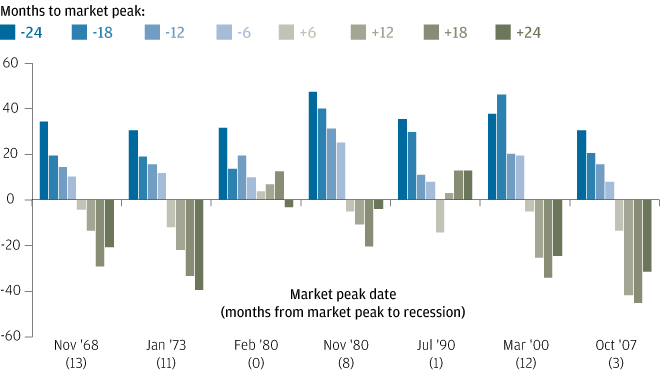
Source: Standard and Poor’s, Thomson Reuters Datastream, J.P. Morgan Asset Management. Market peaks are defined as the peak of the S&P 500 prior to a US recession, as defined using US National Bureau of Economic Research (NBER) business cycle dates. Past performance is not a reliable indicator of current and future results. Data as of 31 July 2019.
2. Remain regionally diversified in equities
A shift in regional allocation rarely helps cushion performance in a market correction. Investors concerned about a potential recession in the US may be tempted to shift away from US equities into other equity markets, but during US recessions stock markets in all regions tend to fall—sometimes by more than US equities. When you add in the fact that the dollar appreciated during the last two recessions, it’s far from clear that concerns about a US recession should lead investors to shift from US equities into other equity markets. Investors are normally better off maintaining a regionally diversified portfolio.
US recessions don’t mean US equities underperform
EQUITY MARKET MAXIMUM DRAWDOWN IN GBP
% PRICE RETURN
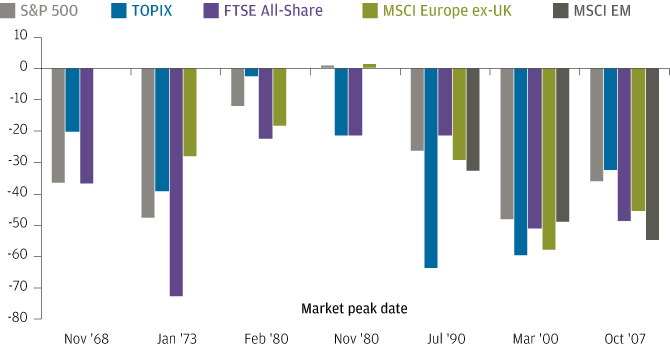
Source: FTSE, MSCI, Standard and Poor’s, TOPIX, Thomson Reuters Datastream, J.P. Morgan Asset Management. Maximum drawdown is calculated using price index level data and is shown for all indices where available. Market peaks are defined as the peak of the index prior to a US recession, as defined using US National Bureau of Economic Research (NBER) business cycle dates. Past performance is not a reliable indicator of current and future results. Data as of 31 July 2019.
3. Rotate away from overweights in mid- and small-cap equities
Small-cap stocks tend to underperform the market during recessions, particularly in the UK. Between May 2007 and December 2008, UK mid-cap stocks underperformed the FTSE 100 by 18% and have since outperformed by 200%. The average UK equity fund has over 40% in mid- and small-cap equities, which is over 20% more than the FTSE All-Share.
Small-cap equities often underperform during recessions
FTSE SMALL-CAP/FTSE 100 RELATIVE PERFORMANCE
RELATIVE TOTAL RETURN INDEX LEVEL, REBASED TO 100 IN 1986
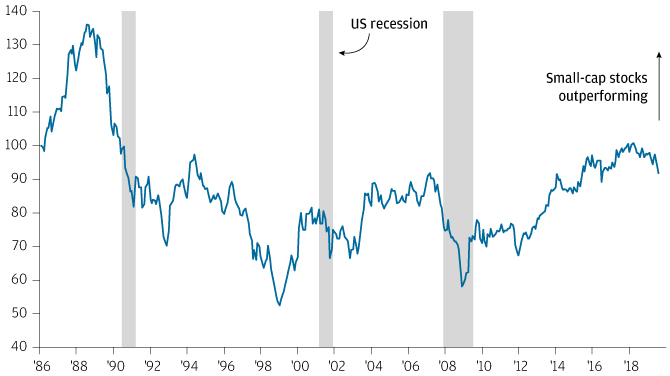
Source: FTSE, Thomson Reuters Datastream, J.P. Morgan Asset Management. Periods of “recession” are defined using US National Bureau of Economic Research (NBER) business cycle dates. Past performance is not a reliable indicator of current and future results. Data as of 31 July 2019
4. Reconsider overweights in growth stocks, add to quality and value stocks
Growth stocks have often underperformed value stocks during S&P 500 bear markets. The obvious exception was the global financial crisis, when value underperformed, although this was because of the high weighting of financials in the value index during a crisis in the US financial system. With banks much better capitalised now than they were prior to the last downturn, the next recession is more likely to be a “normal” recession and less likely to turn into a financial crisis. Value stocks have tended to strongly outperform growth when the period preceding the downturn saw a significant rise in the relative performance of growth stocks, such as during the dot-com bubble.
Growth often underperforms during market downturns
MSCI WORLD GROWTH/VALUE RELATIVE PERFORMANCE AND S&P 500 DOWNTURNS
RELATIVE INDEX LEVEL, REBASED TO 100 IN 1975
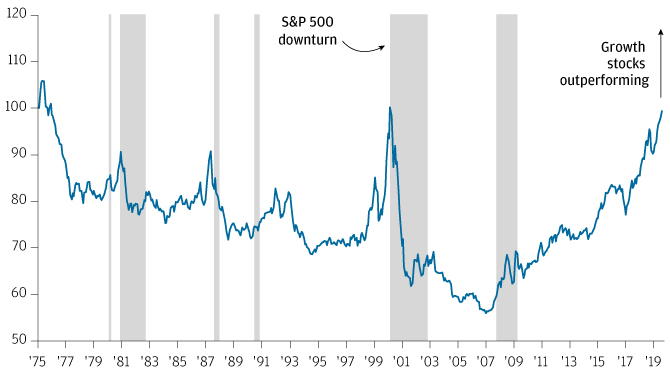
Source: MSCI, Thomson Reuters Datastream, J.P. Morgan Asset Management. Index levels are calculated using price indices in local currency. Past performance is not a reliable indicator of current and future results. Data as of 31 July 2019.
As the name suggests, one would expect value stocks to be cheaper than growth stocks but the valuation difference is now the most extended since 2004.
Growth is more expensive than usual
MSCI WORLD GROWTH AND VALUE PRICE-TO-EARNINGS (P/E) GAP
MSCI WORLD GROWTH MINUS VALUE TRAILING 12-MONTH P/E
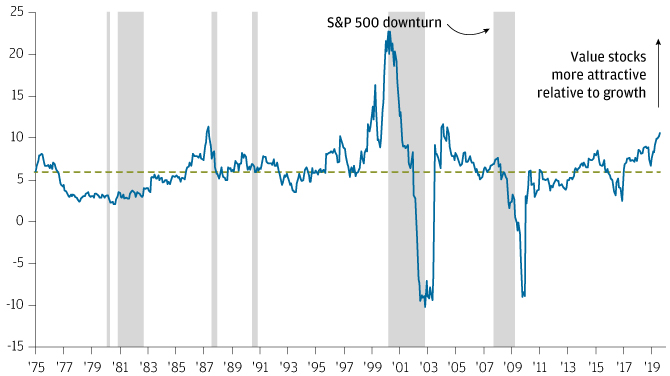
Source: MSCI, Thomson Reuters Datastream, J.P. Morgan Asset Management. Past performance is not a reliable indicator of current and future results. Data as of 31 July 2019.
Reconsider overweights in growth stocks, add to quality and value stocks (CONTINUED)
Quality stocks (defined here as those with high profitability and earnings quality and low financial risk, with a focus on strong cash flow generation) are the only investment style that have outperformed the index in every recent downturn.
Quality stocks have reliably outperformed during recessions
S&P 500 QUALITY/S&P 500 RELATIVE PERFORMANCE
RELATIVE TOTAL RETURN INDEX LEVEL, REBASED TO 100 IN 1990
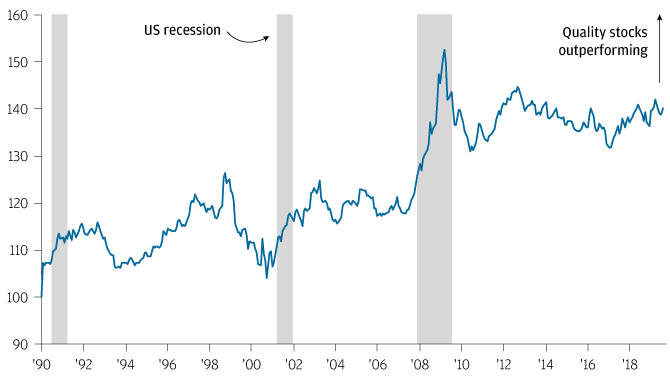
Source: J.P. Morgan Asset Management Quantitative Beta Strategies, Standard and Poor’s, J.P. Morgan Asset Management. S&P 500 Quality index is the top quartile quality stocks in the S&P 500 determined by JPMAM Quantitative Beta Strategies based on measures of profitability, financial risk and earnings quality. Periods of “recession” are defined using US National Bureau of Economic Research (NBER) business cycle dates. Past performance is not a reliable indicator of current and future results. Data as of 31 July 2019.
5. Consider fixed income strategies that can shift across regions, duration and risk
With interest rates still at very low levels in many economies, an ability to shift across regions is critical to take advantage of government bond markets where there is scope for central banks to cut rates and to avoid those markets where the sustainability of government debt could come into question during a downturn. Credit sometimes starts to underperform government bonds before equities peak. Strategies that seek to dynamically reduce credit risk and increase duration as recession risk rises can help to buffer portfolios.
Treasuries can help protect portfolios during equity downturns, while credit underperforms
US TREASURIES TOTAL RETURN VS. US IG/US TREASURIES AND US HY/US TREASURIES RELATIVE PERFORMANCE
TOTAL RETURN INDEX LEVEL (LHS); RELATIVE TOTAL RETURN INDEX LEVEL (RHS); ALL INDICES REBASED TO 100 IN 1997
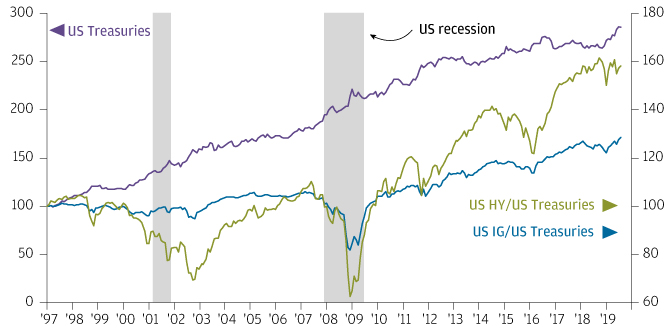
Source: Bank of America Merrill Lynch, Bloomberg, Thomson Reuters Datastream, J.P. Morgan Asset Management. Indices used are as follows: US IG: Bloomberg Barclays US Agg. Corporate – Investment Grade; US Treasuries: Bloomberg Barclays US Agg. Gov. – Treasury; US HY: BofA/Merrill Lynch US High Yield Constrained. Periods of “recession” are defined using US National Bureau of Economic Research (NBER) business cycle dates. Past performance is not a reliable indicator of current and future results. Data as of 31 August 2018.
6. Cash and short-dated liquidity instruments may provide ballast
Holding cash in recent years when real rates were negative didn’t make much sense. But as a tactical allocation, cash or liquidity instruments can add ballast to a portfolio and help investors feel comfortable maintaining some allocation to risk elsewhere in their portfolios. In the US, real yields have improved. The curve has also flattened so investors who are concerned about duration risk can get about as much yield on short-term liquidity instruments as on a 10-year Treasury. Obviously, investors would also need to consider currency risk if investing outside of their home currency.
Higher yields are now available on US short-dated liquidity instruments
US 10-YEAR TREASURY MINUS 3-MONTH T-BILL YIELD VS. REAL 3-MONTH T-BILL YIELD %
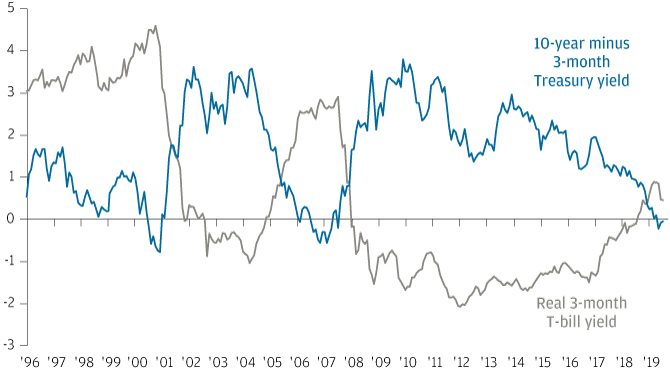
Source: Bloomberg, BLS, J.P. Morgan Asset Management. Real 3-month T-bill yield is calculated as the yield on the 3-month T-bill minus the year-on-year change in the core Personal Consumption Expenditure (PCE) index. Past performance is not a reliable indicator of current and future results. Data as of 31 August 2018.
7. Consider strategies with low correlation to risk assets
Strategies with the ability to lower their correlation to risk assets can help buffer portfolios in a downturn. Some examples include macro funds and equity long-short funds, particularly those with the ability to take their net equity exposure to zero. Investors should be aware, though, that some equity long-short funds have a structural positive, albeit lower, beta to equity markets.
Strategies with low correlation to risk assets can buffer portfolios during downturns
S&P 500 AND MACRO FUNDS TOTAL RETURNS
Total return index level, rebased to 100 in 1999 Total return index level, rebased to 100 in 2006
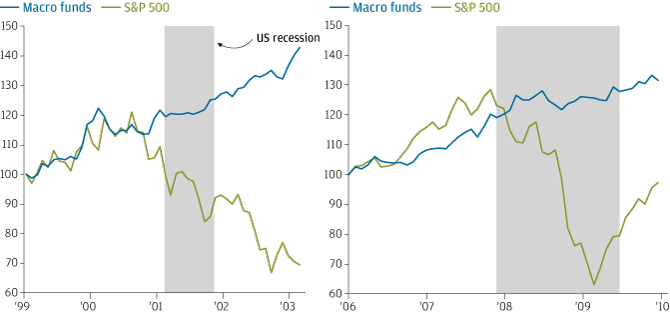
Source: Bloomberg, Standard and Poor’s, J.P. Morgan Asset Management. Macro funds index used is the Hedge Fund Research Macro Index; Periods of “recession” are defined using US National Bureau of Economic Research (NBER) business cycle dates. Past performance is not a reliable indicator of current and future results. Data as of 31 July 2019.
LV–JPM52296 | 08/19 | 0903c02a8238fdf3