
Policy Perspectives
This hub explores proposed policies, economic implications and investment implications. It should be noted that this is all highly speculative and merely a broad baseline for some of the policy changes that may be implemented. Any presidential candidate is likely to promise exhaustive and expansive policies on the campaign trail but is then constrained by the realities of the legislative process. The Trump Administration enjoys majorities in both chambers of Congress; however, these majorities are admittedly slim and many competing interests and priorities exist within the party.
-
Fiscal Policy
-
Taxes
-
Tariffs and Trade
-
Deregulation
-
Immigration
-
Energy
-
Investing through the policy fog
Policy proposal
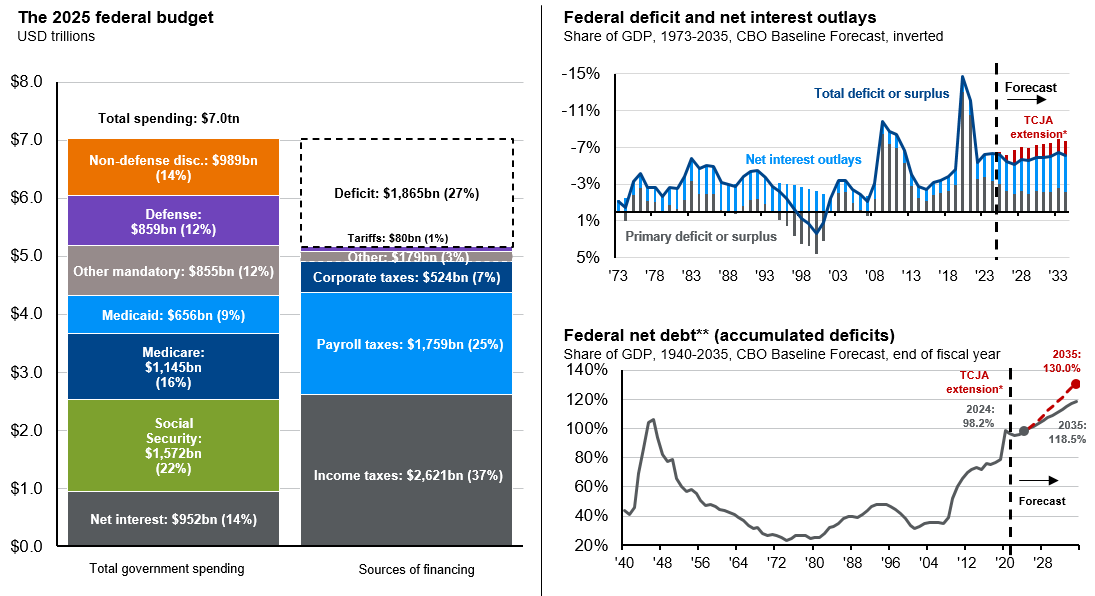
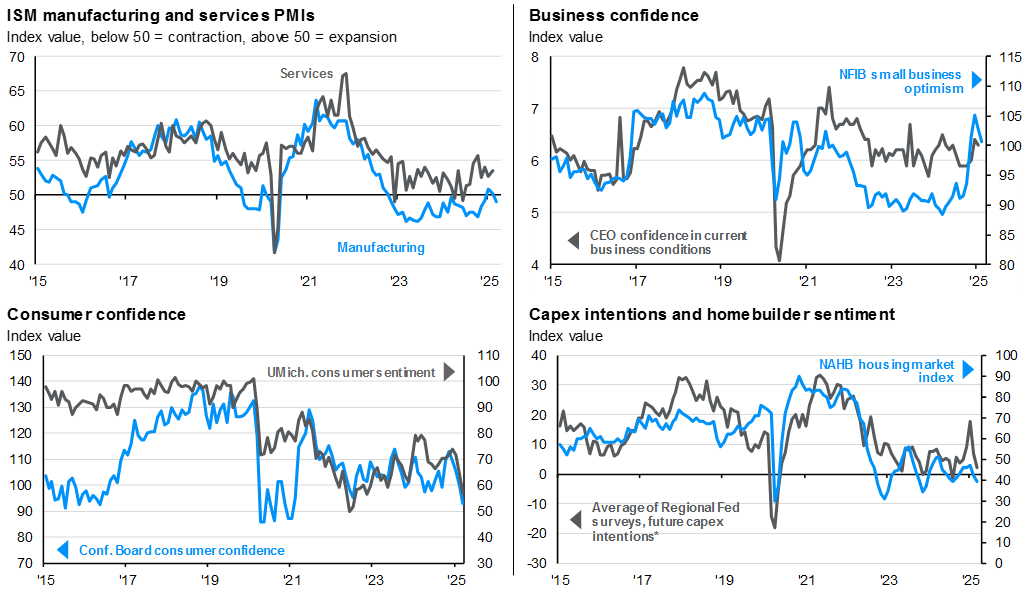
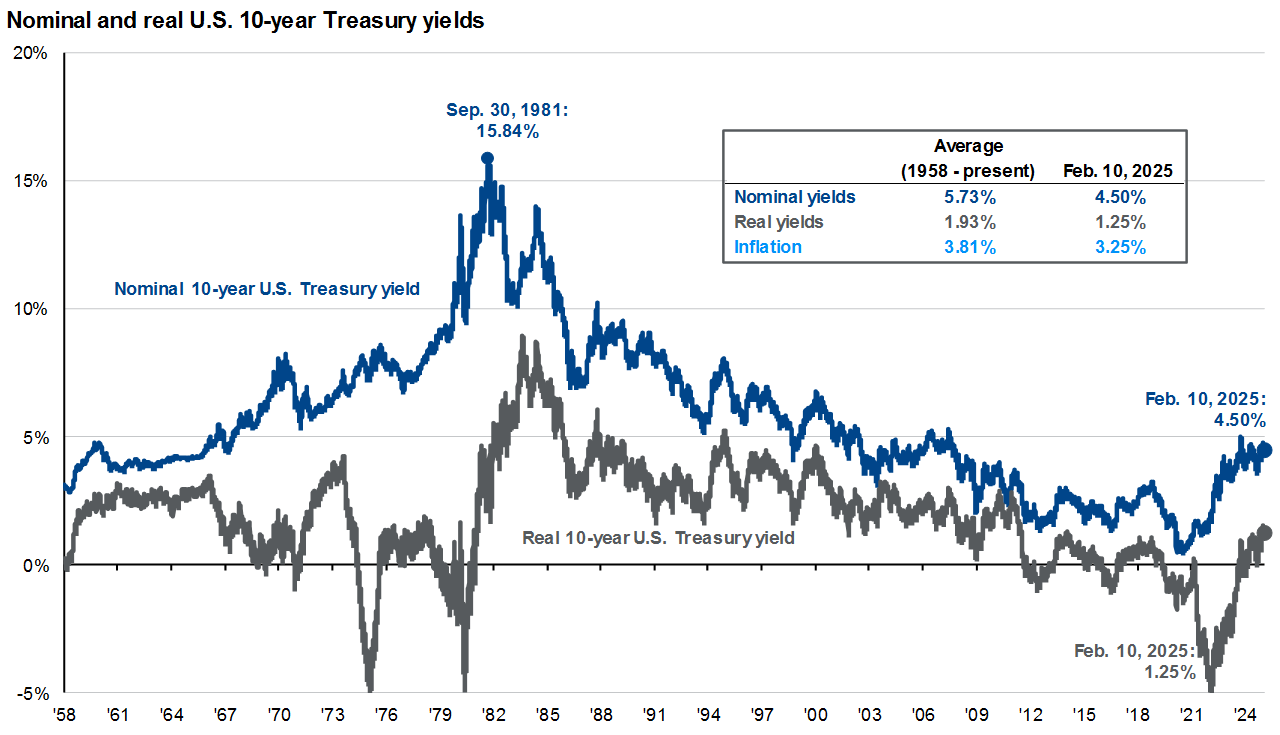
The rise in bond yields throughout 4Q24 and into 2025 likely reflects some degree of concern about the unbalanced state of U.S. federal finances. The deficit as a share of gross domestic product (GDP) sits at 6.4%, nearly double the 50-year average. Debt to GDP has climbed to nearly 100%. The only avenues to improve federal finances are to cut spending or to raise more revenue.
To that end, the Administration has informally established the Department of Government Efficiency (DOGE) “to dismantle government bureaucracy, slash excess regulations, cut wasteful spending and restructure federal agencies.” DOGE’s original goal was to cut USD 2 trillion in spending immediately, although that has since been curtailed to USD 1 trillion. However, looking underneath the USD 7 trillion budget for 2025, there are fewer areas to trim than one might expect. Net interest payments must be made. Although social spending programs like Social Security, Medicare and Medicaid were highlighted as areas in need of reform, dramatic cuts would be deeply unpopular. Removing mandatory spending leaves about 25% of the budget, half of which includes defense spending. Finding efficiencies could be challenging in such a short time frame, although feasible over a longer period.
The other option is to raise more revenue. Tariffs have been floated as one mechanism to do so. However, tariffs only account for USD 76 billion in revenue currently, and while prior to the 1930s that was not the case, they would have to be raised exponentially to become a significant revenue source. Income taxes are the largest source of revenue, but the extension of the Tax Cuts and Jobs Act will only diminish that.
All told, the Committee for a Responsible Federal Budget projects that the extension of the Tax Cuts and Jobs Act could add USD 5 trillion to the deficit, additional proposed tax cuts could add USD 4 trillion, but tariffs could offset those increases by USD 2.7 trillion over the next decade. This could result in a USD 7 trillion increase to the deficit over the next ten years.
Economic implications
- Excessive deficits and debt could slow economic growth and push up inflation.
Investment implications
- Treasury yields could rise further as investors demand more compensation for holding U.S. government debt, which could be perceived to carry more risk given the state of federal finances.
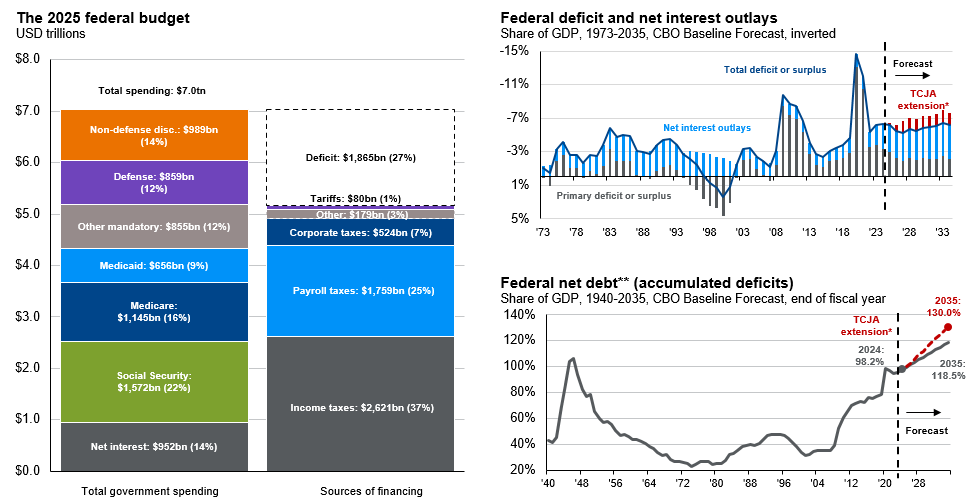
Source: CBO, J.P. Morgan Asset Management; (Left) Numbers may not sum to 100% due to rounding; (Top and bottom right) BEA, Treasury Department. Estimates are from the Congressional Budget Office (CBO) January 2025 An Update to the Budget Outlook: 2025 to 2035. “Other” spending includes, but is not limited to, health insurance subsidies, income security and federal civilian and military retirement. Years shown are fiscal years. All CBO estimates are adjusted by JPMAM to reflect GDP revisions resulting from the 2024 annual update of the National Economic Accounts. *Adjusted by JPMAM to include estimates from the CBO May 2024 report “Budgetary Outcomes Under Alternative Assumptions About Spending and Revenues” on the extension of TCJA provisions. Forecasts are not a reliable indicator of future performance. Forecasts, projections and other forward-looking statements are based upon current beliefs and expectations. They are for illustrative purposes only and serve as an indication of what may occur. Given the inherent uncertainties and risks associated with forecasts, projections or other forward-looking statements, actual events, results or performance may differ materially from those reflected or contemplated.**Net debt refers to debt held by the public, which excludes intragovernmental holdings (such as securities held by government trust funds, like the Social Security Trust Fund). Gross federal debt is the sum of debt held by the public and intragovernmental debt.
Guide to the Markets – Asia. Data reflect most recently available as of 31/03/25.
All figures are in U.S. dollars.
Policy proposal
The Administration has suggested it would like to pass an omnibus budget reconciliation bill, which is the one budgetary vehicle with immunity from Senate filibusters, in the spring. Given slim majorities in Congress, this is the most likely path for tax reform. We anticipate consideration of significant tax cuts, which could include:
- Full extension of the 2017 Tax Cuts and Jobs Act (TCJA) cuts that were set to expire at the end of 2025.
- Corporate tax cut from 21% to 15% for domestic production, and a restoration of full expensing of R&D and equipment purchases for domestic producers.
- Change in the USD 10,000 cap on State and Local Tax (SALT) deductions.
- Exemptions from income tax for all social security, tips and overtime income.
Of these proposals, a full extension of the TCJA, with a few changes seems most likely. However, the chance of passage of many of these individual proposals may be reduced by objections to the cost of the total legislative package. Congress will very likely attempt to reduce the costs of these proposals by, for example, raising rather than eliminating the cap on SALT deductions, pushing for new policies like limiting SALT for corporations and eliminating many tax credits created by the Inflation Reduction Act.
Economic implications
- Growth: Real GDP would be largely unaffected in 2025, but powerful fiscal stimulus from tax cuts kicking in at the start of 2026 could boost year-over-year real GDP growth to 2.8% by the end of 2026.
Investment implications
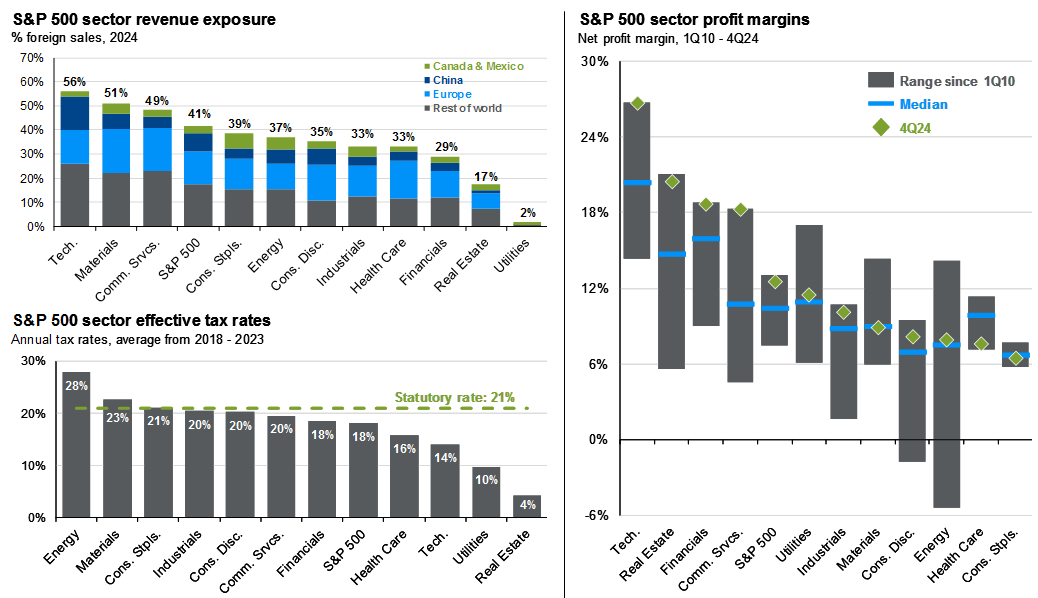
- A corporate tax cut for domestic producers could mimic the now defunct Section 199 domestic production activities deduction, in which manufacturing and information technology benefitted the most. Finance, health care, education and other services received little benefit.
- Corporate profits of domestic producers could experience a tailwind to margins. 145 companies in the S&P 500 (representing 18% of market cap and 23% of earnings) have effective tax rates greater than 15% and greater than 80% of revenues derived domestically. Stripping out the 51 companies in traditionally service sectors, roughly under one-fifth of the S&P 500 could benefit. More mid and small cap companies, which tend to be more domestically oriented, may qualify for this tax cut.
# of S&P 500 companies with effective tax rates >15% that generate >80% of revenues domestically

Source: Standard & Poor's, J.P. Morgan Asset Management. Based on data available for 456 of 503 companies in the S&P 500. Data are as of November 13, 2024.
All figures are in U.S. dollars.
Policy proposal
Tariffs in effect:
- 10% universal tariff on all imports
- 145% on China
- 25% on imports from Canada and Mexico (non-USMCA-compliant goods), 10% on non-USMCA potash, Canadian energy
- 25% on steel and aluminum
- 25% on autos (April 3) and auto parts (effective May 3)
- Elimination of the de minimis exemption1
Potential tariffs:
- Copper, pharmaceuticals, semiconductors, lumber, bullion, critical minerals, energy
Tariffs announced on April 2nd and paused for 90 days:
Higher tariffs on most markets, including:
- 32% on Taiwan
- 26% on India
- 25% on South Korea
- 24% on Japan
- 20% on the European Union
- 10% on the UK
Goals of the tariffs include:
- Lowering trade deficit
- Raising government revenue
- Encouraging foreign investment in the U.S. and job creation
- Combatting perceived unfair practices
- Addressing domestic concerns with trading partners: drug trafficking, immigration, auto imports, defense
Economic implications
- The short-term economic impacts of tariffs tend to be stagflationary. Some of the one-time increase in tariffs may affect U.S. businesses’ bottom line, while some costs may be passed on to the end-consumers, leading to higher prices. Key business decisions, such as investment and hiring, may be postponed or reconsidered, and consumers may reduce their larger purchases. The first quarter growth was already looking soft, and further softening in the second quarter will depend on the duration of the tariffs.
- Previously, recession risk had increased due to policy uncertainty and may increase further depending on the duration of these tariffs.
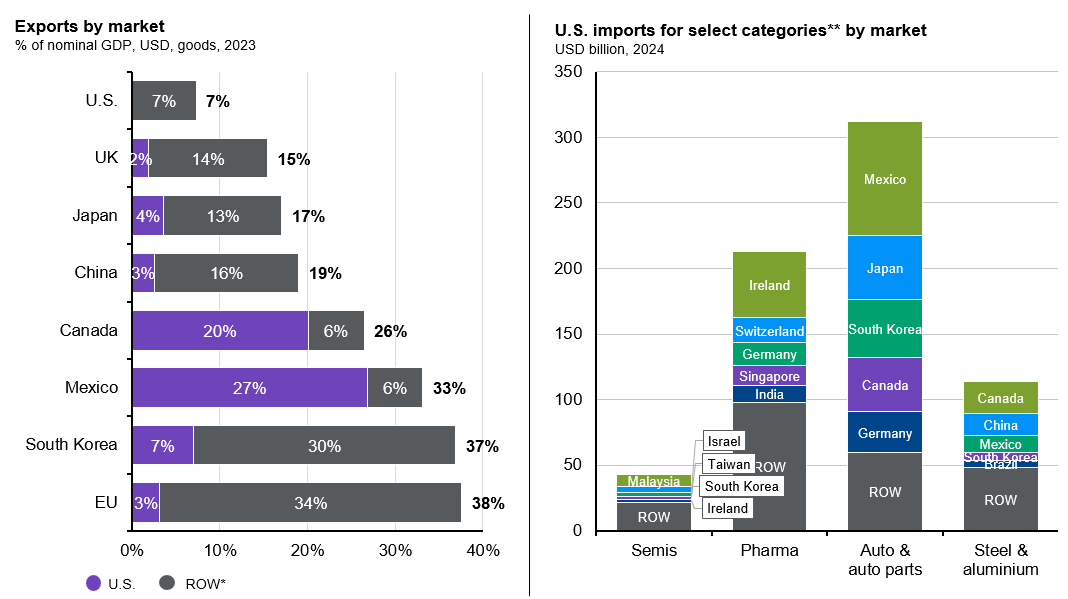
Investment implications
- The impact on global companies and economies will depend on their policy responses and whether they are more externally or domestically focused. Large multinationals may face headwinds, especially in sectors with a significant share of foreign revenue, such as technology and materials. In contrast, small caps, which tend to be more domestically oriented, should benefit on a relative basis.
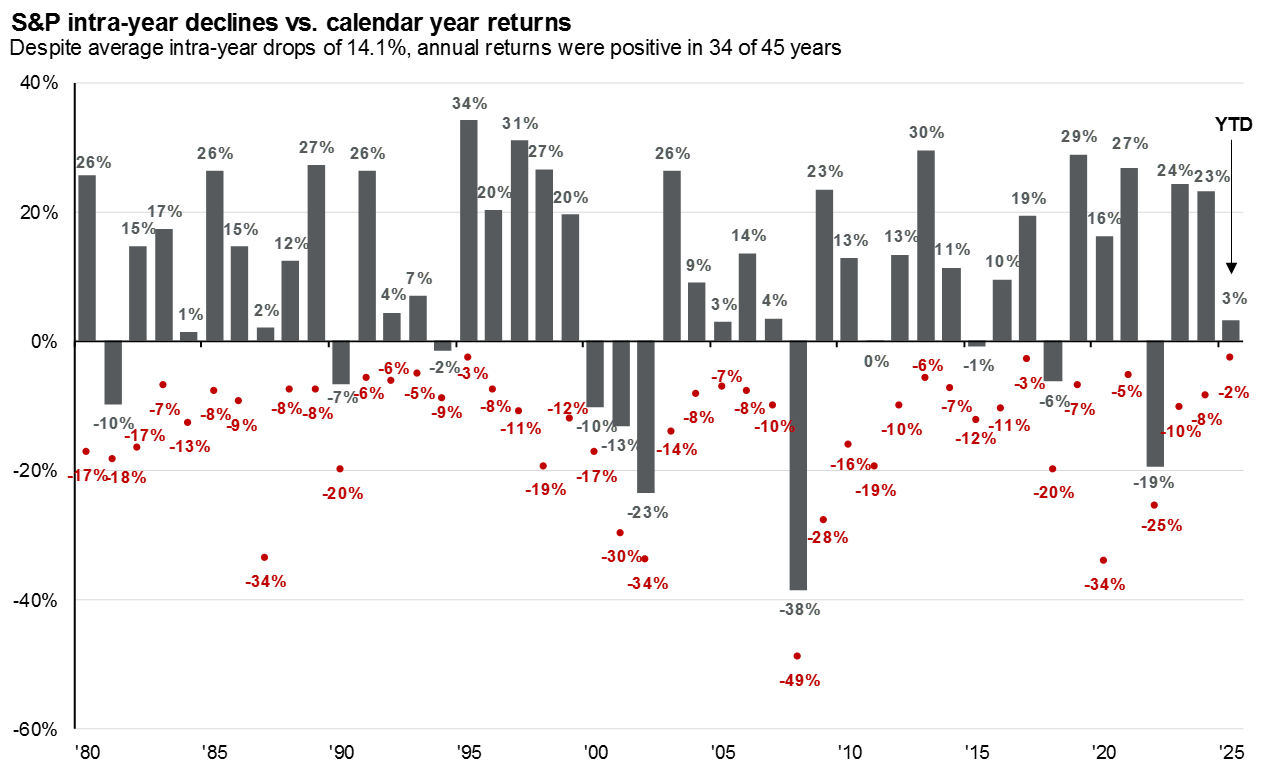
- Uncertainty has contributed to market volatility, with the markets already experiencing a 10% correction. In 2018, trade tensions weighed on equity multiples despite solid earnings across most major global equity markets, resulting in negative returns.
- “Safe haven” currencies like the Japanese Yen, Swiss Franc, and even the Euro may strengthen further, while some emerging markets in Asia, such as China, may consider devaluing their currencies. Initial expectations were for a stronger U.S. dollar, however the dollar has weakened since Inauguration Day.
Average tariff rate on U.S. goods imports for consumption*
Duties collected / value of total goods imports for consumption
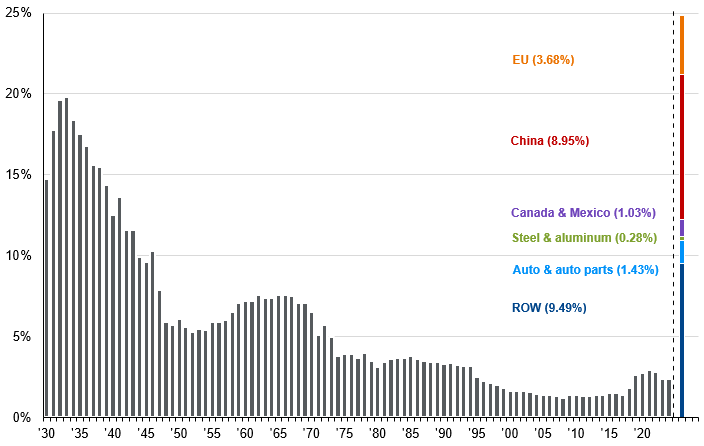
Source: Goldman Sachs Investment Research, Tax Foundation, U.S. Department of Commerce, United States International Trade Commission, J.P. Morgan Asset Management. *Imports for consumption: goods brought into an economy for direct use or sale in the domestic market. This does not include goods admitted into bonded warehouses or foreign trade zones. The data above incorporates all current official revisions for 2010-2020 as of July 2021. Estimates about which goods are USMCA compliant come from Goldman Sachs Investment Research. Figures are based on 2024 import levels and assume no change in demand due to tariff increases. Forecasts are based on current data and assumptions about future economic conditions. Actual results may differ materially due to changes in economic, market and other conditions.
Guide to the Markets – Asia. Data reflect most recently available as of April 02, 2025.
1A threshold below which goods imported into a market are exempt from customs duties and taxes.
Policy proposal
The Biden administration passed nearly 80% more financially significant rules (estimated to have USD 100 million or more impact to the economy; threshold raised to USD 200 million in 2023) throughout its term than the Trump administration did during its first term, according to George Washington University. The Trump administration is likely to attempt meaningful deregulation this time around.
The first step may be to impose a regulatory freeze, as many incoming presidents do, to assess the impact of regulations underway to determine whether to proceed with them depending on if they fit into his policy agenda. U.S. President Trump is also likely to reinstate the regulatory budget framework to promote annual cost savings, and more stringent cost-benefit analysis for regulations going forward. During his first term, the President directed agencies to eliminate two rules for each new one created. He has proposed to increase that to eliminate 10 rules for each new one.
From there, key targets of potential deregulation include:
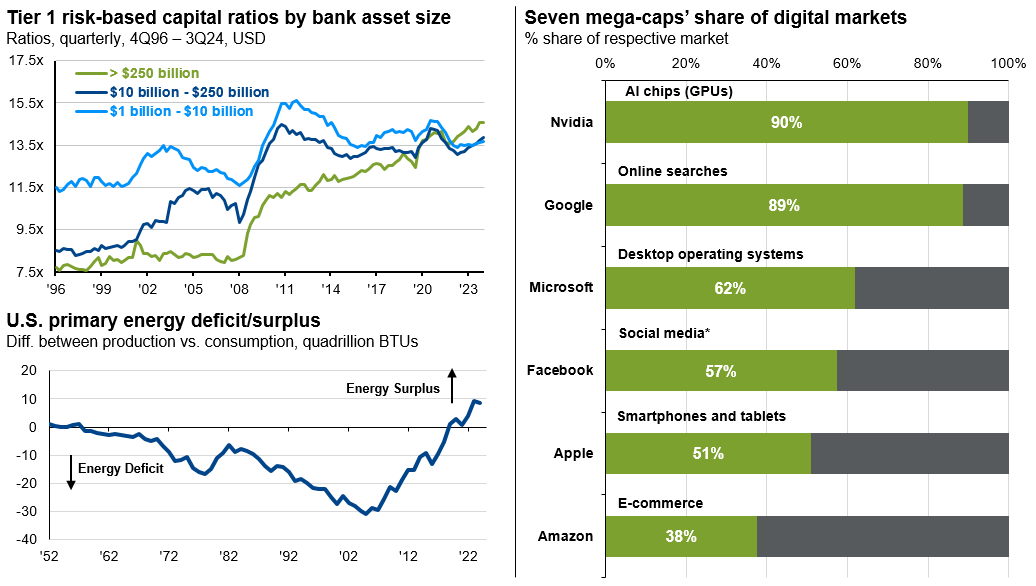
- Finance: Post-financial crisis era regulations, Basel III and crypto assets could face some deregulation.
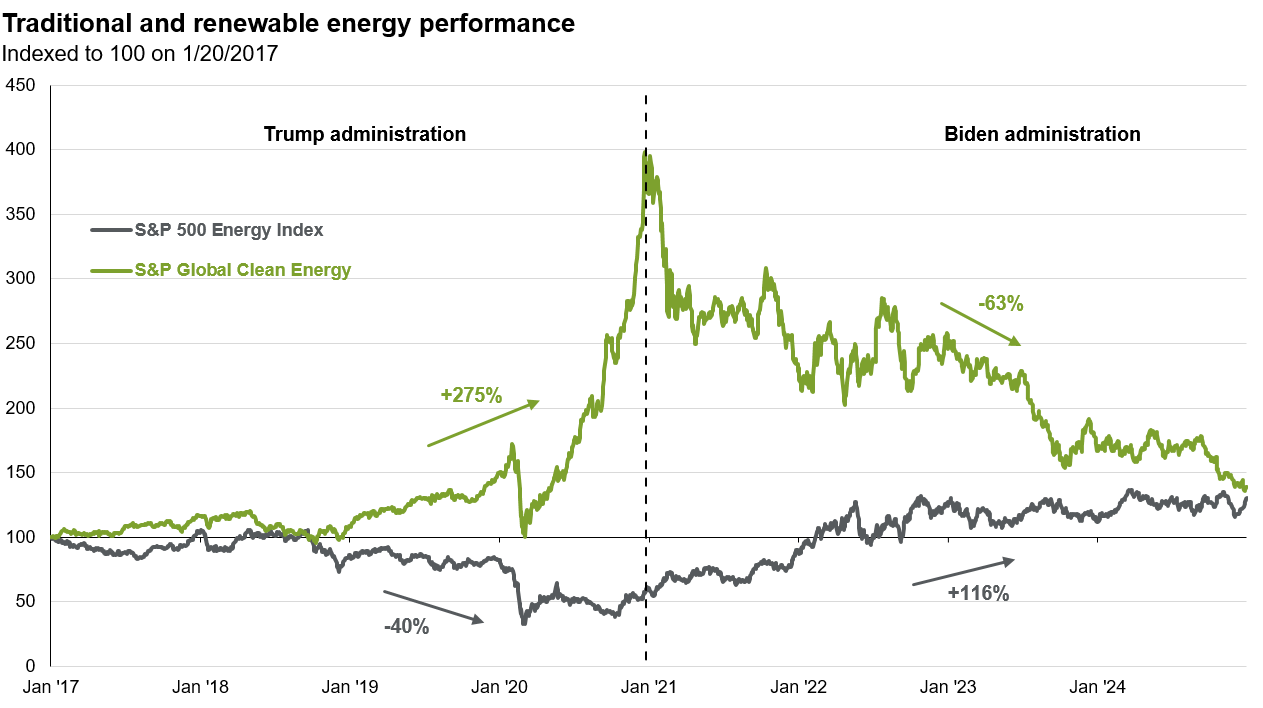
- Energy: The administration will likely remove restrictions on leases and permitting for oil and gas drilling. It has also proposed to rescind unspent funds from the Inflation Reduction Act, remove subsidies on renewables and electric vehicles, and roll back environmental protections.
- Health care: A long-standing goal of the President was the repeal of the Affordable Care Act.
- Technology: Technology may continue to come under intense scrutiny, but focus may shift towards issues like free speech and competitiveness rather than wholesale breakups of tech companies. Influential tech leaders may emphasize an open environment for artificial intelligence (AI) development that enables the U.S. to maintain its competitive edge. The Administration could expand the semiconductor export restrictions introduced during the Biden administration and increase incentives for domestic chip manufacturing.
The realities of deregulation, however, may be more sobering. It is easier not to add new regulation than to eliminate it. Not only does proposed deregulation need to go through a formal review process but it is also subject to judicial review, which has a mixed success rate.
Economic implications
- Productivity: Deregulation should boost productivity and support growth; however, any such gains are very hard to estimate.
- There could be long-term impacts to environmental and climate sustainability, as well as consumer protections.
Investment implications
- Mega cap technology companies may continue to face anti-trust litigation, although the strategic importance of many of these businesses may also protect them and limit the scope of legal action, somewhat diminishing the regulatory headwind.
- Financials stand to benefit from a rollback of post-financial crisis era regulations and Basel III.
- Energy could also benefit, although with oil production already at high capacity, this may not result in a meaningful increase in oil supply in the short run. On the other hand, renewables and electric vehicles (EV) subsidies enacted in the Inflation Reduction Act could be at risk.
- Thus far, markets have not rewarded health care for any prospects of regulatory regime change, and the Administration’s cabinet appointee has not been well-received by the markets at this stage.
- Crypto guardrails could diminish through less U.S. Securities and Exchange Commission (SEC) enforcement and a relaxed regulatory framework for digital assets.
- Streamlined regulation and greater clarity could revive Initial Public Offerings (IPO) and Mergers & Acquisitions (M&A), creating much needed exit activity in private equity, and supporting lending and financing activity in private credit.
Economically significant rules published by administration in first year
Cumulative number of rules

Source: George Washington University's Regulatory Studies Center, Office of the Federal Register for Biden administration, Office of Information and Regulatory Affairs for all prior administrations, J.P. Morgan Asset Management. Data are as of September 6, 2024.
All figures are in U.S. dollars.
Policy proposal
Immigration efforts could prioritize increasing border security, deporting undocumented immigrants with criminal convictions and final deportation orders, and slowing or restricting legal avenues to immigrate.
Economic implications
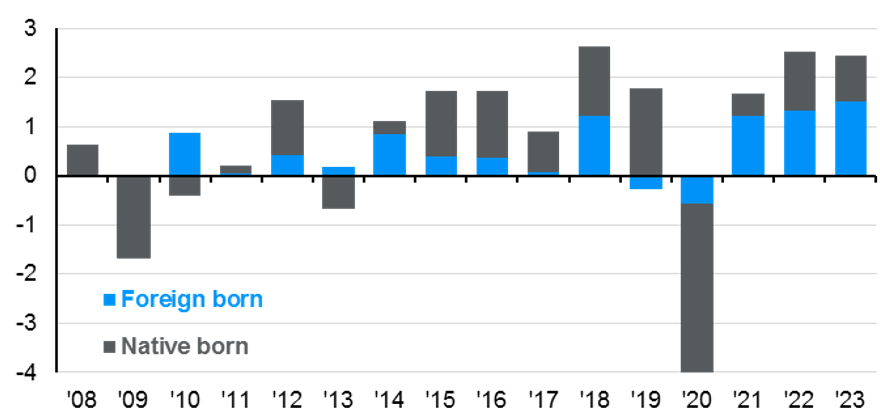
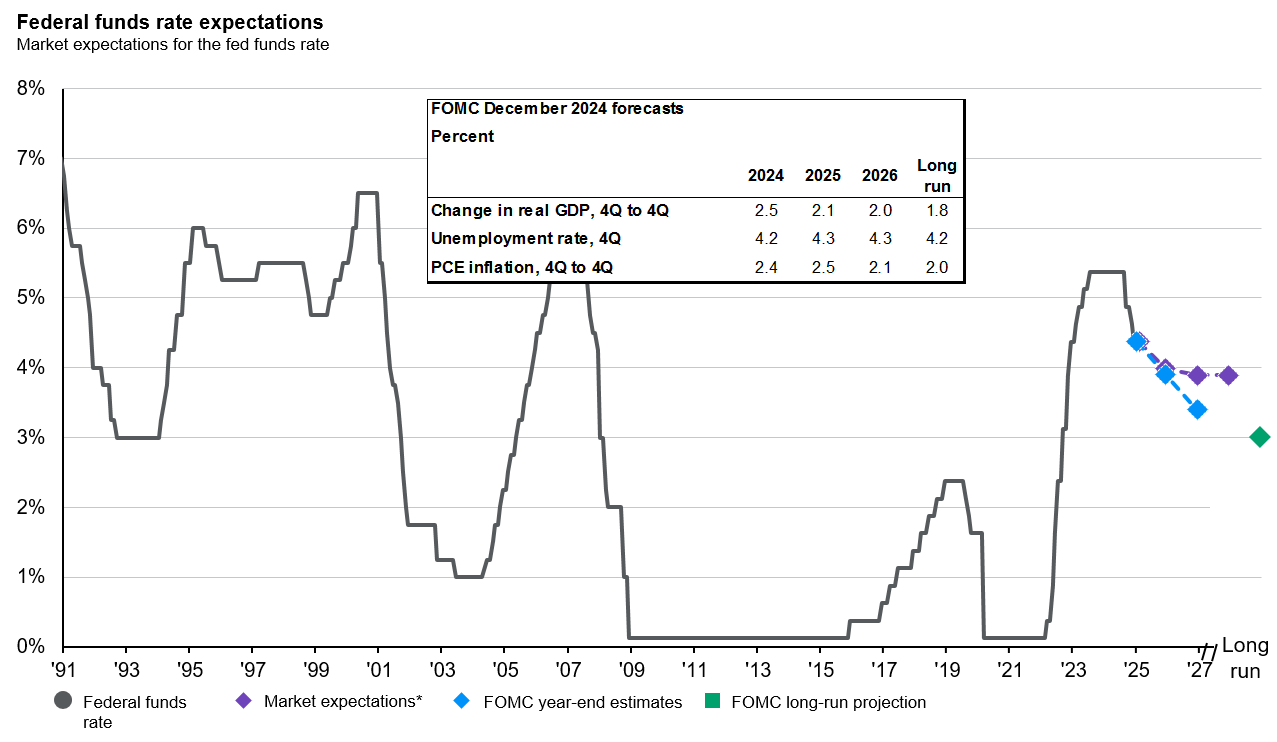
- Jobs: Lower labor force growth due to less immigration could cut the unemployment rate to 3.9% by the end of 2025. Wages could face upward pressure as native born workers’ median wages are higher than foreign born workers.
- Growth: Over time, economic growth could be limited by constrained labor force growth.
Investment implications
- Companies could continue struggle to find enough qualified workers, a longstanding challenge.
- Higher wages could weigh on profit margins.
Labor force growth, native and immigrant contribution
Year-over-year difference, end of year, aged 16+, millions
Median weekly wages
2023 (in U.S. dollars)
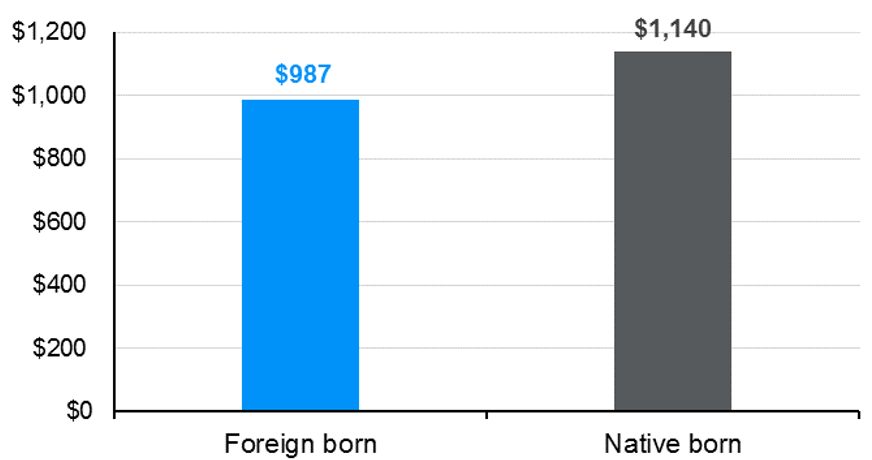
Source: BLS, FactSet, J.P. Morgan Asset Management. Labor force data are sourced from the Current Population Survey, also known as the household survey, conducted by the BLS. This survey does not ask respondents about immigration status and may include undocumented workers, although it likely undercounts the undocumented population. Data are as of March 13, 2025.
All figures are in U.S. dollars.
Policy proposal
U.S. President Trump signed a slew of executive orders to boost U.S. energy production and lower energy prices. His national energy emergency declaration will give the president broad authority to remove environmental restrictions and expedite approvals for energy infrastructure projects. In addition, notable executive orders were aimed at deregulating oil drilling in the Arctic and lifting the hold on new liquefied natural gas (LNG) export permit applications to help alleviate a backlog of new LNG projects, including large ones in Texas and Louisiana that have been on pause while the Biden Administration reviewed their environmental and economic impacts.
During his inaugural address, U.S. President Trump also reiterated his intentions to refill the Strategic Petroleum Reserve (SPR). The Biden Administration released 180 million barrels of crude oil from the SPR to stabilize oil prices during the Russia/Ukraine conflict, bringing the SPR to 40-year lows in June 2023. U.S. President Trump has now pledged to refill the SPR from its current inventory of 395 million barrels to the maximum capacity of 714 million barrels. However, he will first need USD 24 billion in funds authorized from Congress to do this.
Economic implications
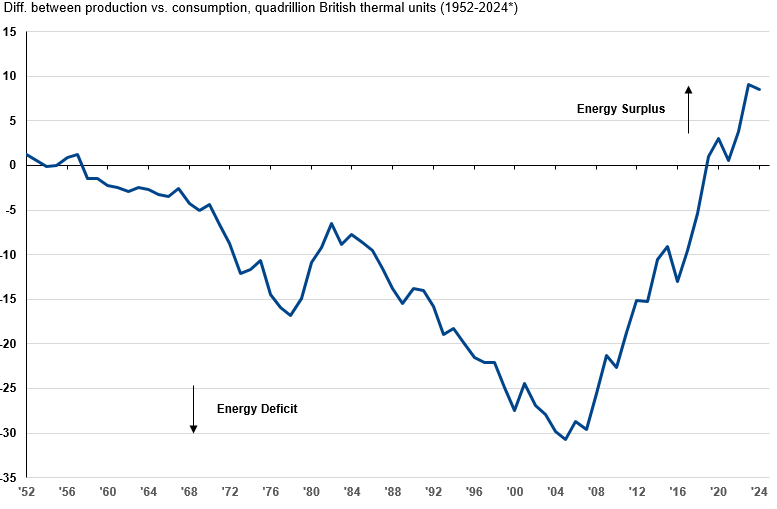
Despite these changes, energy supply may not see a marked increase:
- The U.S. is already the largest producer of crude oil in the world, pumping out roughly 13.4 million barrels per day, per the Energy Information Administration.
- The difference between U.S. primary energy production and consumption have reached the highest levels in history.
- Weather, geography, specialized equipment requirements, and the cost to extract oil in the Arctic has historically been costly and financially unviable for many oil and gas companies.
- The Organization of the Petroleum Exporting Countries Plus (OPEC+) already has planned 2025 and 2026 production increases, and the world’s oil supply is expected to continue increasing in the coming years.
- The U.S. was already expected to significantly increase its world-leading LNG production in 2025 and 2026 from 90 million tonnes per annum to over 140 million tonnes per annum due to previously approved LNG projects to supply Europe and Asia with LNG as the regions continue to cope with supply issues from the ongoing Russia/Ukraine tensions.
Investment implications
- Energy companies may not want to significantly ramp up supply because it could weigh on oil prices and reduce profitability. U.S. oil exploration and production firms need oil prices above USD 64 on average to profitably drill a new well, leaving little room for current prices to decline.
U.S. primary energy production and consumption deficit/surplus
All figures are in U.S. dollars.
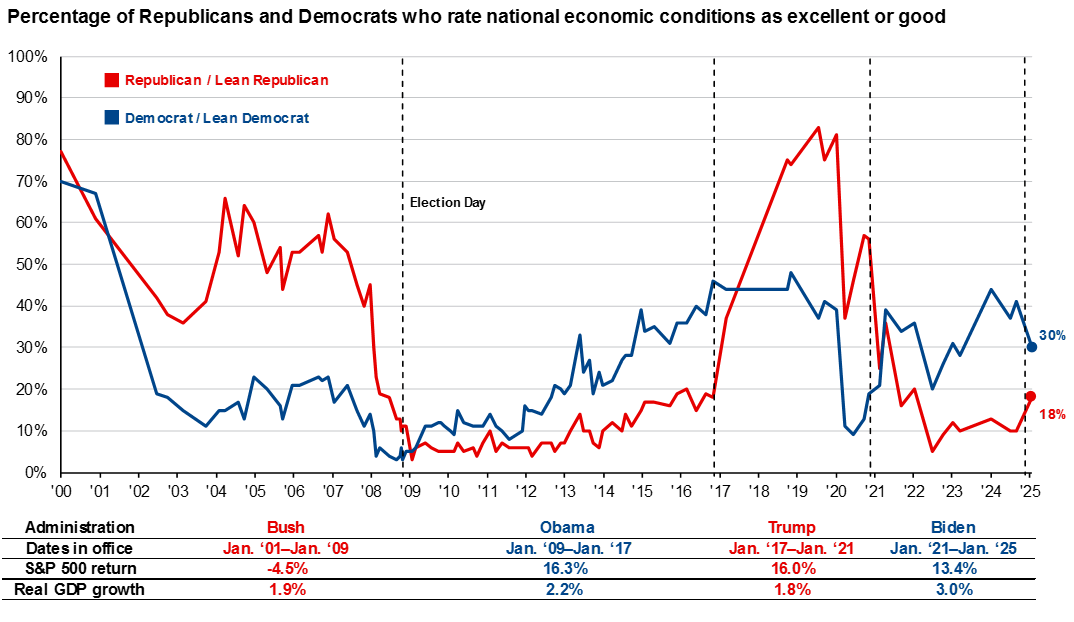
Political opinions are best expressed at the polls, not in a portfolio. One cardinal rule investors ought to follow: Don’t let how you feel about politics overrule how you think about investing.
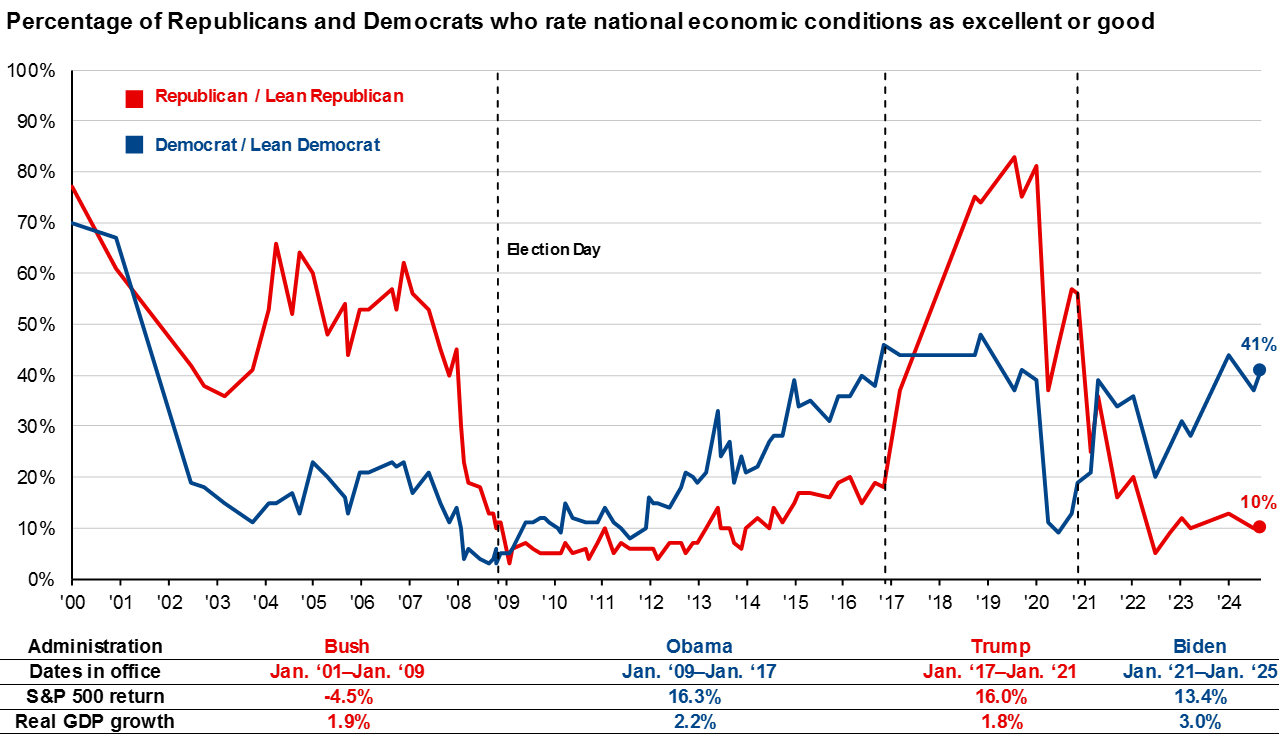
The chart below shows a survey from the Pew Research Center asking Americans how they feel about economic conditions. The results show that Republicans often feel better about the economy under a Republican president, while similarly Democrats often feel better about the economy under a Democratic president. Investors often make portfolio decisions based on their economic outlook.
Yet, average annual returns on the S&P 500 during the Obama administration of 16.3% and during the Trump administration of 16.0% were almost identical and higher than the average return over the last 30 years of 10.4%. It is likely the macro conditions, like ultra-low interest rates enjoyed during both Obama and Trump administrations, were a more influential driver of above-average returns during those periods, rather than the policy prescriptions each president espoused.
Consumer confidence by political affiliation
Percentage of Republicans and Democrats who rate national economic conditions as excellent or good
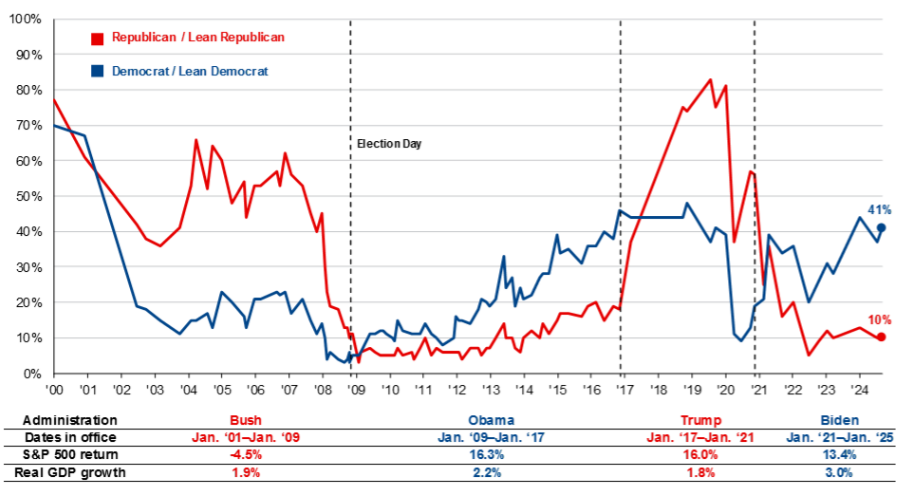
Source: Pew Research Center, J.P. Morgan Asset Management. The survey was last conducted in September 2024. Pew Research Center asks the question: “Thinking about the nation’s economy, How would you rate economic conditions in this country today… as excellent, good, only fair, or poor?” S&P 500 returns are average annualized total returns between presidential inauguration dates and are updated monthly.
Data are as of March 13, 2025.
Key Policy Slides
Deep dive: Tariffs and Trade
Latest Insights
The information presented is not intended to be making value judgments on the preferred outcome of any government decision or political election.