
Week in review
- U.S. JOLTS job openings reduced to 6.87 mil in Mar
- RBA raised policy rate by 25bps to 4.35%
- Korea inflation rose to 2.6% y/y in Apr
Week ahead
- China Apr inflation rate and total social financing
- U.S. Apr inflation rates
- Japan Apr Eco Watchers survey
Thought of the week
With roughly half of the Asian equity market having reported 1Q26 results, earnings are on track for an outsized 40% y/y growth, marking one of the strongest quarters in recent years. This strength is led by the technology sector, as robust global AI demand continues to outpace industry supply capacity—particularly benefiting Asian semiconductor names, which mostly hold monopolistic positions across the AI hardware value chain. Although recent geopolitics-driven energy shocks have raised questions about the sustainability of this performance, most companies have noted previously deployed risk mitigation strategies, from diversifying suppliers to building safety-stock inventory on input materials, as well as actively negotiating with local authorities to secure energy supply stability. Unless the ongoing energy disruption becomes a permanent issue, technology should remain a dominant theme in Asian markets, with demand strength gradually feeding further upstream toward equipment and material names.
MSCI AC Asia Pacific earnings growth
Year-over-year
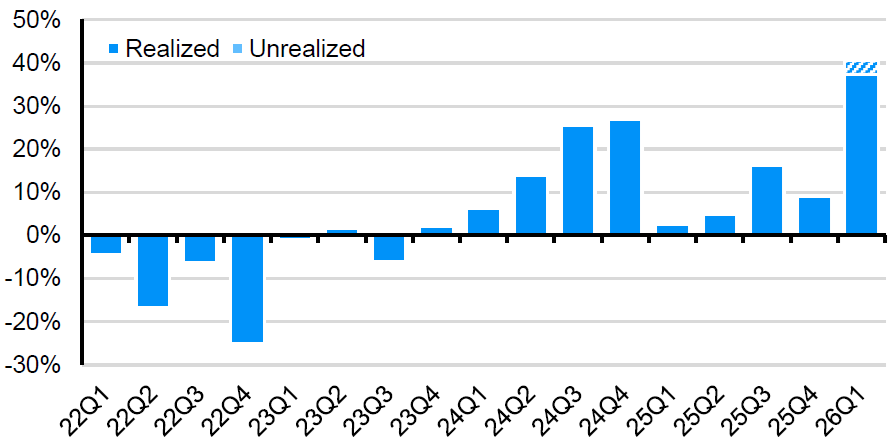
Source: FactSet, MSCI, J.P. Morgan Asset Management. Data reflect most recently available as of 08/05/2026.
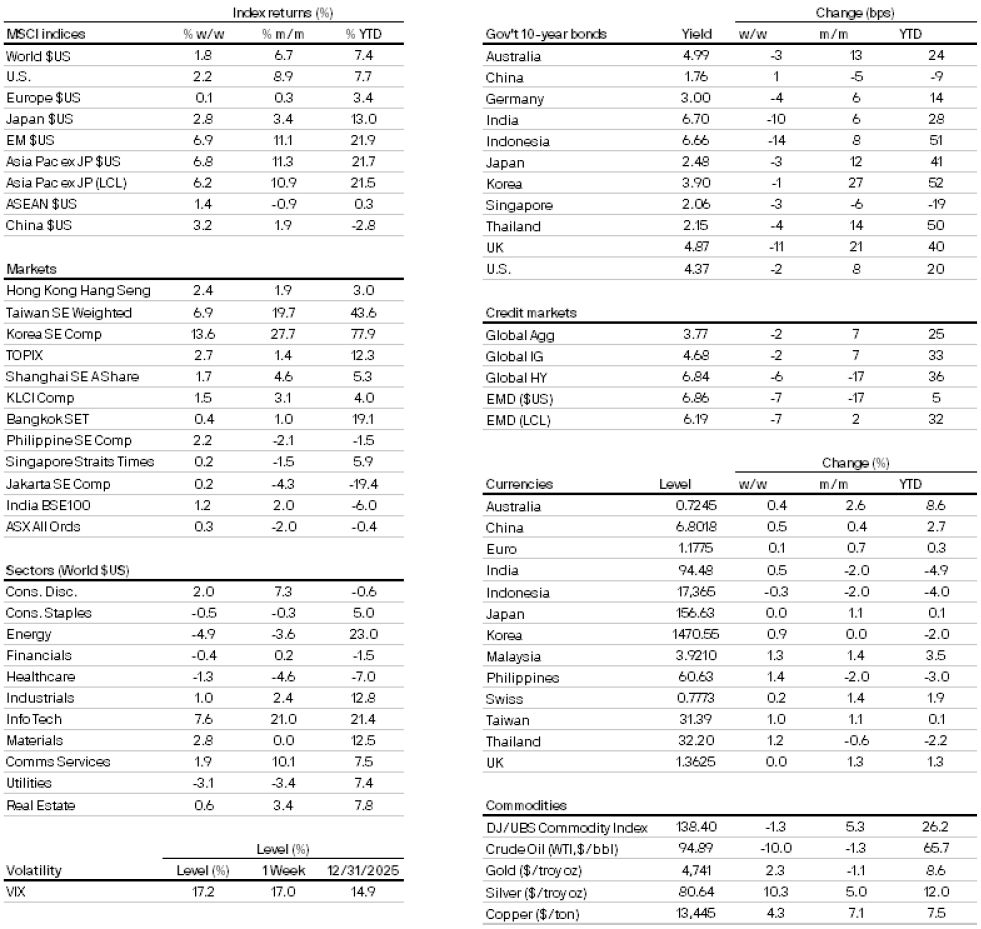
Market data
300a4900-f9d9-11e8-839f-fe2ee17e7f12
All returns in local currency unless stated otherwise.
Currencies’ return are based on foreign currencies per U.S. dollar. An appreciation of the foreign currency against the U.S. dollar would be positive and a depreciation of the foreign currency against the U.S. dollar would be negative.