Understanding the opportunity in Chinese equities
What are some key metrics to consider when exploring the optimal portfolio allocation?
Michael Hood
Luke Richdale
In Brief
- China’s increasingly consumer-led economy offers attractive stock investing opportunities in a vast, liquid and now, more accessible market. Chinese equities offer clear diversification benefits, especially for USD-based investors, despite a set of risks we acknowledge.
- Our Long-Term Capital Market Assumptions (LTCMAs) see China’s equities delivering close to double-digit annual investment returns over 10 to 15 years, as the economy approaches becoming the world’s largest, in absolute terms.
- Global and emerging market equity investment managers are not always a reliable source of China exposure; some actually have zero exposure.
- Our modelling shows that allocating to Chinese A shares, mirroring the All Country World Index’s likely future allocation to China, should add to returns without increasing risk.
- Historically, active managers investing in the idiosyncratic onshore Chinese A-share market have added significant value over a passive approach, and we believe this outperformance will continue.
How large is your dedicated allocation to China? If your exposure comes through funds that follow global emerging markets (GEM) or international indices, the answer might be: Not a lot or maybe zero.
China’s share of global equity market indices lags its size and economic importance. The country is likely to overtake the U.S. as the world’s biggest economy in absolute terms over the next 15 years, it is home to some of the world’s largest equity and bond markets, and offers a range of opportunities, along with certain risks. Our view of these opportunities is built on the belief that China will continue to deliver superior nominal economic growth relative to other markets over our 10- to 15-year forecast period, and our LTCMAs project 8.10% returns for the part of the domestic market (onshore stocks) known as A shares (see “How we build our China LTCMAs”). Yet domestic Chinese stocks, or A shares, make up, on average, only 7% of GEM and less than 1% of a benchmark international index.1
Are benchmark weights the right ones for your needs, or is your allocation underweight? Each institution will have its own return targets and risk parameters: There’s no-one-size-fits-all solution. But we think a basic framework for considering a long-term China equity allocation can be helpful. This paper explains one approach. Using our LTCMAs2 to model different allocations to onshore Chinese stocks, we find that adding A shares in place of some ACWI holdings could add to portfolio returns without increasing risk. That’s because the projected diversification benefit, especially for USD-based institutions, offsets the volatility downside.
Over the course of the next decade, China is likely to become a much larger slice of the MSCI Emerging Markets Index as well as of the ACWI, and the domestic equity market will likely become a mainstream allocation for foreign investors. As we will discuss, some institutions may want to consider getting there sooner. We also explore the large alpha opportunity for high and uncorrelated returns where we expect structural, not cyclical, growth. Finally, we note how Mandarin-speaking, active fund managers equipped for on-the-ground challenges may add significant value.3
To be sure, it may seem an inopportune time to even think about, let alone increase, your allocation to China’s equity markets, given the steady drip of negative U.S. news dampening sentiment, the Holding Foreign Companies Accountable Act, the Uyghur Human Rights Policy Act, the revocation of Hong Kong’s special status and the re-escalation of U.S.-China trade tensions, to name but a few. We are cognizant of a possible shift in the geopolitical landscape toward deglobalization should the U.S. and China increasingly go their own ways. Yet the fact remains that China is in the early stages of a financial evolution that will likely offer patient investors a significant opportunity over the next 10 to 15 years. And it is important to remember that periods of uncertainty, like today, can offer opportunities for those willing to look through the news and focus on earnings per share (EPS) growth, which ultimately drives investment returns.
Macroeconomic backdrop: Rising incomes, consumer- and tech-driven opportunities
China is about to reach middle income status,4 after a two-decade run in which GDP per capita rose tenfold. Though growth has slowed from its former double-digit pace, our 2020 LTCMAs project 4.4% growth (or faster if structural reform of state-owned enterprises occurs). We also anticipate broad success for China in moving further up the value chain to capture more growth from services, consumption and technology. This momentum should lead China to transition to a high income economy over our forecast horizon—even as headline economic growth decelerates from historic levels.5
We are optimistic that China, like Korea and Taiwan, can surmount the “middle income trap,"6 though success is not guaranteed. Our base case sees rising, broadening incomes in an enormous country leading the shift to a consumer-led economy, resulting in attractive stock-level opportunities. And these are now more accessible to investors through Stock Connect, which allows foreigners to invest in China7 (although not with an openness equal to that of the Hong Kong stock exchange).
We are not naive about China’s challenges, least of all in the short term, as the pandemic impacts all economies. In addition to the risks mentioned above, domestically, the country’s shrinking prime working-age population is a demographic challenge, yet one that should be offset by ongoing urbanization. Rapid debt accumulation is another risk to productivity growth, as the authorities have acknowledged. The prevalence of large state-owned enterprises could also hinder China’s ascent to high income status, though reforms are planned.8
A vast, liquid market with better return potential and diversification benefits
China’s onshore A-share market currently accounts for about 7% of the total market cap of emerging market (EM) equities, according to MSCI, and that will likely rise in the near term as the country’s efforts to open to international investors gather pace. With over 3,500 listed stocks, the market is large, deep and very liquid: In 2018 and 2019, China’s domestic markets, comprising Shanghai and Shenzhen, were more liquid than all U.S. stock markets combined.9 The average daily trading volume of an onshore stock is roughly USD13 million, vs. USD8.5 million in the rest of the EM universe.
Index providers are gradually recognizing these features by expanding China’s inclusion (China’s “index inclusion factor,” IIF—meaning, the percentage of market cap included). Today China’s IIF is only 20% for MSCI, but it is likely to grow, over time, to 100%.10
The LTCMAs, relied on by our own Multi-Asset Solutions teams investing across asset classes, estimate Chinese equity market returns of about 8% per annum (in local currency terms)—and a more impressive 10% return for USD-based investors—over our 10- to 15-year forecast period. This is driven largely by faster earnings growth than in developed equity markets, even as China’s GDP growth slows. Valuations are also a modestly positive contributor. Conversely, new issuance, which is likely, would increase China’s market capitalization and its share of the MSCI EM index, though it would represent a headwind to equity returns growth through the dilution of existing shareholders.
When we combine our expectations for superior nominal growth with the onshore market’s breadth and abundance of opportunities—structural, idiosyncratic and company-specific, particularly in digitalization, software, health care, electric vehicles, artificial intelligence and 5G infrastructure, where companies are attaining domestic leadership through innovation and/or consolidation11—we conclude that the market should likely outperform rivals and provide superior earnings growth regardless of the state of the Chinese economy.
Finally, while our view is based on better nominal growth, the volatile nature of the retail investors who dominate the market (accounting for 80% to 90% of daily turnover) creates the potential for dedicated, active managers to take advantage of market inefficiencies.
On a stand-alone basis, then, we believe that investing in Chinese equities should achieve superior returns to investing in developed markets. But how would a China equity allocation interact with the rest of an equity portfolio? Below, we model how the diversification benefits of foreign investors adding China equities (vs. investing in ACWI alone) could lift returns while improving volatility.
Aren’t global and EM equity managers reliable sources of onshore China exposure?
One challenge for institutions may be determining what their China exposure actually is. It’s probably lower than many realize. According to a 2019 survey of 121 asset managers using the ACWI benchmark, the average exposure to onshore China A shares was just 0.7%—and 73% of ACWI managers had none at all (they may have had allocations to offshore China H shares, traded in Hong Kong).12 GEM managers fared a little better, averaging a 3.6% allocation, a slight underweight vs. the GEM index’s 4% allocation. The top 10 GEM managers, though, tended to have even less than that, with a 2.8% average allocation. Perhaps surprisingly, 30% of GEM managers had no onshore A-share exposure.
An overweight to China can be found among some GEM managers (24%), according to the same survey and, of course, among dedicated China managers with on-the-ground, Mandarin-speaking teams. The lack of that capacity may be preventing other GEM and/or ACWI managers from overweighting China. Setting up and running a sufficiently robust research presence in the country is expensive and complicated.
Case study: Reallocating to China A shares in an international portfolio can improve risk-reward
Once you know your institution’s overall allocation to China, it probably makes sense to consider the possible impact of other exposure levels on the portfolio’s risk-return profile. One reason: index providers’ stated intention to gradually increase the inclusion of Chinese assets over time. Although steadily rising index inclusion is not guaranteed and the exact timing is unclear, it’s highly likely to happen. Exhibit 1 illustrates why some investors may want to move sooner to implement what index providers and large institutions are expected to do eventually: Consider adding onshore China exposure.
We explored the impact of adding China exposure (i) under projected rising IIF scenarios (gray line); (ii) by adding onshore China A shares to an ACWI portfolio (blue line); by adding offshore China H shares (purple line). The modeling took the pertinent LTCMAs: China equities’ return projections, their correlation to other markets, and volatility risk based on historical data. In every case, an allocation to A shares over and above current benchmark index weights (the lowest black dot) and above projected future weights, would result in a more optimized portfolio with an improved efficient frontier—the concept that an investor receives higher expected returns for each given level of additional risk.
An added allocation to onshore A shares can add to returns without significantly increasing risk
EXHIBIT 1: EFFICIENT FRONTIERS, ACWI ALONE; ACWI PLUS CHINA ONSHORE SHARES; ACWI PLUS CHINA OFFSHORE SHARES (PROJECTED)

Source: J.P. Morgan Asset Management; estimates as of May 31, 2020.
Today’s MSCI IIF of 20% includes 20% of China’s market cap, which translates to an approximate 4.5% China weighting in the ACWI—comprising 0.5% onshore A and 4% China ex-A shares. Increasing the IIF will significantly lift the efficient frontier (gray line), but adding A shares lifts the efficient frontier even higher. We can draw several conclusions:
- Risk-reward improves: Moving portfolio allocation to the weighting implied by a 100% IIF would meaningfully improve the risk-reward of an ACWI portfolio, according to our projections.
- A higher onshore allocation further improves risk-reward: Using the LTCMAs, we find that substituting 5% of onshore China A shares for 5% of ACWI in a portfolio further improves returns, with no worsening of the expected volatility.
- Better diversification offsets volatility: Using our LTCMAs, we project China A shares would provide attractive returns with lower correlation to developed markets—roughly 0.4, though this is expected to increase as foreign investor participation rises. The efficient frontier—an optimized portfolio—rises along with additional China exposure. The reason is the strong diversification benefits. While the market does have relatively high volatility, our LTCMAs’ correlation projections show it is not high enough to negate the diversification benefit.
- Volatility should decline in time: As inclusion rises, we expect the market’s dominant participants to shift from retail to institutional and for foreign institutional holdings to gradually increase. As China equity becomes a more mainstream asset class, it will likely experience a decline in volatility.
Active managers have historically added significant value in China
The depth and inefficiencies of this retail-driven market have historically provided active managers with a significant opportunity to add value (Exhibit 2). This is particularly the case when their results are compared with those of managers using MSCI China indices, which have broader coverage than the local benchmark (the CSI 300 Index) and consequently a larger number of lower quality, more volatile small and mid-cap stocks.
Another advantage dedicated, active managers may have, as noted above, is the ability to research China the way it needs to be done. Many EM managers may not be prepared to do so, and while top domestic China fund managers today deploy up to 50 dedicated research analysts to follow companies, history shows there has been significant staff movement and, in line with market turnover, a focus on short-term opportunities rather than long-term business fundamentals.
Alpha opportunity from stock picking in China has been significant
EXHIBIT 2: FIVE-YEAR EXCESS RETURN DISPERSION

Source: J.P. Morgan Asset Management and eVestment; data as of end March 31, 2020.
Tapping into important long-term growth can help investors meet a range of objectives
There is no one-size-fits-all solution that matches every institution’s risk tolerance. However, our examination suggests domestic onshore China equity offers global and EM investors an opportunity for a substantial return premium over developed markets. And in this large, idiosyncratic, inefficient and growing stock market driven by domestic economic growth, this return premium is likely to be offset only partially by higher dilution. We further believe that active investing opportunities tapping into important long-term growth trends can help investors with a variety of preferences to meet a range of objectives. And—perhaps surprisingly—modelling based on our LTCMAs finds an allocation to onshore A shares can add to returns without significantly increasing risk.
HOW WE BUILD OUR CHINA LTCMAS
The building blocks of our China LTCMAs
A BREAKDOWN OF OUR LTCMA EQUITY ASSUMPTIONS METHODOLOGY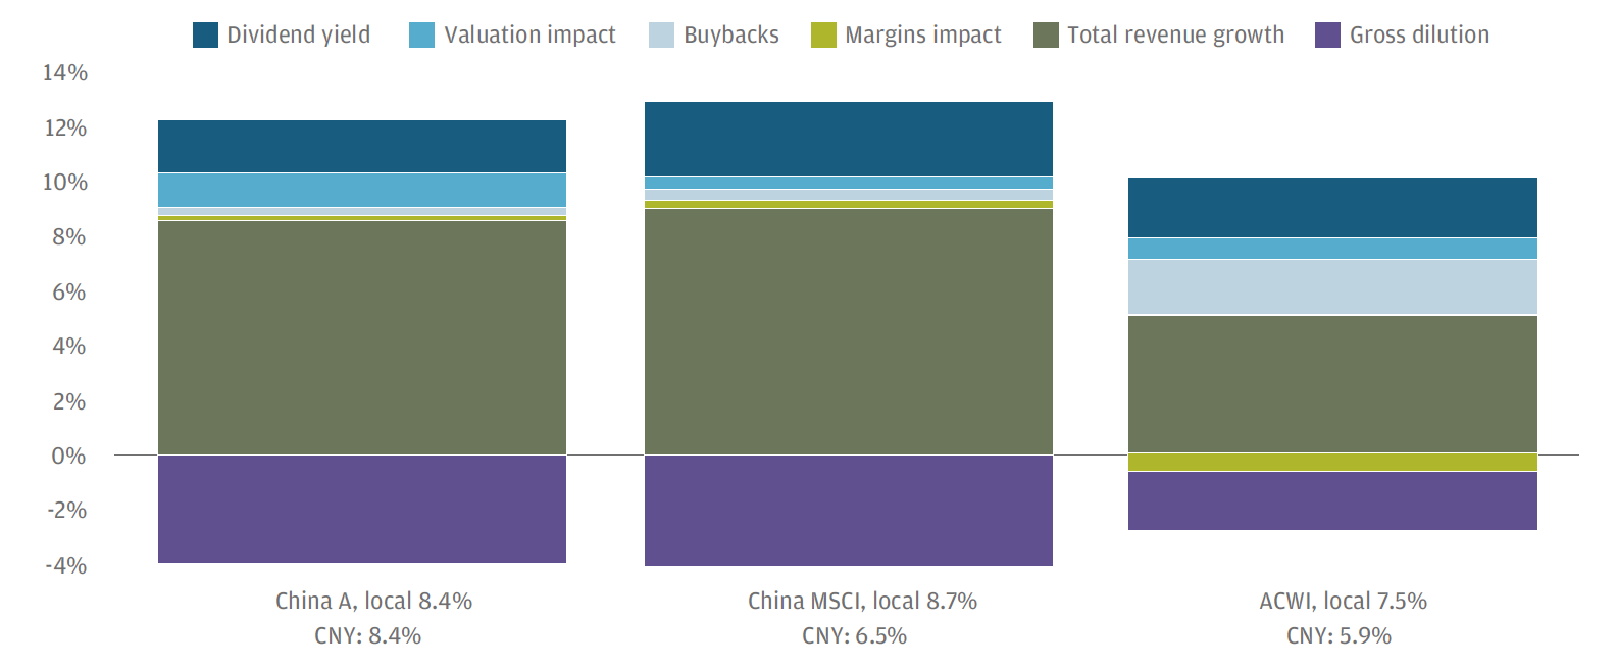
Source: J.P. Morgan Asset Management as of March 31, 2020. Opinions, estimates, forecasts, projections and statements of financial market trends that are based on current market conditions constitute our judgment and are subject to change without notice. There can be no guarantee they will be met.
Our LTCMA equity assumptions methodology breaks total equity returns into easier-to-forecast return drivers for each market and enables us to make explicit assumptions for each one:
- Aggregate revenue growth, derived from our economic growth and inflation forecasts, taking into account the global composition of corporate revenues
- Any required normalization of corporate profit margins
- Net shareholder dilution, which breaks down into share issuance and share buybacks
- Any required normalization of valuation levels (P/Es)
- Dividends (carry)
Perhaps most importantly, our methodology ties together the complex interrelationships among these factors to ensure that expected earnings growth, payout and retention of earnings, net shareholder dilution, implied return on equity and book values are all consistent. For instance, this framework ensures that higher shareholder payouts would come at the expense of slower earnings growth, all else equal. Our methodology uses trailing earnings, which tend to be more stable than forward earnings and have a longer available data history.
1 Throughout this paper, references to an international index are to the MSCI All Country World Index (ACWI). Data as of April 30, 2020.
2 We use our LTCMA assumptions for Chinese equities, as well as our volatility and correlation assumptions.
3 “Investors able to carry out the requisite analysis may find opportunities, including in China’s rising services and consumer sectors, and elsewhere in Asia as China’s development effects reach beyond its borders.” Michael Hood, Patrik Schöwitz et al., “China’s path to becoming a higher income country,” 2020 Long-Term Capital Market Assumptions, J.P. Morgan Asset Management, November 2019, https://am.jpmorgan.com/us/en/asset-management/gim/adv/ltcma. Access requires registration.
4 Defined as USD10,000 per capita annual income.
5 Hood, Schöwitz et al.
6 The middle income trap is a phenomenon in which countries’ growth stagnates as basic manufacturing does not give way over time to a more complex economy.
7 Stock Connect is a collaboration among the Hong Kong, Shanghai and Shenzhen stock exchanges allowing international and onshore Chinese investors to trade securities through their home exchanges’ trading and clearing facilities. “What is Stock Connect” HKEX.com, Hong Kong Exchanges and Clearing Limited, 2020, https://www.hkex.com.hk/Mutual-Market/Stock-Connect?sc_lang=en.
8 Hood, Schöwitz et al.
9 It was slightly less liquid than the total of U.S. equity markets in 2019. Bloomberg, “Perspective: Equity markets Liquidity Monitor,” J.P. Morgan Emerging Markets Equity Research, June 11, 2020. (Market cap uses all exchanges covered by Bloomberg for a country and primary securities only. To calculate free float we use the MSCI free float factor; Velocity Ratio = (Trading Value/Free float market cap)*100.
10 MSCI has done this in the past with other emerging stock markets, including Korea and Taiwan. Its stated reasons for not doing so immediately with A shares include a lack of access to listed futures and other derivatives, the short settlement cycles of A shares and other issues related to operation and execution. “Further Weight Increase of China A Shares in MSCI Indexes,” MSCI, February 2019, https://www.msci.com/documents/1296102/12275477/China_A_Further_Weight_Increase_Feb_2019_Presentation.pdf/e9cf153a-2e4f-a110-2699-9d8163e917c2
11 Howard Wang et al., “Opportunities in public and private equity in China: Selectively tapping Asia’s long-term promise,” J.P. Morgan Asset Management, July 2019, https://am.jpmorgan.com/blobcontent/1383627026726/83456/PI-CHINA-EQUITY_FINAL.pdf.
12 “Crafting the Optimal China Allocation Strategy: The Asset Owner’s Perspective,” Greenwich Associates, Q2 2020.

For Fund or Institutional enquiries, please call or email us. You can also contact your financial advisor or your J.P.Morgan Representative.