Leveraging rating transition matrices
We analyze forward-looking rating transition matrices in US Corporate Credit markets and lay out how they can be informative when making investment decisions.
05-07-2023
Jonathan Msika
Bhupinder Bahra
An analysis of forward-looking rating transition matrices in US credit markets
In our previous GFICC (Global Fixed Income Currency & Commodities) blog publication we presented a framework for predicting composite bond rating changes. The framework encapsulates forward-looking rating transition scores and their associated hit rates.1 When these hit rates are calibrated historically with respect to multi-notch one-year-ahead rating outcomes, it is possible to use them and the current rating transition scores to construct forward-looking annual rating transition matrices.
Current forward-looking rating transition matrices
For example, consider the 12-month-ahead rating transition matrix shown in Table 1a for the US investment grade bond universe, formulated as of 15th June 2023.
Table 1a
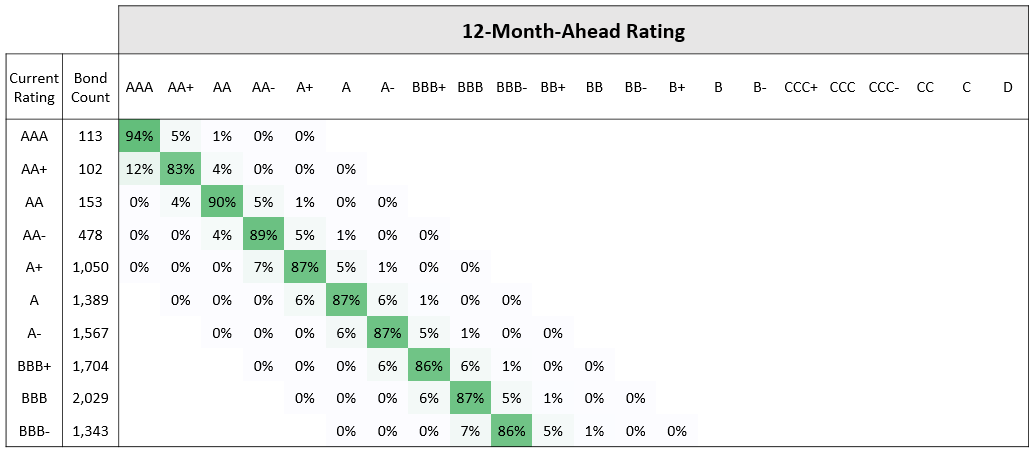
12-month-ahead rating transition matrix as of 15th June 2023, US investment grade bond universe. Source: Bloomberg Fixed Income Indices, ICE BofA Indices, S&P, Moody’s, Fitch, JP Morgan Asset Management.
Table 1b
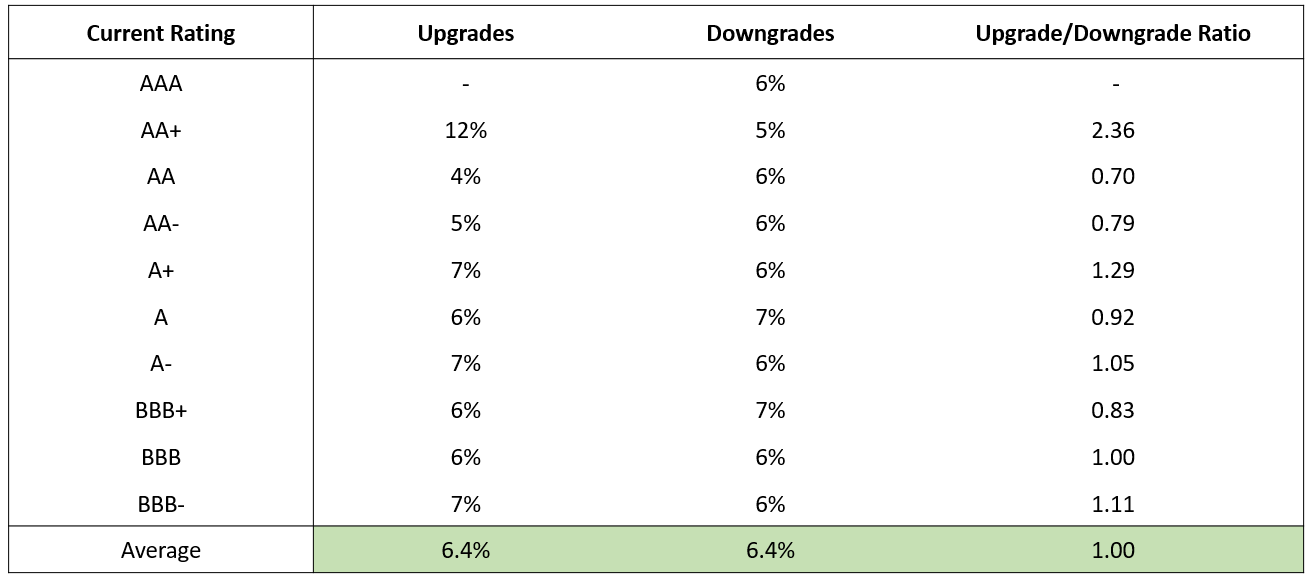
Summary statistics, 12-month-ahead rating transition matrix as of 15th June 2023, US investment grade bond universe. Source: Bloomberg Fixed Income Indices, ICE BofA Indices, S&P, Moody’s, Fitch, JP Morgan Asset Management.
The matrix shows current bond ratings in the first column and the probabilities associated with various multi-notch moves from the current ratings over the next year. The diagonal, which has the largest number in each row, shows the probabilities of current ratings remaining the same over the period. For example, a AA rated bond has a 90% chance of remaining with a AA rating over the next year, a 4% chance of getting upgraded to AA+, a 5% chance of getting downgraded one notch to AA- and a 1% chance of getting downgraded two notches to A+.
Table 1b shows a summarised version of the matrix. In each row we sum up the upgrade probabilities, represented by the numbers to the left of the diagonal value, and the downgrade probabilities, represented by the numbers to the right of the diagonal value. We can use these to form row-specific upgrade/downgrade ratios. Ratios above 1 depict a potential skew to higher quality, whilst ratios below 1 are indicative of a deteriorating ratings picture. Furthermore, the entire transition matrix can be summarised by just one number – the bond count weighted average of all upgrade/downgrade ratios from every row, in which a higher (lower) weight is given to ratios from cohorts with a greater (fewer) number of bonds. In the case of US investment grade this number is currently 1.0, which predicts a balanced set of potential outcomes over the next year.
How does the picture look in US high yield? The 12-month-ahead rating transition matrix for the US high yield bond universe is shown in Table 2a, formulated as of 15th June 2023. The summarised version is shown in Table 2b.
Table 2a
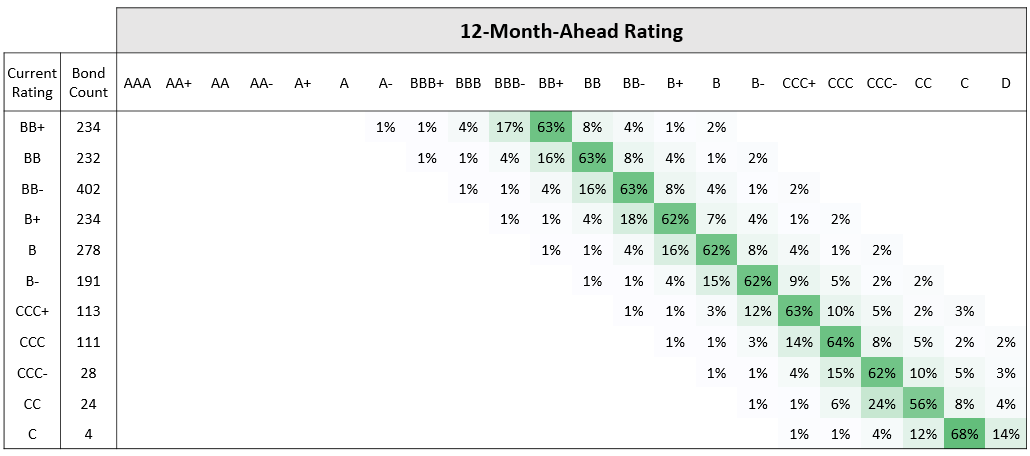
12-month-ahead rating transition matrix as of 15th June 2023, US high yield bond universe. Source: Bloomberg Fixed Income Indices, ICE BofA Indices, S&P, Moody’s, Fitch, JP Morgan Asset Management.
Table 2b
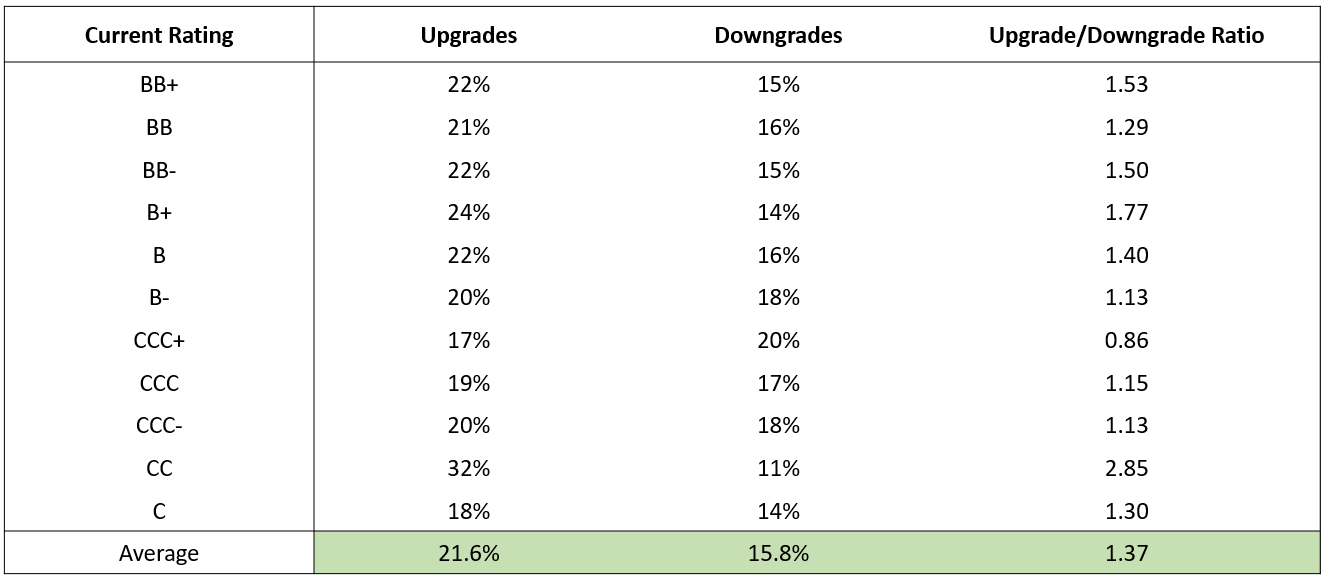
Summary statistics, 12-month-ahead rating transition matrix as of 15th June 2023, US high yield bond universe. Source: Bloomberg Fixed Income Indices, ICE BofA Indices, S&P, Moody’s, Fitch, JP Morgan Asset Management.
Of course, there is generally greater rating volatility in the high yield investment universe. It’s immediately apparent that the diagonal values are smaller than those shown for investment grade in Table 1a above. This consequently means that the off-diagonal values, representing one-year ahead upgrade probabilities to the left and downgrade probabilities to the right, are larger. In this case the upgrade probabilities are on average 1.37 times larger than the downgrade probabilities – that is, US high yield looks better placed than US investment grade from a forward-looking rating transition perspective.2 As a percentage of each universe, there are a greater number of high yield bonds with rating transition scores of +1 or better than there are investment grade bonds.3 Moreover, it would be fair to say that all three of the underlying rating drivers – namely rating momentum, index methodology composite rating bias and credit watch flag – have contributed towards these results.
Historical context
How does the current predictive rating transition matrix compare with annual historical outcomes? Figure 1 shows the percentage counts of realised annual upgrade and downgrade outcomes from 2016 to 2022. Note that the outcomes from January to mid-June 2023 have been shown as shaded since they, unlike the others, do not pertain to an annual time period. The “prediction” data to the right depicts the upgrade and downgrade summary statistics from the 12-month-ahead rating transition matrix as of 15th June 2023.
Figure 1
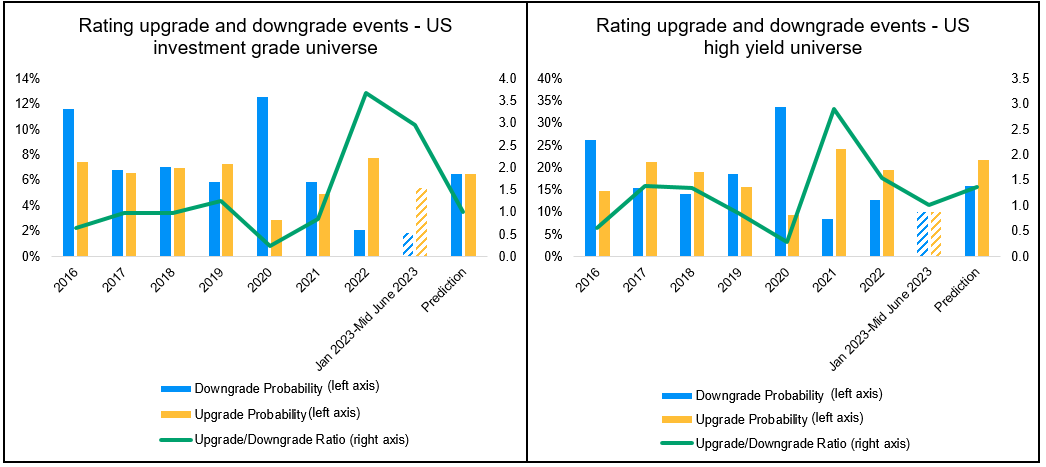
Rating upgrade and downgrade events, US investment grade and US high yield bond universes. Source: Bloomberg Fixed Income Indices, ICE BofA Indices, S&P, Moody’s, Fitch, JP Morgan Asset Management. Data as of 15th June 2023.
In terms of historical outcomes, the lowest upgrade/downgrade ratios occurred in 2020, the year that the Covid-19 pandemic started. Whilst the recovery took two years in US investment grade, with the upgrade/downgrade ratio peaking in 2022, it was accelerated by a year in US high yield due to a high level of upgrade events in the Consumer Cyclical and Energy sectors. Separately, the high level of upgrade events measured in US investment grade in the period January to mid-June 2023 were mainly due to positive outcomes in the Banking and Consumer sectors.
Investment implications
We have used our proprietary rating transition analysis framework to calculate 12-month-ahead US investment grade and US high yield rating transition matrices. Such information may be applied in a number of different ways within an investment management setting. For example:
- Rating transition matrices may be computed for both client portfolios and their respective investment benchmarks, thereby allowing the projected rating outcomes embodied within portfolios to be directly compared and contrasted with those arising from the wider universe of investable bonds.
- Rating transition matrices may be helpful, as one of many inputs, for making asset allocation decisions – an asset class with a rating transition matrix that is skewed towards projected upgrades may be more favourable from an investment perspective.
- Transition probabilities may also be depicted at the sector level – sectors in which a greater number of upgrades have been projected relative to downgrades, for example, would potentially be more attractive for asset allocation purposes.
- Transition probabilities may be used to analyze the expected rating behaviour of bonds around their rating cliffs – we will explore this topic in greater detail in a forthcoming GFICC blog.
09lg232706203148
1 As a reminder, the rating transition scores were made up of three specific indicators derived from rating agency bond-level outputs: (i) rating momentum, (ii) index methodology composite rating bias and (iii) credit watch flag. We define hit rate as an empirical measure of how often, within our historical dataset, composite rating change predictions got materialised over given future time periods.
2 Bonds in the BB+ and B+ rating cohorts have upgrade/downgrade ratios that are as high as 1.53 and 1.77, respectively. Note, we inherently attach less significance to the average upgrade/downgrade ratios in the CCC-, CC, and C rating cohorts due to there being fewer bonds in these buckets.
3 20% of US high yield bonds have positive rating transition scores, in comparison to 10% of US investment grade bonds. This, together with the upgrade hit rates associated with the positive rating scores in high yield, is what has resulted in a positive upgrade/downgrade rating skew in the US high yield universe. The high yield Consumer Cyclical and Energy sectors are contributing most towards this skew.