Putting recent value outperformance in perspective: A lost decade (plus)
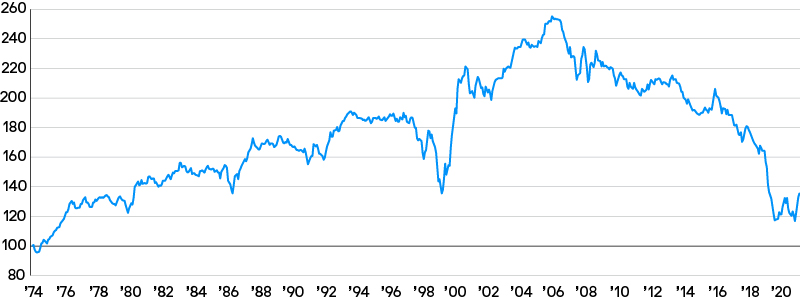
Value’s comeback started in November 2020 with Pfizer’s announcement of a Covid vaccine, and has accelerated since. Year to date, the MSCI World Value Index has outperformed the Growth Index by over 15%.1 Yet the impressive recent outperformance of Value is merely a drop in the ocean compared to the underperformance that Value has suffered since 2007 (Exhibit 1).
Exhibit 1: Cumulative excess returns of MSCI World Value vs. MSCI World Growth
Source: MSCI, Bloomberg. Data as of 28 February 2022.
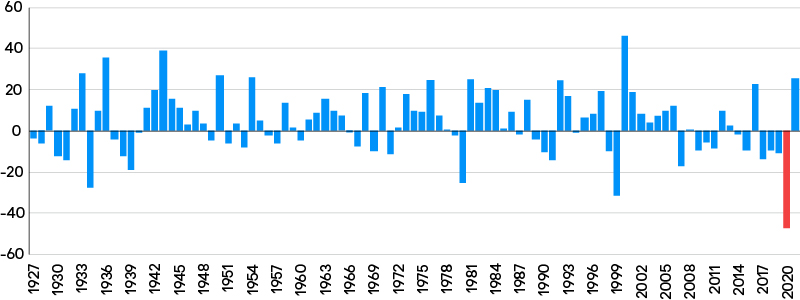
In fact, the period from mid 2007 to late 2020 was an anomaly in an otherwise long history of Value dominance. In those 13 years, Value underperformed universally across geographies, sectors, metrics and asset classes. This period was the longest drawdown that Value has endured since World War II, culminating in the 2020 pandemic, during which Value had the worst year in recorded history (Exhibit 2).
Exhibit 2: Returns for US Value by year, 1927-2021
Source: Kenneth French data library.
There are several reasons for Value’s underperformance. The 2008-2009 global financial crisis kicked off an era of secular stagnation, which was very supportive of Growth. In a world in which growth was scarce, investors hid in the few companies that delivered earnings growth, driving these stocks to trade at ever higher premiums.
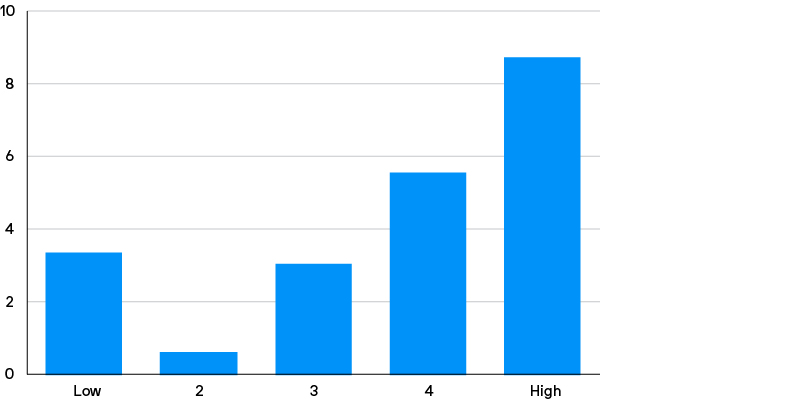
More importantly, stubbornly mediocre economic growth also kept inflation at record low levels. In response, central banks attempted to restart global growth by keeping interest rates near zero, flooding the markets with money through massive quantitative easing programmes not seen since the 1930s, and effectively turning rates negative. Value does best in high inflation regimes, and so falling inflation expectations had a material influence on performance (Exhibit 3).
Exhibit 3: US Value stock performance over the next 12 months at different levels of inflation, July 1927 to January 2022
Source: Bloomberg and Kenneth French data library. Inflation level determined by US consumer price index (CPI) vs. prior 10-year average.
The worth of an asset – especially those whose cash flows come in the far future – partially depends on the cost of capital. When capital is cheap, investors invest in the future, but if capital is expensive, investors demand their returns today. We have been living in a world where the cost of capital has been negative, and as a rising tide lifts all boats, falling rates lifted all Growth stocks.
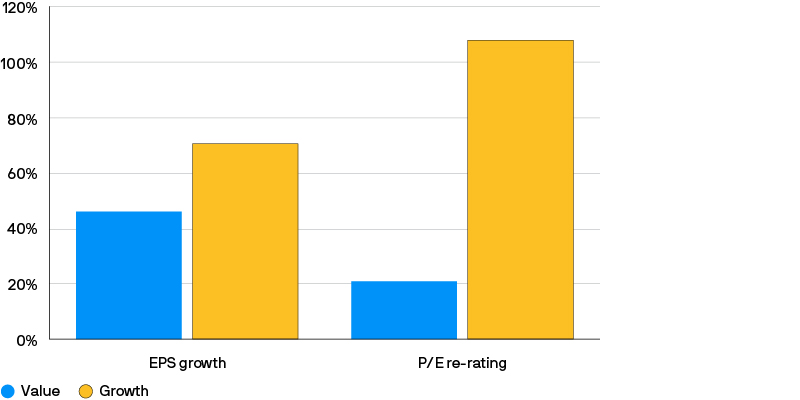
Given this favourable backdrop, not only did earnings growth of Growth stocks outpace that of their Value counterparts, but more importantly, their valuations re-rated across the board, significantly and indiscriminately. There was no regard for whether this growth was realistic or illusory, sustainable or speculative—and the resulting rise in valuations masked many issues with some of the hottest growth companies (Exhibit 4).
Exhibit 4: Breakdown of returns for Value vs. Growth by EPS growth and P/E re-rating, 2011-2021
Source: MSCI and Bloomberg. EPS = earnings per share; P/E = price to earnings.
Peak growth
The outperformance of Growth stocks peaked in 2020, when the pandemic sent global economic growth into a nosedive and central banks went into overdrive. As the world moved online, Growth benefited as innovation and disruption accelerated, and what would have taken years to take hold took mere months. On the other hand, many Value sectors saw their revenues disappear overnight.
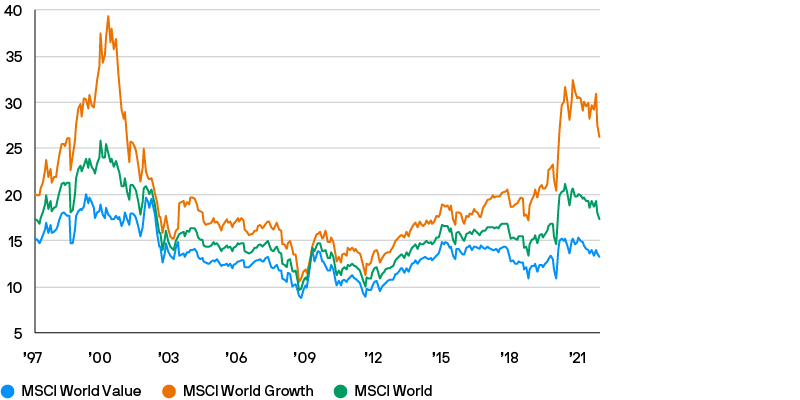
The markets made the same mistake as they did during the TMT bubble, by boosting future normalised growth rates. By the end of the year, expectations became divorced from reality, and the valuation of high-growth companies approached those seen in the TMT bubble (Exhibit 5). Valuations of many stocks skyrocketed – Zoom Communications was up six fold at its peak, while Peloton rose nine times, before both stocks subsequently gave up their gains in the following two years.
Exhibit 5: Forward P/E ratios for MSCI World Value, MSCI World Growth and MSCI World
Source: FactSet Estimates, MSCI, Bloomberg. Data set 31 January 1997 through 28 February 2022. Based on next 12-month forward P/Es.
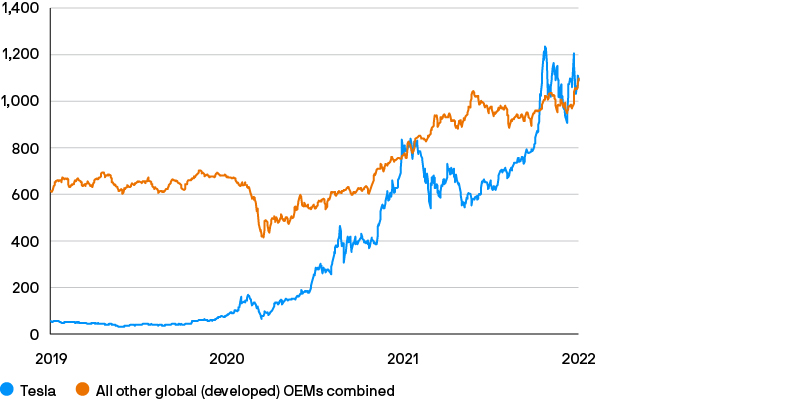
A prime example of excessive Growth stock valuations is Tesla, whose market capitalisation overtook that of all other global developed market carmakers combined (Exhibit 6), even though the company accounted for less than 2% of 2021 developed world car sales according to company-released data.
Exhibit 6: Market capitalisation of Tesla vs all other global automakers
Source: Bloomberg. Data as of 13 January 2022.
While Tesla markets itself as an innovative software company, it is only one automaker in a highly competitive, fragmented industry. In fact, Tesla’s market share within the electric vehicle (EV) market may have already peaked as other automakers have now waded in, and established players, such as Volkswagen, Hyundai and Ford, are forecast to have significant market shares in the years to come.2 Yet at current valuations, Tesla is trading like it has a monopoly on the global EV market.
Another example is Meta (Facebook), which has already fallen by a third since its mammoth profit warning in early February. Yet it remains one of the top 10 largest companies in the world by market capitalisation, despite earnings downgrades of 15%-20% for the coming year, no earnings growth forecast over the next two years and arguably having already reached peak users and earnings.
Such high expectations have already been baked in that even if Growth companies were to deliver on their promises, returns may not follow. For example, Amazon and Microsoft are undoubtedly great companies, but if you had bought them at the height of the TMT bubble in December 1999, it would have taken 10 years and 15 years, respectively, to break even. Valuation – no matter how good the company is – matters, even in the long term.
Finally, unprofitable companies also saw record performance in 2020, much of which has unwound over the past year. If the TMT bubble is any guide, these stocks can continue to underperform. The run-up for unprofitable companies in 2017-2020 was roughly equal in magnitude to the (shorter) run in 1998-1999, but the drawdown to date is only around 50% vs. 80% in 2000- 2002. History tells us that only a third of unprofitable companies achieve operational profitability and only a quarter outperform the broader universe within three years.3 Picking the winners with accuracy is a tall order indeed.
All of this indicates that we are in for a reckoning that has only just begun. Value had been out of fashion for so long that many investors have never experienced a Value-led market for any significant period of time and are accustomed to short rallies lasting only six to nine months.
However, investment styles typically perform in multi- year regimes and there are a handful of examples of Value enjoying prolonged outperformance. The most famous of these was the aftermath of the TMT bubble, which saw around 90% outperformance for Value over a sustained seven-year period.4 Many parallels can be drawn between today and the late 1990s:
It’s not over: the potential for value is still great
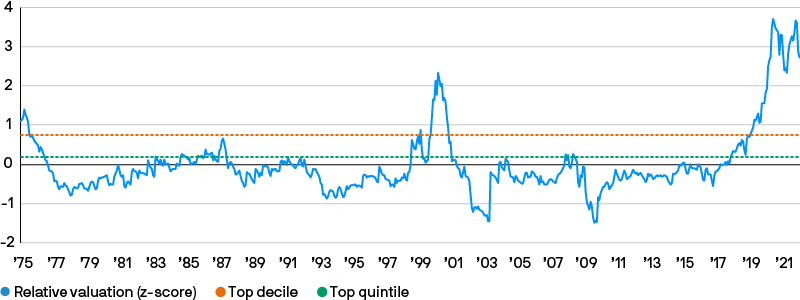
Despite recent performance, valuation spreads between Value and Growth stocks remain very wide. Earnings for Value stocks kept pace with (or exceeded) increases in their share prices last year; at the same time, investors were quick to take profits. Spreads are still more extreme than at the height of the TMT bubble – quite remarkable when Value has outperformed Growth by more than 20% since the Pfizer vaccine announcement on 9 November 2020 (Exhibit 7).
Exhibit 7: Relative valuation of MSCI World Value vs. MSCI World Growth
Source: J.P. Morgan Asset Management based on data from MSCI between 31 December 1974 and 28 February 2022. The relative valuation is based on the price to book (P/B), P/E and the dividend yield of the Value relative to the Growth index normalized for comparison.
Where have all the Value managers gone?
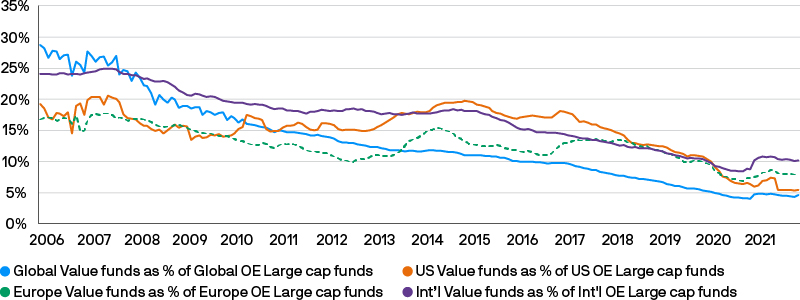
Value investing remains a lonely place. Around the world, the proportion of equity assets invested with Value managers has fallen to 5%-10% (Exhibit 8). Returning to the level of 2006-2007 would require a roughly three-fold increase in the current proportion of equity assets held in Value funds.
In terms of assets under management (AUM), at the end of February 2022 the Morningstar Global Large-Cap Blend and Growth peer groups were nine times and five times the size of the Value peer group, respectively. There has also been significant style drift towards Growth from funds within the Blend category over the last 14 years. Flows may well be another tailwind for Value.
Wide valuation spreads and low positioning indicates the potential for Value to outperform is significant. However, potential alone is not enough – we need a catalyst, which finally came just over a year ago.
Exhibit 8: AUM of Value funds as a percentage of large cap funds, by region
Source: Morningstar. Data as of 31 December 2021.
The catalysts: Where does value go from here?
The Pfizer vaccine in late 2020 was the first catalyst for the latest Value comeback and set the stage for the global recovery. Crucially, there are now a number of further fundamental catalysts to provide support for the continued rotation into Value.
Rising growth, rising inflation and rising rates
While Growth companies benefit from lower costs of capital and subdued inflation, Value tends to perform well in inflationary environments. Accommodative monetary policy over the past 15 years has combined with rising economic growth and demand, supply chain bottlenecks and the conflict in Ukraine to drive inflation to the highest level in decades. While inflation is expected to ease as supply chains normalise and demand shifts from goods towards services, wage inflation remains stubborn and higher inflation has become built into expectations. The days of rock- bottom inflation are gone.
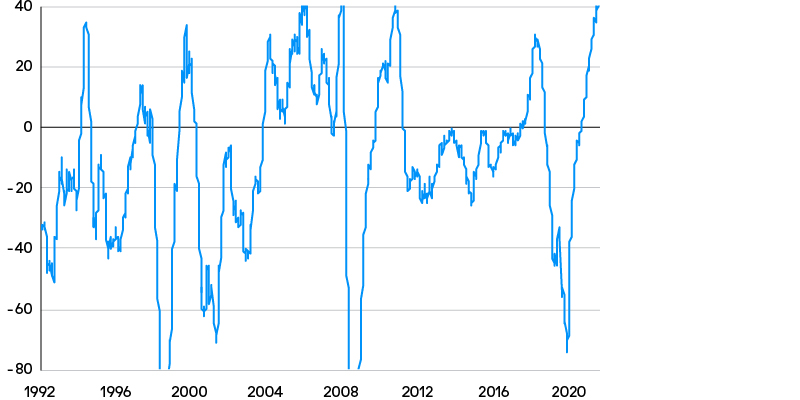
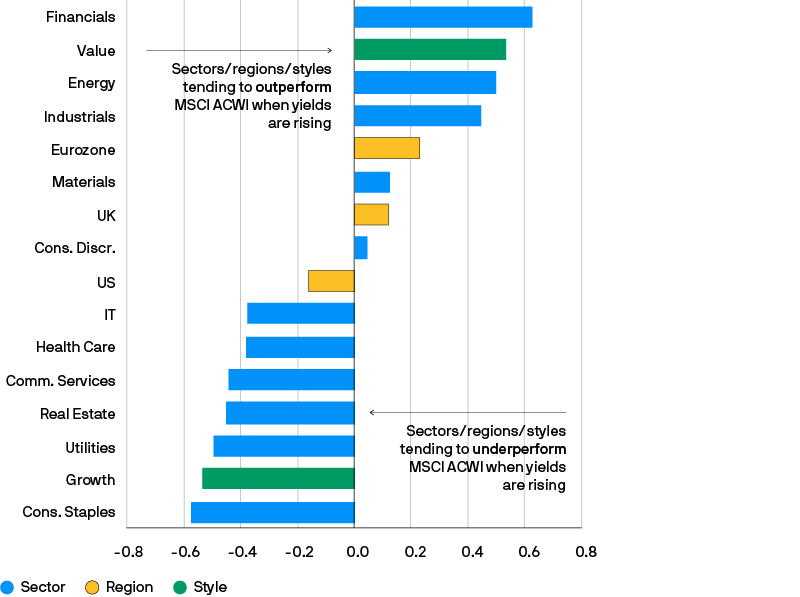
Mounting inflationary pressures are prompting tighter monetary policy across the world (Exhibit 9). The market is now pricing in eight hikes from the Federal Reserve this year, five from the Bank of England, higher rates from the European Central Bank as early as the second half of 2022, and quantitative tightening set to start mid-2022. The rising interest rate backdrop is especially painful for Growth stocks, which are highly dependent on cheap and easy capital, but it should be expected to provide a significant tailwind for Value (Exhibit 10).
Exhibit 9: Number of rate hikes in the past six months for 34 global developed and emerging economies
Source: Bloomberg. Data as of 25 March 2022.
Exhibit 10: Sector, style and regional performance vs. MSCI ACWI when yields are rising or falling
10y correlation of sector rel. performance with US 10y Treasury yield
Source: MSCI, Refinitiv Datastream, J.P. Morgan Asset Management. Correlation of sectors, regions and styles is calculated between the six- month change in US 10-year Treasury yields and the six-month relative performance of each sector, region or style to MSCI All-Country World Index. All indices used are MSCI. Value and Growth as well as size indices used are for the MSCI All-Country World universe.
Guide to the Markets - UK & Europe. Data as of 31 December 2021.
Earnings backdrop: Who’s really delivering?
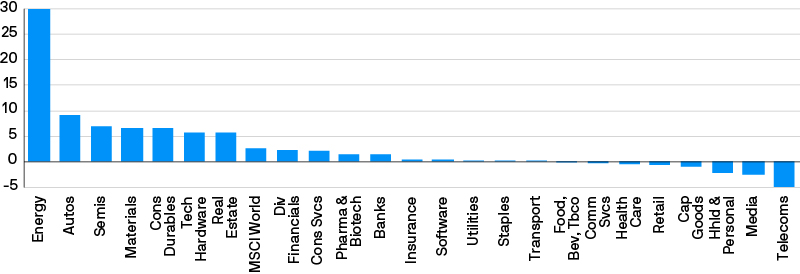
Value stocks tend to perform well in periods of broad earnings growth. Over the past year, Value stocks have seen their earnings surprise on the upside and grow, while the opposite has been true for Growth stocks – especially Covid beneficiaries that have already cannibalised future earnings growth. In recent months, traditional Value sectors such as basic resources, autos and financials have seen far superior earnings momentum than Growth sectors such as media and software (Exhibit 11).
This marks a sharp reversal for Growth stocks. Expectations are now unrealistically high and many of the most favoured stocks are pre-profit. Additionally, Growth stocks that were previously considered unassailable now show that they too are subject to the same forces as the rest of the world: saturated markets and intense competition, supply constraints, and demanding customers. The recent travails of the former star industry, e-commerce, is a case in point.
Growth stocks are rewarded with high valuations for their great promises, but if they disappoint, investors are ruthless. Value traps deliver mediocre returns, but Growth stocks, without the buffer of low expectations, have much further to fall. Research by GMO shows that over time, Value traps underperformed their benchmark by 9.5% annualised, but when Growth fell short, these so-called “Growth traps” underperformed by 13%.5
Exhibit 11: Change (%) in forward one-year earnings over the past three months
Source: Bloomberg. Data as of 28 February 2022.
Due to superior growth rates and more positive earnings surprises, the Value segments of the market maintain compelling valuations, even after strong performance over the past 18 months. For example, commodities and financials stocks delivered outsized returns in 2021, yet none of the price moves kept up with their earnings upgrades and all ended up cheaper on a P/E basis by the end of the year. Energy, which produced whopping triple-digit earnings growth, actually de-rated by over 40% (Exhibit 12).
Exhibit 12: Change in earnings and valuations in 2021 of select sectors with a Value orientation

Source: Morgan Stanley. Data is for calendar year 2021.
Glencore illustrates the point. The stock is up four-fold in the last two years and may appear to be a missed opportunity, yet it still offers roughly a 20% free cash flow yield today.6 An investor who bought the stock in March 2020 would have received almost the entire investment back in free cash flows in one year alone.
While the superior earnings momentum of Value sectors has been evident for over a year now, near-term trends remain supportive. Many Value stocks continue to beat expectations and receive further earnings upgrades. We believe this operational momentum will further boost the Value story.
Three myths of value investing
When considering the opportunity in Value, it’s important for investors to be able to dispel some myths regarding Value investing that have become popular in the past decade.
Myth #1: Value is risky
There is a common belief that Value and cyclical risk are the same, and that Growth is equivalent to Quality.7 This belief is, however, simply not true, both for price (valuation) risk and earnings risk, and especially for companies with no profitability or track record. The argument that future earnings growth renders the current macro environment irrelevant holds only if earnings growth materialises in the first place, which is a tenuous assumption at best.
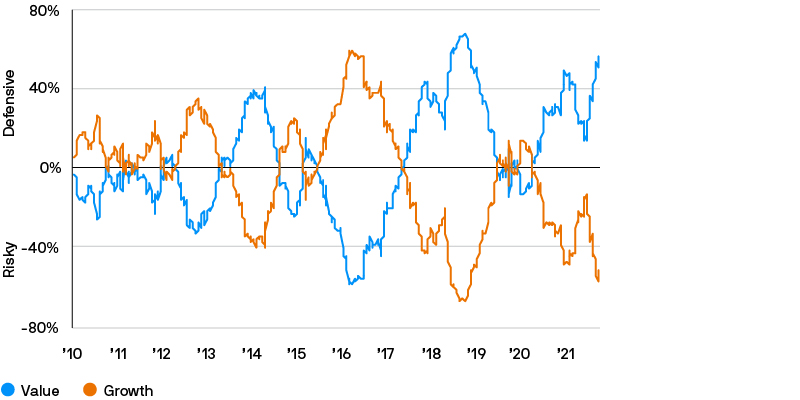
Moreover, growth in the overall market also does not guarantee that the companies themselves will be profitable, as e-commerce has recently demonstrated. And finally, earnings are unlikely to grow as quickly in the post-Covid era when future growth has already been brought forward, and multiples will not hold up in an unfavourable macro environment. In contrast, Value is currently defensive. We believe that the risk lies with Growth and the reward lies with Value (Exhibit 13).
Exhibit 13: Correlation of MSCI World Value and MSCI World Growth excess returns vs. MSCI World minimum volatility index excess returns
Source: Bloomberg, MSCI. Data as of 15 March 2022. Returns are excess of the MSCI World standard index.
Myth #2: Value stocks don’t grow earnings
A common perception that has gained traction of late is that Growth stocks have higher and more consistent earnings growth, and therefore deserve their valuations. However, history has shown otherwise.
Over the long term, Value companies have posted earnings growth that has kept pace with, and has often exceeded, that of Growth companies. Lakonishok, Shleifer and Vishny find that Value stocks are not fundamentally riskier than faster growing “glamour” stocks, and that the differences in the growth rates between glamour and Value companies do not persist.8
Growth rates of Value companies tend to improve as companies divest underperforming units, restructure operations, bring in new management and emulate competitors. It is important to stick to Value to benefit from the strategy’s long-term performance potential, especially when it feels emotionally most uncomfortable.
Myth #3: Value only delivers during brief junk rallies and cannot outperform Growth sustainably
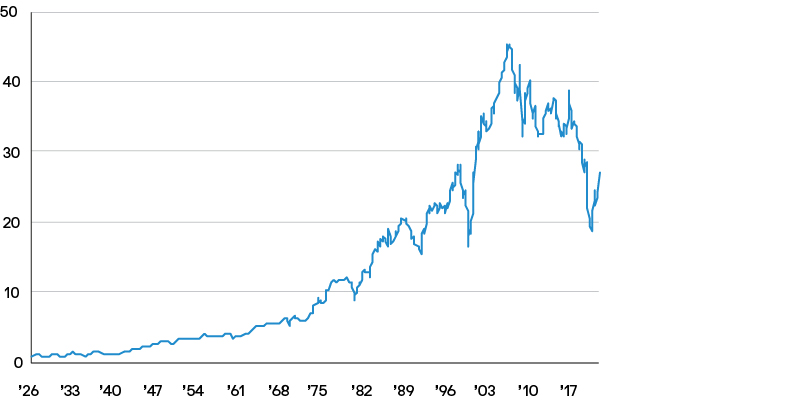
This view is a reflection of recency bias. Value investing has been advocated by investors as far back as Benjamin Graham and David Dodd in the 1930s.9 Fama and French show that there have been many prolonged periods of Value outperformance over the past century and Value has outperformed Growth cumulatively over this time, despite strong headwinds for over a decade (Exhibit 14).
In addition, long-term Russell 1000 data shows that prolonged periods of Growth dominance are usually followed by long periods of Value outperformance.10 Furthermore, many Value investors are able to beat the performance of a standard Value index with superior stock picking and risk management.
Exhibit 14: Cumulative returns to Value over time
Source: Fama and French. Data is from the Kenneth French data library, July 1927 – January 2022.


