


Executive Summary
-
Key insights
-
Productivity returns: An investment surge lifts growth … and volatility
-
Cyclical challenges won’t derail long-term returns
-
Economic nationalism: The good, the bad and the dangerous
-
Technology adoption: Capex supernova
-
Capital rewiring: Nudge, nudge; wink, shove
-
Asset allocation: Fair winds, choppy waters
-
Portfolios: More return, more risk, a lot more opportunity
Key insights
A USD 15 trillion global capex supernova fuels higher growth and strong asset returns over the next 10 to 15 years. Productivity gains mitigate rising inflation risks and an aging workforce. Despite the tail risks, a resilient economy drives resilient markets.
Three forces shape the future and drive returns
Economic nationalism boosts domestic investment but risks a crosscurrent of inflation volatility. Technology adoption is the fair wind filling the global economy’s sails. Rising domestic investment drives capital rewiring, resulting in shifts in public and private capital flows.
The best developed world growth outlook in 15 years
A global investment surge, centered on AI and extending to 2040, boosts total factor productivity by 50%, to 120bps, pushing our U.S. real GDP growth forecast up to 2.1% and developed world nominal growth up to 4.2%. The mix of GDP-to-inflation is the most favorable since the pandemic.
U.S. equity upgrades, a global bond renewal and a first look at bitcoin
Profit margins of over 15% push our U.S. large cap equity forecast up 80bps, to 7.5%, leading to our developed market equity forecasts overtaking our emerging market equity forecasts. Higher real yields drive global aggregate bond forecasts from a low of 2.1% in 2021 to 5.3% today – the highest in two decades. And for the first time, we put a range on bitcoin returns, though we do not yet include bitcoin in our main covariance matrices.
Alternatives for return enhancement, diversification and inflation resilience
We upgrade diversified hedge funds by 140bps on sustained alpha trends and higher rates – with alpha to play for, manager selection is vital. Real asset returns are resilient in the face of persistent inflation volatility, with global transportation returning 8.1%, global core real estate 7.9% and global infrastructure 7.1%.
Greater opportunities to diversify, greater rewards for doing so
A balanced global stock-bond portfolio rises 60bps, to 7.0%, but higher stock-bond correlation demands further diversification. Alternatives can boost risk-adjusted returns: Allocating 30% to diversified alternatives can push returns up to 7.5% and boost Sharpe ratios by 21% compared with a simple balanced portfolio. Diversifying relative to themes as well as across assets can further strengthen portfolio resilience.
Source: J.P. Morgan Asset Management; data as of September 2026
Productivity returns: An investment surge lifts growth … and volatility
In each of our annual editions after the pandemic, we highlighted increased investment, solid growth and more volatile inflation, making the case for strong returns despite geopolitical tension. In 2026, the pattern extended: A global balanced stock-bond portfolio in USD delivered a 9.1%1 total return – 220 basis points (bps) above the 25-year average.
Looking ahead, we acknowledge that volatility is inevitable over our 10- to 15-year forecast horizon as a global capex boom fuels higher growth and strong asset returns. Productivity gains mitigate rising inflation risks and an aging workforce. Despite the tail risks, a resilient economy drives resilient markets. This environment calls for a broad investment opportunity set – and raises the rewards for diversification.
This view attracts scrutiny, and rightly so. Market participants point to demographics, deficits, energy transition and geopolitical fragmentation as causes for concern. These issues are important, but they are starting conditions that define the world today. The choices made to adapt to them will define the world, and the returns, of tomorrow.
Three powerful forces shape the economy and drive returns. Economic nationalism boosts domestic investment but risks a crosscurrent of inflation volatility. Technology adoption is the fair wind filling the global economy’s sails. Rising domestic investment drives capital rewiring, resulting in shifts in public and private capital flows.
Economic nationalism2 has become entrenched as governments focus inward and spend on projects that bolster domestic resilience, at times trading economic efficiency for political expediency. Some elements of economic nationalism – industrial strategy, for instance – can be useful in reframing global issues such as climate change.3 While this can add to overall demand over time, it may also spur inflation and market volatility.
Technology adoption4 today is synonymous with artificial intelligence (AI), but breakthroughs in other areas, from medicine to robotics to space, will likely advance in the next decade, further supporting trend growth via investment and productivity. As investment intensifies, there is scope for capital rewiring.5 Former nation savers will become nation spenders.
Capital allocation ultimately steers the economy toward its destination. This has important implications for the nature and geographic spread of growth over our forecast horizon.
These themes may be disruptive, but together they boost our G76 nominal growth forecast by 30bps, to 4.2% – the best in 15 years, with the best mix of real growth and inflation since the pandemic (Exhibit 1).
Still, economies driven by investment and productivity risk becoming more unequal as gains accrue faster to capital than to labor. That inequality is central to today’s K-shaped economy,⁷ which likely persists over our investment horizon. A K-shaped economy, with unequal returns to capital vs. labor, is a metastable state – surprisingly durable, but sensitive to stress or shock. Its persistence relies on channeling sufficient economic reward to the lower leg of the K to maintain stability while optimizing the growth and profit accruing to the upper leg of the K.
Higher growth and fiscal deficits imply higher real rates and larger term risk premia. These factors, combined with starting yields that have fully normalized from the low rates of the 2010s, give us the highest global bond forecasts in two decades.
Strong investment and productivity underpin profits and equity returns, as we make a 50bps upgrade to global equity forecasts, to 7.5%. We factor prevailing risks into modestly higher volatility forecasts. For investors in a balanced portfolio, our 10- to 15-year return forecast improves 60bps, to 7.0%,8 while a balanced portfolio with 30% diversified alternatives9 sees forecasts increase 50bps, to 7.5%, with hedge funds in particular capturing the more favorable alpha environment.
Our 10-year G7 trend nominal growth forecast is the highest in 15 years
Exhibit 1: LTCMA 10-15 year forecasts of G7 growth and inflation
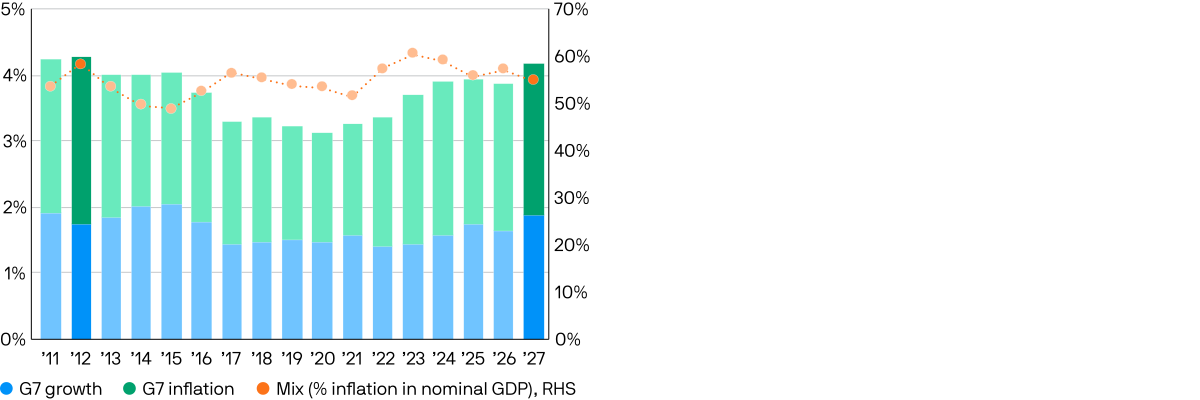
Source: Bloomberg, International Monetary Fund World Economic Outlook April 2026, J.P. Morgan Asset Management; data as of September 2026.
1 Bloomberg, J.P. Morgan Asset Management. Total return for a global balanced stock-bond portfolio in USD (60% ACWI equity and 40% US Aggregate bonds), rebalanced quarterly, from September 30, 2025, to September 30, 2026. The 25-year average is the annualized return from September 30, 2001, to September 30, 2026. Past performance is not a reliable indicator of current and future results.
2 Economic nationalism refers to policies that prioritize national security, resilience and strategic advantage over economic efficiency, such as industrial strategy, tariffs and restrictions on trade and migration.
3 Ludovic Thulliez, John Bilton, Kerry Craig, “Who bears the cost? The evolving economics of climate change,” 2027 Long-Term Capital Market Assumptions, J.P. Morgan Asset Management, October 2026.
4 Technology adoption refers to the spread of new technologies through businesses and the wider economy as firms invest in them and embed them in their processes, raising productivity. See Stephanie Aliaga, Madison Faller, David Kelly et al., “A brighter productivity outlook for the AI era,” 2027 Long-Term Capital Market Assumptions, J.P. Morgan Asset Management, October 2026.
5 Capital rewiring refers to shifts in where global savings are invested as former surplus economies deploy more capital at home and governments steer domestic savings, such as pension assets, toward local investment, reshaping public and private capital flows.
6 G7 refers to Canada, France, Germany, Italy, Japan, the UK and the U.S. Nominal growth reflects our real GDP growth and inflation forecasts combined.
7 A K-shaped economy is one in which outcomes diverge, with gains accruing faster to owners of capital and higher income households (the upper leg of the K) than to labor and lower income households (the lower leg).
8 Compound annual return in USD for the balanced portfolio defined in footnote 1, vs. 6.4% in our 2026 LTCMAs. Source: J.P. Morgan Asset Management; estimates as of September 30, 2026.
9 A balanced portfolio with 30% diversified alternatives refers to 40% MSCI ACWI, 30% Bloomberg US Aggregate, 7.5% private equity, 7.5% real estate, 7.5% real assets, 4.5% private credit and 3% hedge funds. J.P. Morgan Asset Management; estimates as of September 30, 2026.
Cyclical challenges won’t derail long-term returns
In a centuries-old tale, a weary traveler asks a farmer how to get to Dublin, only to be told, “Well, I wouldn’t start from here.” The story should resonate with investors today. The cyclical starting point for their journey includes demographic challenges, high deficits, ongoing energy transition and geopolitical fragmentation.
But while these conditions define our cyclical starting point and create a hurdle, they do not derail long-term growth or asset returns. Indeed, the normalization of yields since 2022 creates a compelling entry point not just for bonds but also for other assets, including many alternatives, that have repriced relative to bonds.
Post-pandemic, governments are more willing to use fiscal levers to ignite better growth – and if corporations can be brought along for the ride, all the better. Fiscal spending by G7 nations in the 2020s has risen by 7% compared with the 2010s, and corporate capex is now growing at 6.1%, 1.4% and 1.6% year-over-year in the U.S., Europe and Japan, respectively.
Investment is a necessary precondition for lifting productivity. The McKinsey Global Institute finds that a change in investment10 explains 80% of productivity gains from 1997 to 2022. With investment rising as fiscal faucets are loosened and firms are scrambling to assert technology leadership, we see growth supported and increasingly dictated by capital deepening11 and total factor productivity (TFP).12 Even then, our productivity forecasts13 are more measured than OECD estimates.14
Higher overall growth can partially offset unequal distribution of economic gains across capital and labor, but it cannot entirely mitigate the division that fuels economic nationalist tendencies. These spending forces will influence both demand and potential supply. How this nets out will determine inflation. On average over our forecast horizon, we expect supply to keep pace and therefore inflation to remain in check, and are forecasting a global rate of 2.6%. However, we anticipate periods of supply-demand mismatch and therefore episodes of choppy inflation along the way, particularly in higher deficit nations such as the U.S. and the UK.
10 Jan Mischke, Chris Bradley, Marc Canal et al., “Investing in productivity growth,” McKinsey Global Institute, March 27, 2024.
11 Capital deepening refers to an increase in the amount of capital per worker, which raises labor productivity.
12 Total factor productivity is the share of output growth not explained by growth in labor and capital inputs, capturing efficiency gains from technology, innovation and better organization of production.
13 David Kelly, Karen Ward, Stephanie Aliaga et al., “Macroeconomic assumptions: AI leaders pull ahead, and inflation paths diverge,” 2027 Long-Term Capital Market Assumptions, J.P. Morgan Asset Management, October 2026
14 Francesco Filippucci et al., “Macroeconomic productivity gains from Artificial Intelligence in G7 economies,” OECD Artificial Intelligence Papers, No. 41, OECD Publishing, June 2025.
Economic nationalism: The good, the bad and the dangerous
This year, we dive deeper into our first theme, economic nationalism, which we have discussed in prior editions. It is a response to growing concerns over security and resilience. Economic nationalism is also a consequence of inequality15 and political polarization, creating fertile ground that more-extreme political opportunists can exploit.
Economic nationalism can be a headwind to growth, yet some aspects are certainly good housekeeping. Developing an industrial strategy can create strategic advantages, as we explore in our article on how climate change affects trend growth.16 Improving supply chains, energy security and defense can boost investment and near-term growth. Nevertheless, such spending may demand trade-offs between economic efficiency and resiliency.17
Even where intent is benign, spending driven by an agenda shaped by economic nationalism carries the risk that the investment fails to translate into productivity gains or that it crowds out other useful investments. At the more extreme end of policy choices, restrictions on trade and labor migration can directly suppress growth. On balance, we see economic nationalism as a modest growth risk but a greater risk to inflation.
In this year’s Long-Term Capital Market Assumptions, cash return forecasts are mostly stable. Meanwhile, our projection of modestly steeper curves at equilibrium, together with higher starting yields, pushes up bond return forecasts sharply, leading to global sovereign bonds offering the best return forecasts in two decades (Exhibit 2).
Many governments face high debt and persistent deficits. By contrast, corporations are often cash rich and, in public credit markets at least, quite savvy in their debt management. In short, sovereigns are perhaps not as risk free as they once were, while corporations have a shareholder return incentive to service debt responsibly. This “up in quality” trend leads us to tighten our equilibrium credit spread assumptions. While prevailing spreads are tighter than our cycle-neutral forecasts, our projections for credit returns generally keep pace with equivalent sovereign forecasts.
Global bond returns are up sharply, given higher starting yields and upgrades to trend growth forecasts
Exhibit 2: Fixed income returns
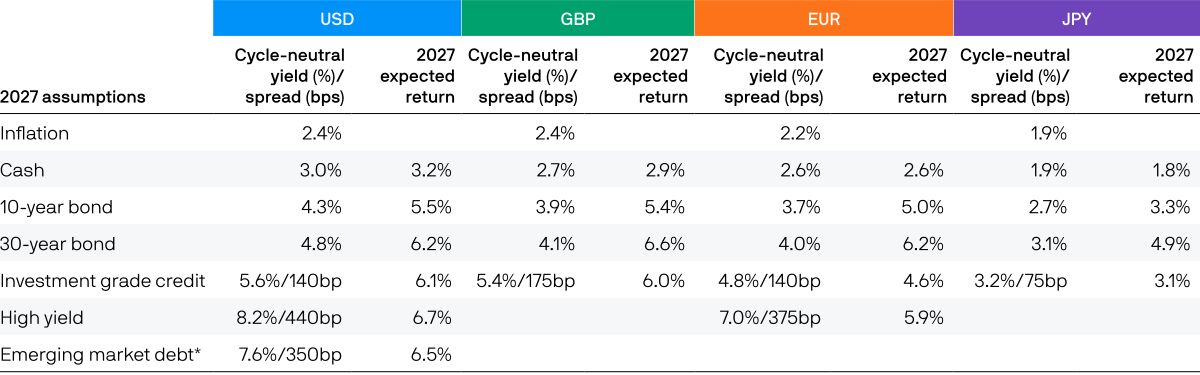
Source: J.P. Morgan Asset Management; estimates as of September 30, 2026. EUR: 15y+ index; JPY: JGB Bond Index; GBP: 15y+ index; USD: 20y+ index. * EMD = hard currency debt.
15 Dani Rodrik, “Populism and the economics of globalization,” Journal of International Business Policy, 2018
16 See Thulliez, Bilton, Craig, “Who bears the cost? The evolvong economics of climate change.”
17 Shekhar Aiyar, Jiaqian Chen, Christian Ebeke et al., “Geoeconomic Fragmentation and the Future of Multilateralism,” IMF Staff Discussion Note SDN/2023/001, January 2023. This paper estimates the long-term cost of trade fragmentation at up to 7% of global GDP.
Technology adoption: Capex supernova
If economic nationalism creates crosscurrents for our economic vessel, then technology adoption is the fair wind filling its sails. We believe that AI adoption is in its early stages, but the promise of what might be possible has grown dramatically in just a few years. A historic USD 15 trillion investment boom is underway as firms seek an advantage along a fast-moving frontier. Yet we are just starting to glimpse the economy-wide potential of AI. While only 6% of U.S. work hours are AI-assisted today, we expect AI adoption to reach 40% of today’s tasks by 2040.18
AI adoption is following a contour familiar from prior innovation cycles.¹⁹ Initially, innovators capture supernormal profits and invest to build scale. Then other sectors jump in; only later are rewards shared more broadly as investments become embedded into business processes. The transition from the early to later phases is often bumpy. But over the full cycle, we see AI providing an upside risk to trend growth sufficient to more than outweigh the negative impact on labor force growth that comes from population aging and hostility to migration.
AI capex has boosted profits in regions with large technology sectors, notably the U.S., Korea and Taiwan. Over our full investment horizon, tech sector profit growth will likely moderate from current levels. But as productivity gains materialize, earnings in other sectors should rise. Korean and Taiwanese indices are dominated by cyclical technology sectors (chipmakers). Even if this tech cycle proves more durable than past ones, eventual normalization of cyclical tech profits weighs on aggregate margins, as other sectors are too small to provide an offset. Since Korea and Taiwan account for 51% of the emerging market (EM) index, our EM equity 10- 15 year forecast falls below developed markets for the first time in our publication’s history (Exhibit 3).
Developed market equity returns are higher this year, supported by margins and the investment cycle, but high cyclical margins in Korea and Taiwan bring down emerging market returns
Exhibit 3: Equity return forecasts 2026 vs. 2027
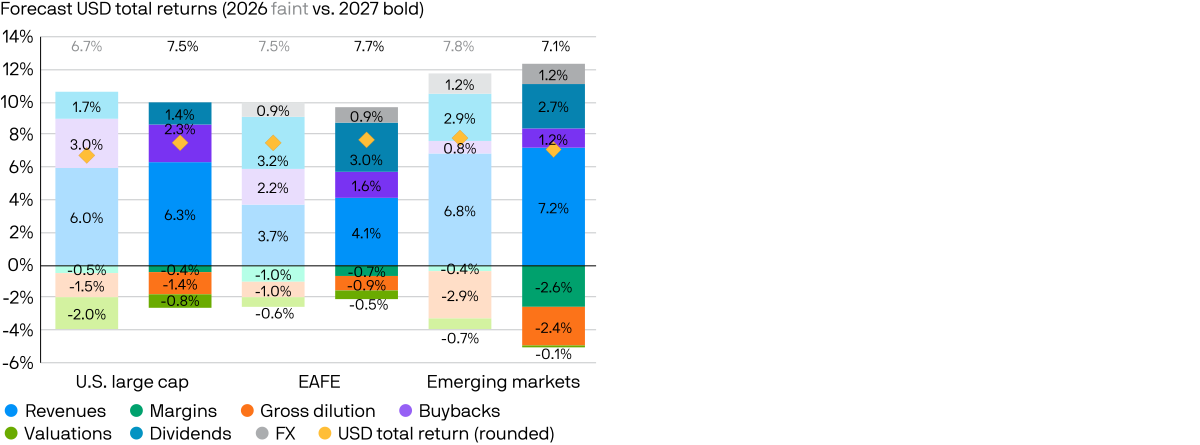
Source: Bloomberg, International Monetary Fund World Economic Outlook April 2026, J.P. Morgan Asset Management; data as of September 2026.
Note: Due to rounding, components may not precisely sum to the rounded total return.
By contrast, the U.S. is more balanced across defensive and cyclical technology sectors, and is well diversified beyond tech. So even as tech profits normalize, we expect profits in other sectors to counteract the decline, resulting in greater aggregate margin resilience. U.S. firms also have a strong record of turning capex into returns: U.S. RoIC over the last decade averages around 17%, vs. low-teens in Europe and Japan. The result is a sizable uplift to our U.S. equity forecast, and the U.S. vs. rest of world (RoW) return differential swings in favor of the U.S., from -70bps last year to +10bps in this year’s edition.
The technology cycle also widens the opportunity set for private equity (PE) funds, partially offsetting the drag from dry powder20 and the still-challenging exit backdrop. Adoption of AI and automation is reshaping cost structures and competitive moats, in turn creating clearer dispersion between winners and losers. Together with growing competition for capital and a pipeline of dynamic innovation, these factors support the alpha share of total returns in large cap private equity – even as higher financing costs trim large cap private equity median manager returns by 60bps, to 9.6%.
Aside from PE, investment in the ecosystem enabling AI (compute, power, cooling, fiber and data centers) also supports returns across infrastructure, as well as in the communications and data-exposed segments of real estate (Exhibit 4).
Solid growth supports our return expectations for alternative assets, but manager selection remains key
Exhibit 4: LTCMA expected returns (leveraged,* net of fees, %), 2027 vs. 2026
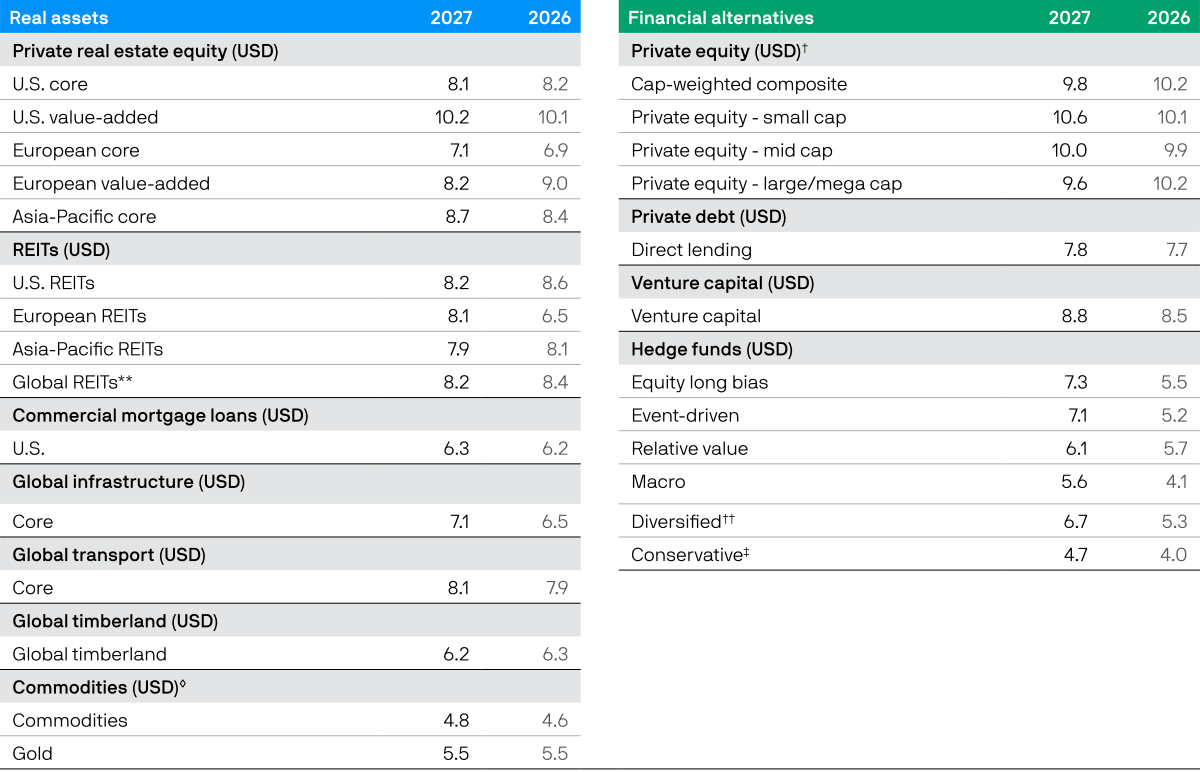
Source: J.P. Morgan Asset Management; estimates as of September 30, 2025, and September 30, 2026.
* All return assumptions incorporate leverage, except for commodities, where it does not apply.
** The global composite is built assuming the following weights: roughly 70% U.S., 10% Europe and 20% Asia-Pacific.
◊ The 2026 commodity projections do not account for execution/management fees consistent with a passive benchmark.
† The private equity composite is AUM-weighted: 65% large cap and mega cap, 25% mid cap and 10% small cap. Capitalization size categories refer to the size of the asset pool, which has a direct correlation to the size of companies acquired, except in the case of mega cap.
†† The Diversified assumption represents the projected return for multi-strategy hedge funds.
‡ The Conservative assumption represents the projected return for multi-strategy hedge funds that seek to achieve consistent returns and low overall portfolio volatility by primarily investing in lower volatility strategies such as equity market neutral and fixed income arbitrage. The 2026 Conservative assumption uses a 0.70 beta to Diversified.
18 Share of U.S. work hours assisted by generative AI as of 2Q 2026. Source: Alexander Bick, Adam Blandin and David Deming, Generative AI Adoption Tracker, Real-Time Population Survey; Federal Reserve Bank of St. Louis. The 2040 projection is a J.P. Morgan Asset Management estimate; see Stephanie Aliaga, Madison Faller, David Kelly et al., “A brighter productivity outlook for the AI era,” 2027 Long-Term Capital Market Assumptions, J.P. Morgan Asset Management, October 2026.
19 Carlota Perez, Technological Revolutions and Financial Capital: The Dynamics of Bubbles and Golden Ages, Edward Elgar, 2002.
20 Global buyout dry powder stands at USD 1.3 trillion, the majority raised in 2022–23 fund vintages. Source: Bain & Company, Global Private Equity Report 2026.
Capital rewiring: Nudge, nudge; wink, shove
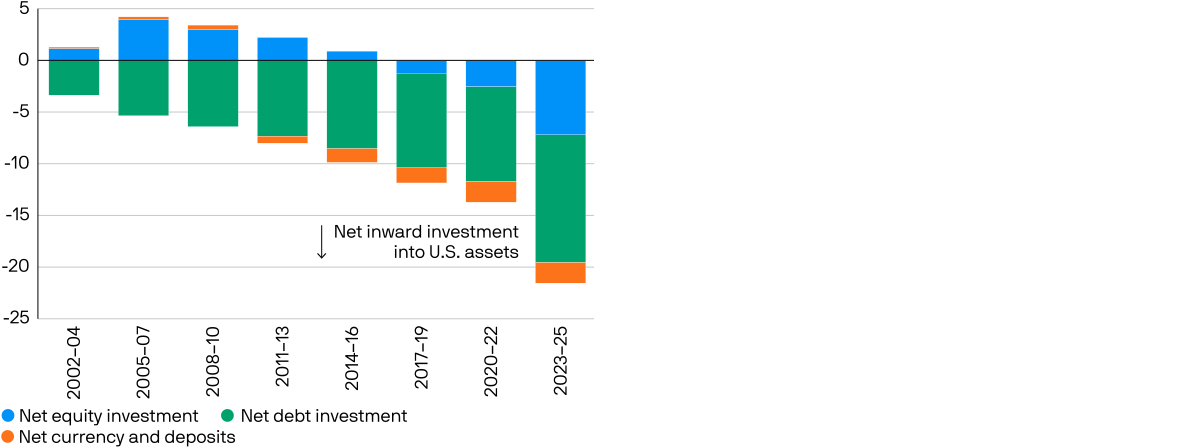
Capital allocation is ultimately the rudder that steers our economic vessel. Since 2000, global savings balances21 have grown from USD 9 trillion to USD 29 trillion – in real terms, a 70% increase over 25 years; nominal pension balances22 have quadrupled, from USD 15 trillion to USD 62 trillion; and the U.S. net international investment position (NIIP)23 had swelled to USD 22.4 trillion (a net liability) by the end of 2Q 2026 (Exhibit 5).
In the last 25 years, the U.S. net international investment position has totaled USD 22.4 trillion, much of it in bonds
Exhibit 5: U.S. net international investment position last 25 years, sequential 3-year cumulative net periods
Source: Bloomberg, Bureau of Economic Analysis, J.P. Morgan Asset Management; data as of December 31, 2025. Equity and debt investments include funds.
While we do not expect this balance to reverse, with global yields having normalized post-pandemic there is simply more competition for excess capital.
As economies such as Germany deploy more of their capital at home to improve their economic resilience, this reduces the amount of excess savings seeking a home globally, with important implications for global capital flows.
Governments may also be tempted to encourage domestic capital to support domestic growth. Reforms aimed at channeling pension savings into domestic investments is one such example of a trend that could become increasingly forceful in the years ahead.
Reserve allocation24 is another key feature and a material driver of currency markets. Despite the chatter in the media, we see limited evidence of any “sell America” trends.25 Were any challenge to U.S. exceptionalism to materialize, we believe it would impact bond and FX markets far more than U.S. stocks. Simply put, as governments globally unlock domestic savings to finance local growth, marginal investment flows may be distributed more globally than in the last 15 years, when the U.S. disproportionately benefited from global capital flows.
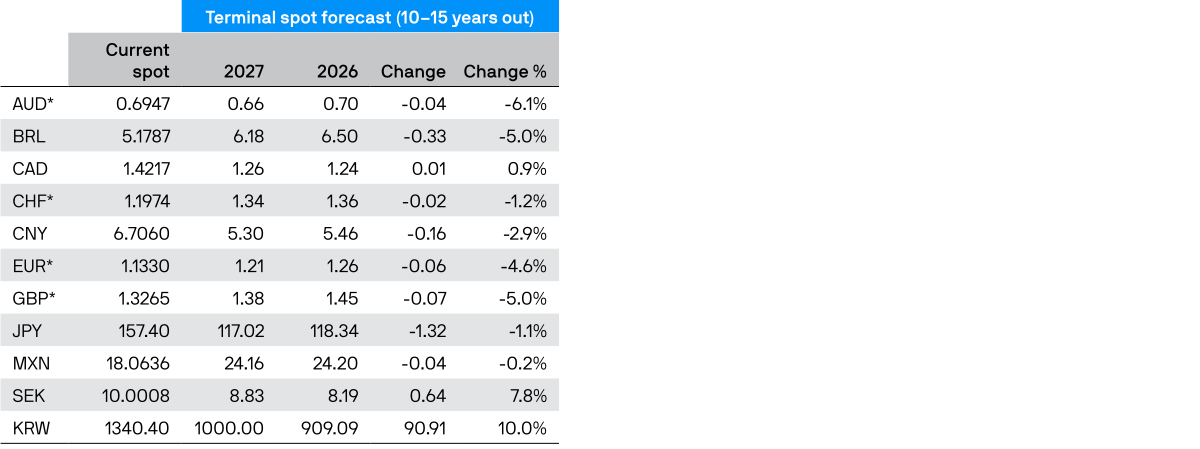
High deficits, economic nationalism and shifts in global capital flows all point to a further decline in the trade-weighted dollar. But as expected inflation gaps between the U.S. and Europe narrow, the fair value for European crosses has fallen. By contrast, cheap valuations in Asian currencies and still-wide inflation differentials vs. the U.S. suggest that further declines in the trade-weighted dollar will be driven mainly by the South Korean won, Japanese yen and Chinese yuan (Exhibit 6).
Asian currencies remain heavily undervalued vs. USD, while European crosses are now much closer to fair value
Exhibit 6: Key 2027 LTCMA currency assumptions
Source: J.P. Morgan Asset Management; estimates as of September 30, 2025, and September 30, 2026. * USD as base currency except where indicated (*).
In the same way that a cheaper USD doesn’t diminish the currency’s reserve status, the suggestion that broader currency debasement will precipitate a rush into crypto assets is also wide of the mark. The volatility and unstable correlation of assets like bitcoin (BTC) remain an obstacle to their widespread inclusion in portfolios. Nevertheless, we initiate a long-term return forecast for BTC this year while stopping short of its full inclusion in our covariance matrices. Instead, we provide a separate, smaller covariance matrix with BTC against a subset of assets in our public markets chapter.
In sum, capital rewiring may be the least immediately observable of the three themes shaping markets over the next 10 to 15 years, but for investors and asset allocators, it may well have the greatest impact on relative asset returns.
22 Gross national savings aggregated across countries in current U.S. dollars, 2000–25; real terms deflated by U.S. CPI. Source: International Monetary Fund World Economic Outlook database, J.P. Morgan Asset Management.
23 Assets managed by pension providers in OECD countries, end-2001 to end-2024. Source: OECD, Pension Markets in Focus 2025.
24 The NIIP is the difference between U.S. residents’ foreign financial assets and their liabilities to foreign residents. It stood at –USD 22.4 trillion at end-2Q 2026. Source: Bureau of Economic Analysis, September 24, 2026.
25 The U.S. dollar accounted for 57.2% of allocated official foreign exchange reserves in 1Q 2026, vs. 20.0% for the euro and 2.0% for the renminbi. Source: International Monetary Fund, Currency Composition of Official Foreign Exchange Reserves (COFER); data as of 1Q 2026.
26 Foreign holdings of U.S. assets rose to USD 69.4 trillion at end-2Q 2026, led by portfolio investment, and net financial flows showed USD 370 billion of net foreign investment into the U.S. in the quarter. Source: Bureau of Economic Analysis, September 24, 2026.
Asset allocation: Fair winds, choppy waters
Our upbeat growth outlook may seem at odds with today’s flood of global headlines. Still, we’re constructive on returns despite the later-cycle turbulence. The key is building a resilient portfolio.
We examine the rationale for upgrading productivity forecasts and margins in the macro and public markets chapters. Still, we recognize the inherent uncertainty involved in adopting a disruptive innovation and in translating a burgeoning investment cycle into real and durable economic gains. We also acknowledge that valuations offer little cushion and that capex cycles often take a volatile final turn.
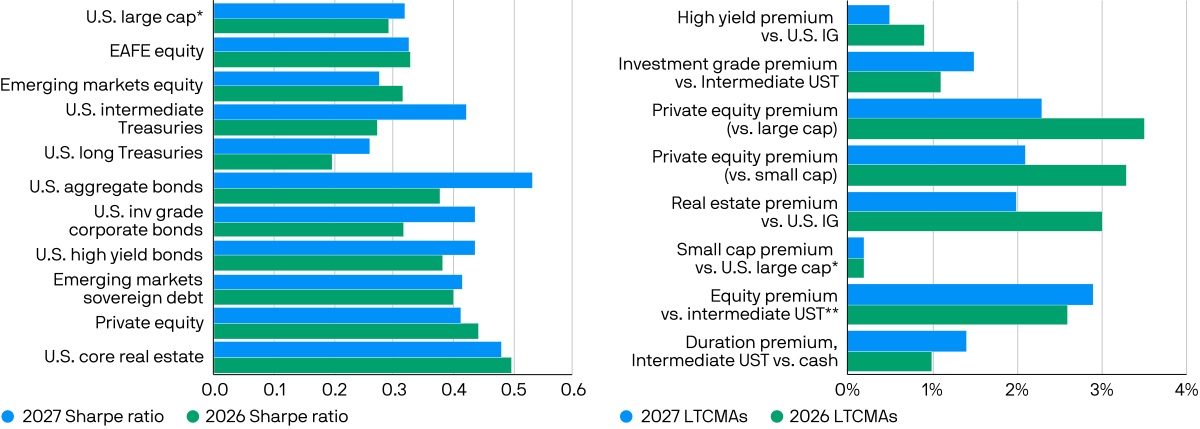
So alongside upgrading our return forecasts, we raise our volatility projections, notably in equities. Sharpe ratios are up for U.S. large cap equity, flat for EAFE and down for EM equity, where extreme cyclical margin expansion has effectively borrowed a lot from future returns (Exhibits 7A and 7B).
As a result, the relative Sharpe ratios between public and private assets tilt in favor of real assets. This reflects our economic narrative of increased competition for capital and higher inflation volatility: Alternative assets with inflation resilience, capacity for alpha capture and low correlation to public markets are an essential part of portfolios in the world we envision.
Hedge funds are winners from this new world. The higher yields we expect provide a boost to hedge funds via the carry collected on their short positions. As governments look for new ways to fund growth and pools of capital open up, opportunities for uncorrelated alpha, which hedge funds are positioned to capture, increase sharply. These supportive factors, together with improvements to our forecasting methodology, push our diversified hedge fund median manager returns up 140bps, to 6.7%, this year – with dispersion across funds offering further rewards from manager selection.
Without question, there are risks. Strong asset returns in 2026 may imply calm waters, but our themes of economic nationalism, tech adoption and capital rewiring create potent undercurrents. Our outlook implicitly projects a continuation of the K-shaped economy, which doubtless creates social (and moral) issues that policymakers must grapple with.
Risk-adjusted returns for sovereign bonds improve, given higher starting yields and steeper curves. But Sharpe ratios for equities are little changed overall while Sharpe ratios for real assets remain strong.
Exhibit 7A: Sharpe ratios Exhibit 7B: Return uplift (premia)
Source: J.P. Morgan Asset Management; data as of September 30, 2026.
Note: Sharpe ratio calculated from forecast asset arithmetic return less cash arithmetic return divided by volatility.
* U.S. small cap forecast return less U.S. large cap forecast return
** Forecast uplift in returns of U.S. large cap equity vs. U.S. intermediate (1-10 year) Treasury index
The greatest risk to our outlook is a miscalculation of the balance between the upper and lower legs of the K. Underappreciating the needs of the labor pool could destabilize the system. Equally, overzealous attempts to redistribute returns from capital to labor could disincentivize investment. While we expect the metastable equilibrium of the K-shaped economy to persist, factors that push the balance of rewards between capital and labor too far in either direction could cause bouts of volatility.
Other risks to our constructive outlook include restrictions on the flow of capital and widespread capital misallocation. Economic nationalism today affects labor and trade, but it has left capital flows largely untouched. Should this change, investment-led growth would surely suffer. Meanwhile, if today’s investment boom fails to boost productivity, the net effect would be lower trend growth and excess capacity that raises the risk of disinflation.
There are topside risks as well. Past innovation cycles have led to meaningful improvements in living standards. If that recurs, it might restrain some of the most damaging instincts of populism. And as AI adoption spreads, its impact can compound when it combines with other, possibly more mundane, inventions in business supply chains, creating further upside potential for corporate profits.
Portfolios: More return, more risk, a lot more opportunity
Over our 10- to 15-year investment horizon, we believe that investors can capitalize on the fair winds of solid growth and favorable asset returns while navigating the undercurrents of economic nationalism, tech adoption and capital rewiring.
In portfolios, this calls for balance and robustness. It also demands willingness to use a broad investment opportunity set. A strong margin outlook reinforces the case for U.S. equities in portfolios despite concerns over valuation and sector concentration. Still, regional diversification is essential.
Diversification with EM equities is compromised by stretched cyclical margins, which weigh heavily on return forecasts. Increasingly, however, developed market equities offer diversification options, particularly in Europe and Japan, where rising capex and investment are improving the growth outlook.
High quality bonds reflect much of the inflation volatility we anticipate in current yields. Should growth undershoot our projections, we see upside to our bond return forecasts. This in turn implies diversification potential to stocks, even allowing for positive stock-bond correlation driven by a volatile inflation environment.
A balanced stock-bond portfolio is an attractive starting point. But to navigate the themes in play, as well as uncertainty around the investment cycle and policy, alternatives can play a vital role in portfolios.
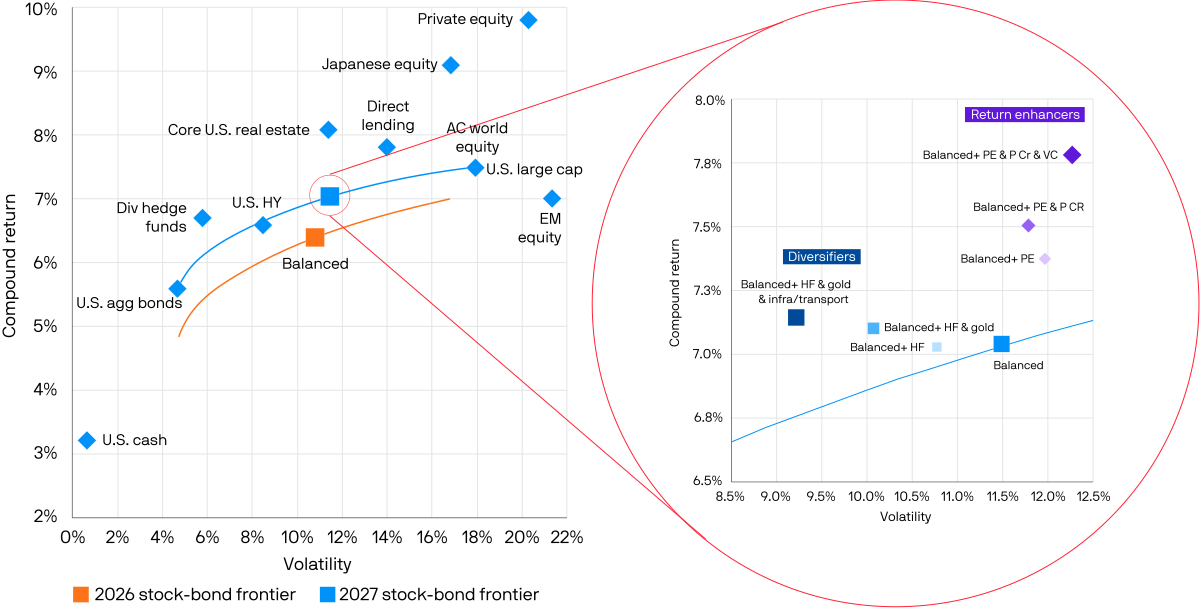
Alternatives can serve as return enhancers – adding 30% of a blend of private equity, venture capital and direct lending can boost balanced portfolio returns by 80bps and the Sharpe ratio by 11%. Alternatives can also serve as diversifiers – adding 30% of a blend of diversified hedge funds, gold, infrastructure and transportation boosts the balanced portfolio Sharpe ratio by 22% while maintaining portfolio returns (Exhibits 8A and 8B). Other alternative assets, such as real estate, can serve both to diversify and to enhance returns, given that our global core real estate forecast sits at 7.9% while global value-added real estate is at 9.3%.
Investing in a volatile world shaped by the three powerful themes we have discussed can be daunting (Exhibit 9). Focusing too much on the prevailing news cycle is distracting, but thoughtful asset allocation can keep the impulse in check. And when events heat up, a robust and diversified portfolio allows us to ask calmly: Has anything changed other than the price?
As the USD stock-bond frontier moves higher, expected returns for a balanced portfolio increase to 7.0%. Adding alternatives – as return enhancers or diversifiers – can meaningfully boost risk-adjusted returns.
Exhibit 8A: USD stock-bond frontiers and balanced portfolios based on 2027 vs. 2026 LTCMAs for risk and return (%)
Exhibit 8B: USD stock-bond frontier and balanced portfolio with a 30% allocation to alternatives based on 2027 vs. 2026 LTCMAs for risk and return (%)
Source: J.P. Morgan Asset Management; data as of September 30, 2026.
Note: Balanced refers to 60% ACWI equity/40% Bloomberg US Aggregate bonds. Diversifiers: Balanced + hedge funds = 54/36/10 stock/bond/diversified hedge funds; Balanced + hedge funds & gold = 48/32/10/10 stock/bond/diversified hedge funds/gold; Balanced + hedge funds & gold & transport/ infrastructure = 42/28/10/10/5/5 stock/bond/diversified hedge funds/gold/global transport/global infrastructure. Return enhancers: Balanced + private equity = 54/36/10 stock/bond/private equity; Balanced + private equity & private credit = 48/32/10/10 stock/bond/private equity/private credit; Balanced + private equity & private credit & venture capital = 42/28/10/10/10 stock/bond/private equity/private credit/venture capital.
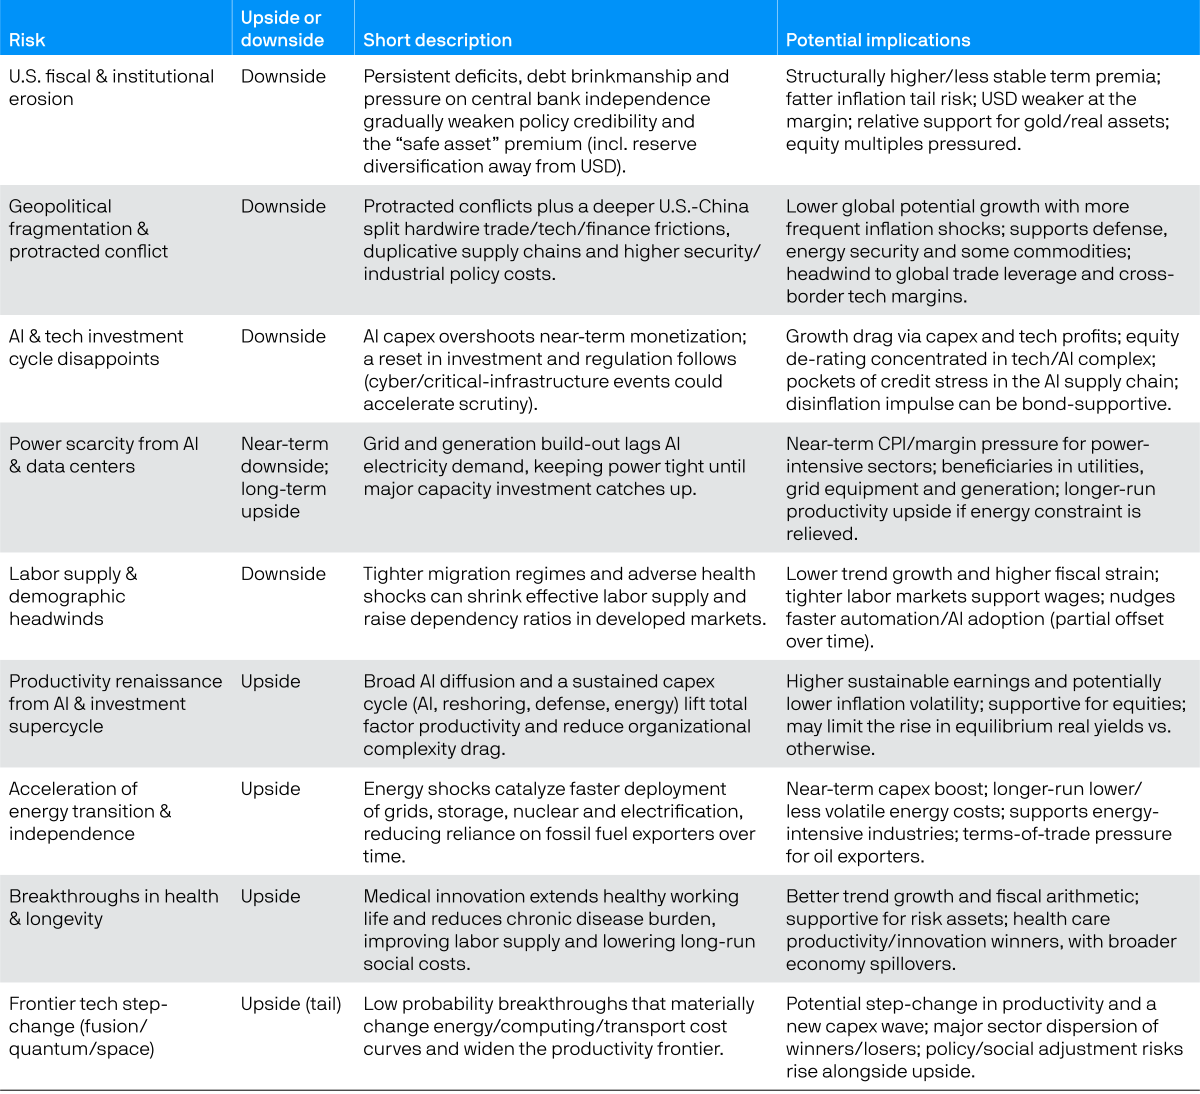
There are two-sided risks to our constructive view, many of which are captured by increased volatility forecasts for inflation and some assets
Exhibit 9: Key structural risks affecting our long-term forecasts and asset return assumptions
Source: J.P. Morgan Asset Management; data as of September 2026.
Topics
Matrices
Our expectations for returns, volatilities and correlations. Use our interactive version to download the excel in your chosen currency.
The assumptions are not designed to inform short term tactical allocation decisions. Our assumptions process is carefully calibrated and constructed to aid investors with strategic asset allocation or policy-level decisions over a 10- to 15-year investment horizon.
Download Excel and PDF matrices by currency
Assumptions
Examine our return projections by major asset class and the thinking behind the numbers.
Long-Term Capital Market Assumptions: Methodology Handbook
A companion volume to dive deeper into our LTCMAs’ building blocks
Macroeconomic Assumptions
AI leaders pull ahead, and inflation paths diverge
The scale of AI’s boost to total factor productivity varies widely
AI contribution to TFP
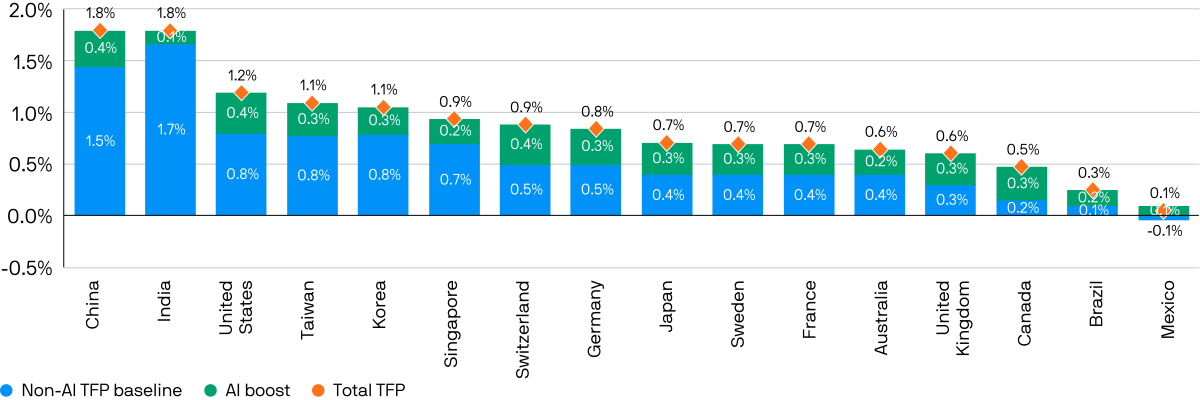
Source: J.P. Morgan Asset Management; data as of September 30, 2026. The non-AI TFP baseline is each economy’s assumed trend productivity growth before any AI contribution.
Public markets assumptions
Strong but uneven returns in a changing world
A balanced portfolio earns a respectable return over the next 10 to 15 years
Public market return assumption changes vs. prior edition of LTCMA
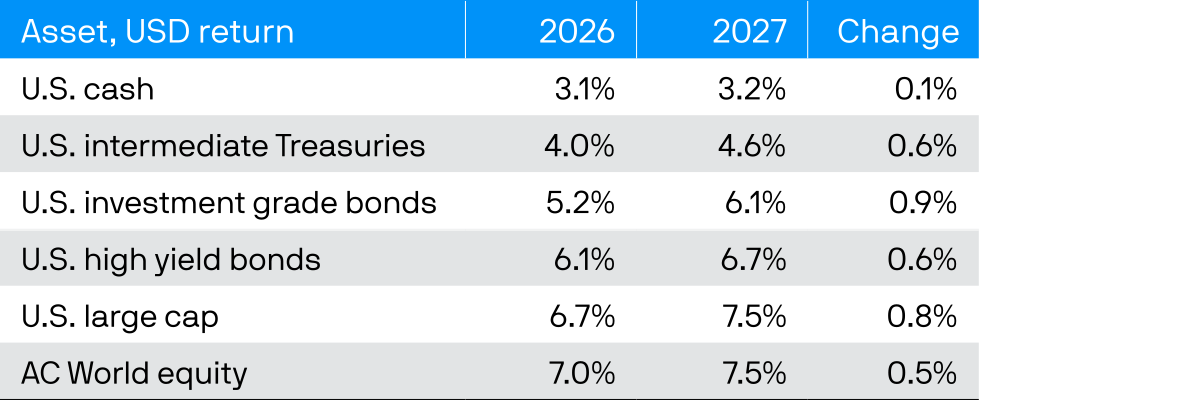
Source: J.P. Morgan Asset Management; data as of September 30, 2026.
Private markets and alternative asset assumptions
New forces lift private markets; greater dispersion offers alpha
Rising alpha estimates across financial alternatives will be matched by an increase in performance dispersion
Financial alternatives’ expected returns and drivers
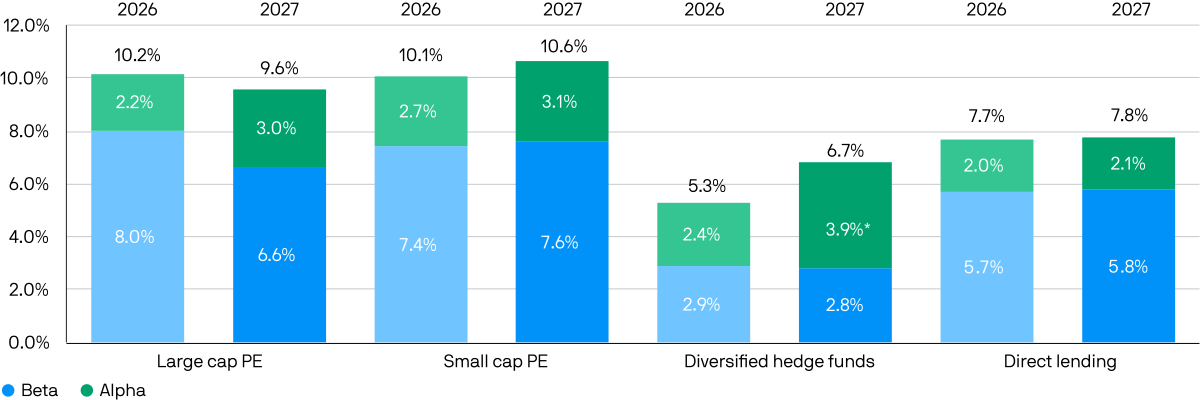
Source: J.P. Morgan Asset Management; data as of September 30, 2026. Alpha is defined as the intercept (or, in the case of private equity, the sum of the intercepts), except for direct lending, where alpha is defined as the excess return over the expected leveraged loan spread.
* The alpha boost seen in hedge fund returns comes in part from methodology enhancements this year.
Portfolio Implications Assumptions
How intentional thematic exposure can build portfolio resilience
Relative winners and losers vary across themes
Asset market impacts of themes
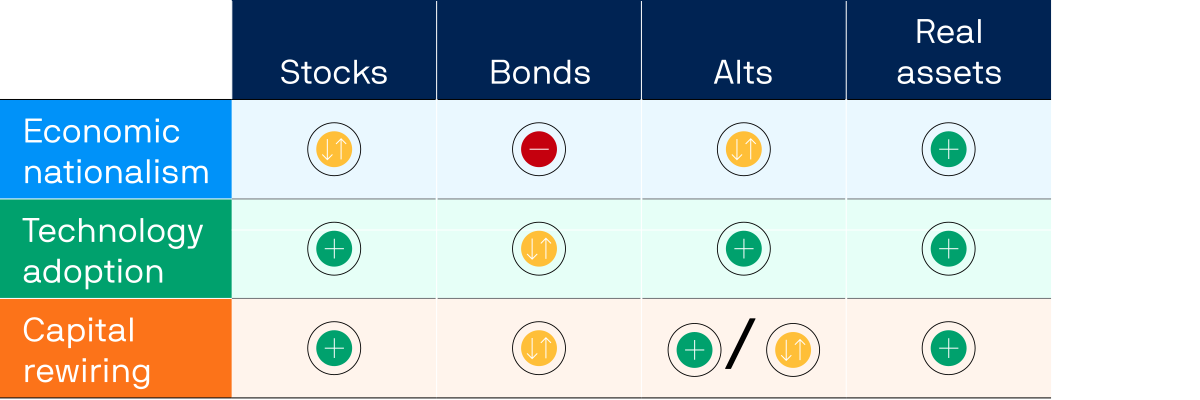
Source: J.P. Morgan Asset Management; data as of September 30, 2026.
Download this year's Long Term Capital Market Assumptions report

Frequently asked questions
J.P. Morgan Asset Management’s annual LTCMAs provide return, risk and correlation forecasts for more than 200 major asset classes in 20-plus base currencies, over a 10- to 15-year horizon. Our LTCMAs represent the work of more than 90 of our researchers, portfolio managers and economists worldwide, using a process refined over 31 years. A publication expands on the data, analyzing trends and themes.
Designed to help pave the way to stronger portfolios, these forecasts drive J.P. Morgan Asset Management’s strategic asset allocations and power the tools we use to advise clients. They help asset allocators, financial advisors and others build portfolios, evaluate trade-offs and stress-test performance against objectives, in pursuit of their long-term goals.
We center the 2027 edition on three forces with durable implications: Economic nationalism (governments’ more domestically oriented posture); faster diffusion of technological innovation (tech adoption) and the reconfiguration of how and where public and private funds are deployed (capital rewiring). These reshape returns’ level and dispersion across regions, sectors and asset classes. With a global capex boom, they support higher growth while creating more inflation volatility.
Resilient economies support resilient markets, but with wider outcomes – raising the rewards for thoughtful diversification.
We forecast a rise in long-term returns from a balanced-plus portfolio – including alternative assets. We expect faster economic growth to boost profits and yields, lifting a balanced portfolio’s long-run returns from last year’s forecast. In equities, U.S. profit margins are more resilient than emerging markets’. In fixed income, higher real yields improve the case for government bonds, while an “up in quality” mindset and tighter spread assumptions improve our corporate credit forecast.
Higher inflation volatility, ongoing risk of currency debasement and growing opportunities to capture active alpha reinforce alternatives as essential diversifiers and potential return drivers.
We believe AI will drive a meaningful, durable uplift to productivity over 10 to 15 years. Improved productivity is the main force returning U.S. GDP growth to a faster pace over a decade. AI diffusion and the resulting productivity boost will likely be gradual, most significant in the 2030s and beyond. This is vital to our 2027 forecast. Steady uptake should limit rapid, economy-wide job displacement while giving supply chains time to adapt.
For more than three decades, we’ve gathered 90-plus industry-leading portfolio managers, economists and research analysts on three continents, led by John Bilton, Global Head of Strategic Research, Multi-Asset Solutions. Authors and leadership team members include Dr. David Kelly, Chief Global Strategist; Karen Ward, Chief Market Strategist in EMEA; Tai Hui, Chief Market Strategist in Asia; Gabriela Santos, Chief Market Strategist for the Americas, Pulkit Sharma, Head of Alternatives Investment Strategy & Solutions and David Lebovitz, Head of Alternatives Research and Strategy.
Be the first to get additional resources and insights from our team
Share your details and we’ll keep you updated as new insights and resources are released.
5d2b6d47-c36b-11f1-a9f3-b739b8ec6d9e