
While the pace and magnitude of rate cuts in 2024 remain uncertain, we are almost certainly at the end of the hiking cycle.
In brief
- We take the past seven rate cut cycles as reference to observe patterns relating to ISM manufacturing PMI, real policy rates, unemployment rate and financial conditions during the Fed’s first cuts, concluding that some indicators are more useful than others. While a qualitative overlay is needed to assess each case, these observations are helpful to frame our expectations of Fed policy in 2024.
- While the pace and magnitude of rate cuts in 2024 remain uncertain, we are almost certainly at the end of the hiking cycle. Based on history, a Fed pivot has brought constructive returns for risk assets. This backdrop, in addition to a soft landing outcome, is a favorable environment for equities and credit.
Market focus on the U.S. Federal Reserve (Fed) has shifted from the peak of policy rates to the next phase of the policy rate cycle, namely the cuts. The market is arguably more dovish than the Fed in both the timing of the first rate cut and over the magnitude of policy rate reduction for 2024. Instead of taking either side’s view for granted, we thought it is worth looking at the history of monetary easing. Each rate cut cycle is different, but we can still observe some patterns and map that to today’s economic environment and policy considerations.
We look at Institute for Supply Management (ISM) Manufacturing Purchasing Managers' Index (PMI), real policy rates, unemployment rate and financial conditions at the time of the first rate cuts since 1989. We note that some indicators are more useful than others. The current economic data suggests the Fed would be cutting rates to prevent excessively tight monetary policy, instead of reacting to a much more dramatic recession or financial crisis. These indicators also suggest there is no urgency for the Fed to act immediately, but instead have a few months to read the economy before pulling the trigger.
What happened during past Fed cutting cycles?
As the Fed only started to target the Fed Funds rate in late 1980s, the following table captures the rate cute periods starting with the 1989 cuts prior to the Gulf Recession.
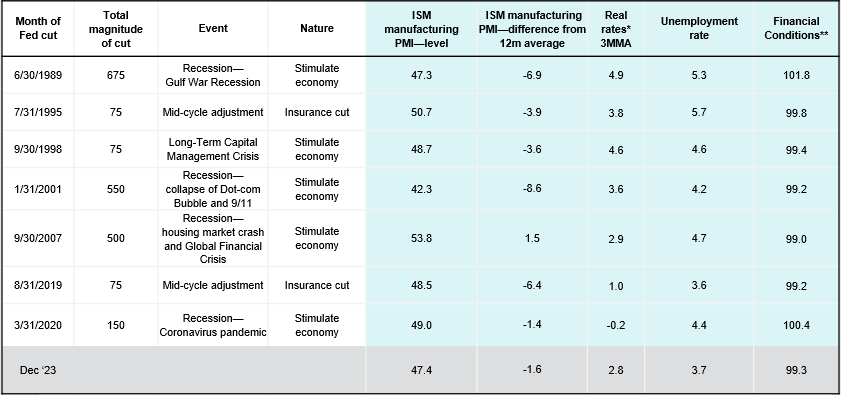
Source: FactSet, JP Morgan Asset Management. *Real rates are measured as Fed Funds rate minus headline Personal Consumption Expenditure (PCE) inflation rate. **Financial conditions are measured by the Goldman Sachs financial conditions index.
Which indicators are relevant?
Economic growth and prices are perhaps the two most important considerations for the Fed.
1) ISM Manufacturing PMI
For growth, we have chosen the ISM manufacturing index, a monthly survey that is calibrated to reflect growth momentum. Although the level of manufacturing PMI during the Fed’s first cuts were not significantly weak (average of 48.6), it is likely the magnitude of the drop in the index, and the associated loss in growth momentum that worried the Fed. In fact, we found that during the Fed’s first cuts, manufacturing PMI was on average 4.2 points lower than the past 12 months’ (12m) average.
Were there false positives? This means the indicator could have foretold rate cuts but the Fed failed to deliver. In the 420 months between 1989-2023, only in 14 months (3.3% of the time) did we see ISM manufacturing index more than 4.2 points below its 12m average, but there was no Fed cut 6 months before or after. Within those 14 months, 10 of those occurred over the current hiking cycle—when manufacturing PMI declined from a peak of 60.8 in late-2021 to a bottom of 46.0 mid-2023. This dramatic decline did not trigger the Fed to cut given high inflation and low jobless rate. The latest December ‘23 manufacturing PMI reading is already 0.2 higher than the 12m average, meaning manufacturing weakness has likely bottomed out. There are a few observations from this—1) taking out the current cycle, the decline in PMI from 12m average is a useful indicator of Fed cuts; 2) This indicator needs to be accompanied by qualitative assessment of the economy. The Fed did not act despite sharp drop in manufacturing momentum because the U.S. service sector was booming and inflation pressure was still high.
2) Real rates
As for price levels, given the different interest rate and inflation regimes in the past three decades, we have chosen to look at a relative measure—real rates (measured as the difference between nominal fed funds rate and PCE headline year-over-year inflation).
Apart from ultra-low rates regime post-GFC (post-great-financial-crisis), we can observe that the Fed cuts almost every time when 3 month moving average (3MMA) of real rates rises to 3-4%. This is likely the point where the Fed deems real interest rates to be too high. The Fed’s latest dot plot projects a long-term nominal terminal rate of 2.5% and PCE inflation of 2.0%, putting the Fed’s target real rate for the long term at 0.5% going forward. Since the cooling of inflation, this measure has been rising to 2.8% as of December ’23, nearing the 3-4% range where the Fed historically cuts.
Which indicators are not as relevant?
1) Unemployment
Full employment is one of the Fed’s policy objectives. Historically, the Fed often cuts before unemployment rate rose substantially, with an overall average level of 4.6%.
This is likely due to two reasons—1) the lagged effects of job cuts when heading into a slowdown; 2) unemployment rate often spikes much quicker than its descent down, meaning the Fed often needs to pre-empt the spike in unemployment before it’s too late. A similar trend can be observed using initial or continuing jobless claims as well as non-farm payroll employment changes—the Fed often cuts before a material weakening in labor market data.
Thus, currently, while the Fed is indeed waiting for the softening of an unusually hot labor market, it likely will only require preliminary signs of weakening, instead of significant deterioration, for the Fed to start cutting. Still, other than 2019, unemployment rate was at least 4%, if not substantially higher, when the Fed decided to start the rate cut cycle. We might need to wait for jobless rate to rise more before the Fed feels the urgency to act, especially when full employment fuels wage growth.
2) Financial conditions
As for financial conditions, it might be surprising to observe that five out of seven times, the Fed made the first cut when financial conditions was on a loosening trend. Using the Goldman Sachs financial conditions index (GSFCI), the average level at past first cuts was 99.85, which is slightly below the period average (in 1989-2023) of 100.1.
The tightness in financial conditions is certainly a consideration for the Fed when deciding on monetary policy, but movements in the financial condition index is easily influenced by market expectations of Fed’s action ahead of time, for example, 10-year Treasury yields often starts to come off before the Fed actually cuts. Thus, there is no clear pattern in where financial conditions should be for the Fed to cut, which also means that the recent loosening of conditions (e.g. the GSFCI is at its loosest since August 2022) is likely only a small deterrent for the Fed to cut.
Investment implications
While real policy rate has moved towards a level consistent with Fed policy loosening, ISM manufacturing index or unemployment rate does not show there is an urgent need to cut rates in the very near future. Moreover, the decline in U.S. Treasury yields since mid-4Q has actually helped to ease financial conditions to some extent.
The futures market is currently pricing in a pace of cuts similar to past recession periods, which is likely not what we are heading into. With current market expectations of 135bps cuts in 2024, even after dialing back from 167bps in mid-Jan, is still much more than the Fed’s median projection of 75bps, raising the risk of markets being disappointed. As for timing, markets are now implying a 46.6% probability of a 25bps cut in the March Federal Open Market Committee (FOMC) meeting (already down from 75.6% probability expected back in December). While we think the first cut will likely only come in the summer, the Fed disappointing markets on the timing of the first cut is likely to be less concerning than a disappointment in the magnitude of cuts, which impacts the level of real rates by end of year. Thus, the FOMC minutes for the January meeting (released in February) will be key to watch for further signals.
Having said that, with real rates approaching 3% now, we are almost certainly at the end of the hiking cycle. It is worth noting that although recent Fed officials have pushed back on market expectations of the pace and magnitude of cuts, they have not pushed back against expectations of a pivot. However, there are still risks of an interest rate shock if inflation flares up from further geopolitical tensions.
The good news is, while a non-recessionary period doesn’t necessitate a dramatic pace of cut, as seen in Exhibit 1, the 12-month forward returns for risk assets (equities and corporate bonds) have historically been constructive.
Exhibit 1: Asset class returns following the start of rate cuts
12-month returns* after the first rate cut in the past six rate hike cycles
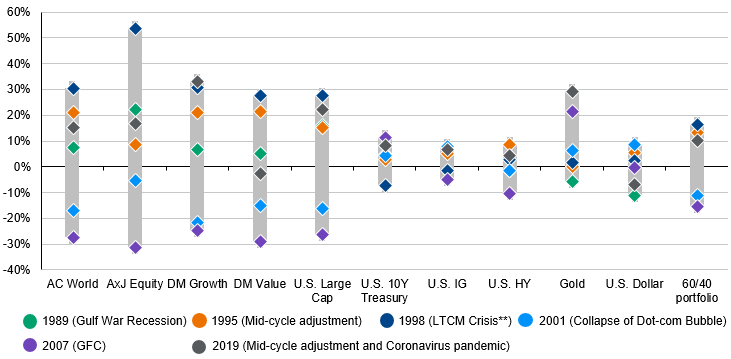
Source: FactSet, U.S. Federal Reserve, J.P. Morgan Asset Management. Based on MSCI AC World Index (AC World), MSCI Asia Pacific ex-Japan Index (AxJ Equity), MSCI World Growth Index (DM Growth), MSCI World Value Index (DM Value), S&P 500 (U.S. Large Cap), Bloomberg U.S. Treasury Bellwethers 10Y (U.S. 10Y Treasury), Bloomberg U.S. Corporate Investment Grade Index (U.S. IG), Bloomberg U.S. Credit Corporate High Yield (U.S. HY), Gold New Spot price (Gold), U.S. dollar index (U.S. dollar), 60% AC World and 40% Global Bonds (60/40 portfolio). The first rate cuts occurred in Jun ‘89, Jul ‘95, Sept ’98, Jan ‘01, Sep ‘07, Aug ‘19. *Total returns in local currency are used, unless otherwise specified. **LTCM refers to Long-Term Capital Management. Data reflect most recently available as of 31/12/23.
Thus, against a backdrop of easing monetary policy and resilient growth, we do see an environment remaining favorable for risk assets. While U.S. exceptionalism in equity markets persisted in 2023 and year-to-date, a weaker U.S. dollar along with the Fed’s pivot would be a tailwind for Asian assets. Better export performance and undemanding valuations add to the region’s appeal. As for credit, credit conditions will likely stabilize and help to limit spread widening. Although yields have crept back up, the current carry on high quality credit remains attractive.