
Expectations for disinflation, a September rate cut, resilient growth and a potentially more favorable tax and regulatory environment under a Republican Sweep all contributed to the significant rotation in the markets that has followed the June CPI report.
In brief
- After a long period of outperformance by mega-cap tech stocks, small cap performance saw a bounce back recently.
- Will it continue? It seems like valuations may be the only particularly exciting thing about small caps right now.
- While we believe market performance will continue to broaden outside of mega-cap tech, the strength of the rotation into small caps seems premature given weak fundamentals.
U.S. mega-cap tech has enjoyed a long winning streak, but the stars recently began to align for the underdogs to take the lead. In the U.S., earnings reports, expectations for disinflation, a September rate cut, resilient growth and a potentially more favorable tax and regulatory environment under a Republican Sweep all contributed to the significant rotation in the markets that has followed the June consumer price index (CPI) report. Many areas of the markets benefitted, but small cap stocks were a standout. Since July 12, the Russell 2000 has returned +6.4% while the S&P 500 is down -2.2%1. Can this performance continue?
Weak fundamentals prevail: small caps are less profitable and more rate sensitive than their larger counterparts
High interest rates have pressured many areas of the U.S. economy, but small caps have been acutely exposed given higher debt burdens. An elevated number of small cap companies are currently unprofitable, and a larger proportion of their debt is floating rate, leaving interest coverage ratios much weaker than that of mid and large caps.
However, higher rates haven’t always been the downfall for small caps. Historically, higher rates have been associated with small cap outperformance2. This is because when rates were rising for “good” reasons (i.e. strong economic growth), small caps tended to see their earnings grow faster than the burden of rising interest costs.
As such, growth matters more than rates, but we are not convinced it can come to the rescue this time. Small cap earnings growth should inflect from negative to positive in 3Q24, but analysts are expecting a robust 21% year-over-year growth for the S&P 600 in 4Q24 with high double-digit growth projected through 2025. There does not seem to be a catalyst for earnings this strong—gross domestic product growth is slowing, and the Federal Reserve’s easing cycle should be gradual. Indeed, small cap earnings estimates have already been revised down significantly, and there is likely more to come.
Small cap valuations and subsequent 1yr & 5yr returns
S&P 600 Total Return Index; forward P/E (x-axis) and subsequent returns (y-axis) 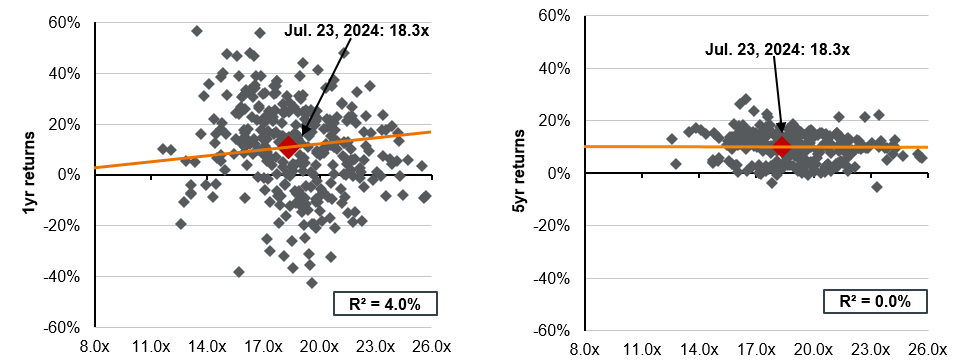
Source: Bloomberg, FactSet, Standard & Poor’s, J.P. Morgan Asset Management. Returns are 12-month and 60-month annualized total returns, measured monthly, beginning 12/31/1994. R² represents the percent of total variation in total returns that can be explained by forward price-to-earnings ratios. Price-to-earnings is price divided by consensus analyst estimates of earnings per share for the next 12 months as provided by Bloomberg. The Russell 2000 and the S&P 600 are the most commonly used small cap benchmarks. In the above chart, we show the S&P 600, which is rebalanced quarterly and represents a higher quality index compared to the Russell 2000. Since the S&P 600 requires a company’s trailing four quarters of earnings to be positive at the time of inclusion, it often trades at cheaper valuations than the Russell 2000, which is based solely on market cap and is rebalanced annually.
Data are as of June 24, 2024.
Cheap doesn’t mean good
Relative to the S&P 500, the S&P 600 is currently cheaper than it has been 80% of the time over the past 25 years3. Perhaps small caps are unduly priced for the “worst”. Debt burdens are elevated, but at 4.4x EBITDA, they are still below their 10-year average of 4.8x, and the Fed easing could provide some refinancing relief4.
Small caps also offer opportunities for alpha─80% of the universe is either thinly covered by analysts or not covered at all5. Granted, thinly traded markets leave investors exposed to volatility and technical factors too. The magnitude of the recent small cap rotation has been partially attributed to hedge funds working to close a near record number of short positions.
We think there may be room for small caps to recover off depressed valuations. However, small cap fundamentals remain muted, and sometimes you get what you pay for. Valuations alone are not a strong indicator of small cap returns. While the forward price-to-earnings ratio can explain 26% of the five-year return for the S&P 500, it has almost no predictive power for the S&P 600 as seen in the Exhibit above.
Investment implications
Overall, it seems like valuations may be the only particularly exciting thing about small caps right now. While we believe U.S. market performance will continue to broaden outside of mega-cap tech, the strength of the rotation into small caps seems premature given weak fundamentals. Instead, lesser-loved areas of large cap or mid cap markets may provide better grounds for opportunity.