
The US market has had a great run in recent times but performance so far in 2025 has been more muted, with investors moving into other markets. With innovation still a key driver, can US equities continue to shine?
The US market has had a great run. It has been the best performing major market over five of the past seven years to 20241 and over the trailing 10-year period, the S&P 500 delivered an average 15.6% p.a. for sterling-based investors, more than double the 6.2% average annual return of the FTSE All Share Index1.
Performance so far in 2025 has been more muted. Investors concerned that US tariffs will fuel domestic inflation and slow growth have rotated into other markets with better economic prospects. The S&P 500 rose by 5.2% in the year to mid-September (in sterling terms), while all other major markets realised double digit gains, led by Europe (ex-UK), emerging markets and Asia (ex-Japan), all of which returned more than 18% on the same basis1.
US earnings strength
However, the US equities team at J.P. Morgan Asset Management retain their conviction in the innovation and growth potential of the US market. Ultimately, markets are driven by earnings growth, and analysts anticipate US earnings growth of around 11% this year2. This compared with a small decline in forecast earnings growth in European equities2.
US earnings are being supported by a huge surge in AI-related investment – capital expenditure by the US’s five largest cloud services providers, including Amazon Web Services (AWS) and Google Cloud, has been rising rapidly. It is forecast to reach $250bn in 2025 and $300bn p.a. in each of the following three years3. Years of investment of this magnitude will benefit not only the mega cap tech companies, but also downstream providers of data centres, infrastructure, energy and a range of related businesses, and sets the scene for persistently robust earnings growth over the remainder of this decade.
There are concerns that expenditure of this magnitude is a warning sign of a possible AI bubble, a disturbing prospect for investors who endured the bursting of the dot.com bubble in 2000. However, the team believes that such concerns are ‘not warranted’ in this case. Their view is based partly on the fact that, unlike the dot.com boom, the current surge in AI capital expenditure is being funded from companies’ existing earnings streams, rather than by debt. The team draws further comfort from the current behaviour of corporate credit markets, which tend to be more sensitive than equity markets to potential risk. Credit spreads are presently trading close to their all-time lows, which is a clear indication that bond investors are not worried about issuers’ capacity to generate sufficient free cash flow to service their debt.
Source: https://citywire.com/investment-trust-insider/news/jpm-s-caffrey-ai-bubble-fears-are-not-warranted/a2475778?re=135443&refea=1911801&link_id=1958459
Deep research resources and active management
J.P. Morgan Asset Management may be a logical choice for investors keen to access the growth opportunities on offer in the US market. As one of the largest managers of US equities, we have a 40-strong team of domestically based fundamental analysts, engaging with companies and seeking unique insights that others miss.
Advocating an active investment approach, we believe that this gives Portfolio Managers the flexibility to fully capitalise on opportunities, exploit market inefficiencies and manage risk – an especially important consideration at present, when investors need to navigate challenges around high valuations, headline risk, geopolitical tensions and other potential sources of short-term market volatility.
Two US equity investment trusts
We offer two actively managed investment trusts focused exclusively on the US market:
- JPMorgan American Investment Trust (JAM) is designed to be a core US equity product, that combines the best ideas from the company’s value and growth Portfolio Managers. This is a high conviction portfolio of 20-40 large cap stocks, complemented by a small cap allocation. The value team is focused on finding quality businesses with strong cash flows, durable franchises, good management teams and attractive valuations. The trust’s growth managers concentrate on finding opportunities under-appreciated by the market. In addition to holdings in a handful of mega cap tech companies, the growth portfolio also includes stocks from several other sectors, including Capital One Financial, one of the US’s largest credit card providers and a top performer over the past year, and Booking Holdings, a hotel booking service using technology to transform the travel industry.
- JPMorgan US Smaller Companies Investment Trust (JUSC) invests in smaller companies and may appeal to investors who already own larger cap US stocks and are seeking broader exposure to other attractively valued opportunities on offer in the US market. Portfolio holdings include smaller tech names such as semiconductor producer Allegro Microsystems and consumer companies such as childcare provider Bright Horizons, positioned to benefit from shifting consumer trends.
Both these trusts have delivered strong returns and outperformed their respective benchmarks over the long term. JAM realised a total return of 360% in the ten years ended 31 August 2025, ahead of the S&P500 return of 333%4, while JUSC rose 163% over the same period, just ahead of the Russell 2000 Index return of 161%4.
US companies - shaping the future and driving market gains
The US is home to some of the world’s fastest growing, most innovative businesses, not just in the tech sector, but across the market. These companies will continue to drive change, earnings growth, and market gains for the foreseeable future. Our two US-focused investment trusts offer access to this vibrant market, for investors seeking a core US holding, and for those wanting exposure to a broader array of smaller companies. Both trusts offer a portfolio of high-quality stocks managed by experienced investment professionals who take an active approach and aim to achieve long-term growth, while also seeking to manage risk in changing market conditions.
The securities above are shown for illustrative purposes only. Their inclusion should not be interpreted as a recommendation to buy or sell.
Image: Shutterstock
Sources:
1 Guide to the Markets, as at 30 September 2025, slide 62:
https://am.jpmorgan.com/gb/en/asset-management/adv/insights/market-insights/guide-to-the-markets/
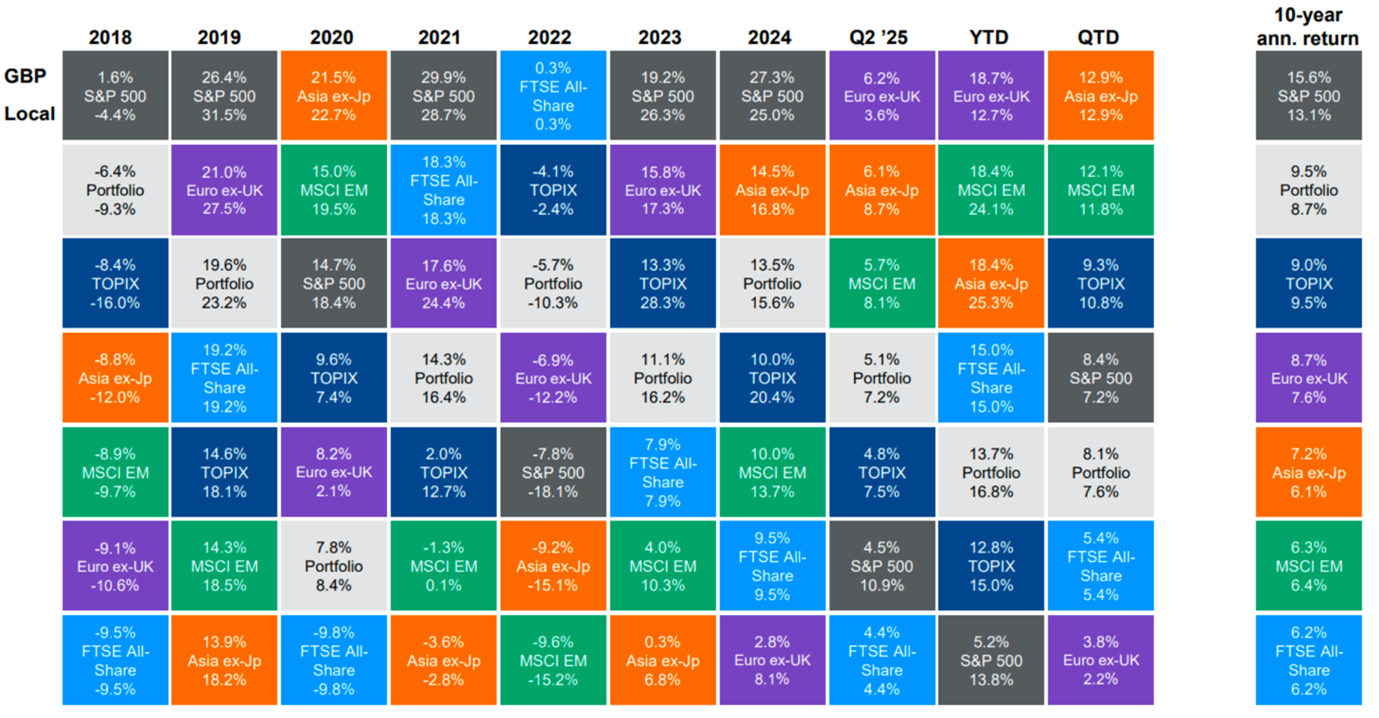
LSEG Datastream, MSCI, S&P Global, TOPIX, J.P. Morgan Asset Management. Hypothetical portfolio (for illustrative purposes only and should not be taken as a recommendation): 25% FTSE 100;25% S&P 500; 15% EM; 15% Euro ex-UK; 10% Asia ex-Japan; 10% TOPIX. All indices are total return. Past performance is not a reliable indicator of current and future results.
2 Guide to the Markets, as at 30 September 2025, slide 44:
https://am.jpmorgan.com/gb/en/asset-management/adv/insights/market-insights/guide-to-the-markets/
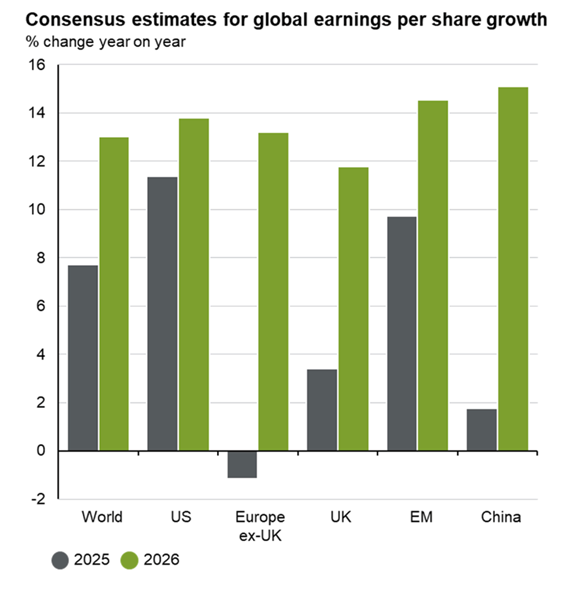
FTSE, IBES, LSEG Datastream, MSCI, S&P Global, J.P. Morgan Asset Management. MSCI indices are used for World, Europe ex-UK, EM and China. UK is FTSE All-Share and US is S&P 500. Earnings revision ratios are based on 12-month forward earnings expectations, as published by IBES. Past performance is not a reliable indicator of current and future results.
3 Guide to the Markets, as at 30 September 2025, slide 61:
https://am.jpmorgan.com/gb/en/asset-management/adv/insights/market-insights/guide-to-the-markets/
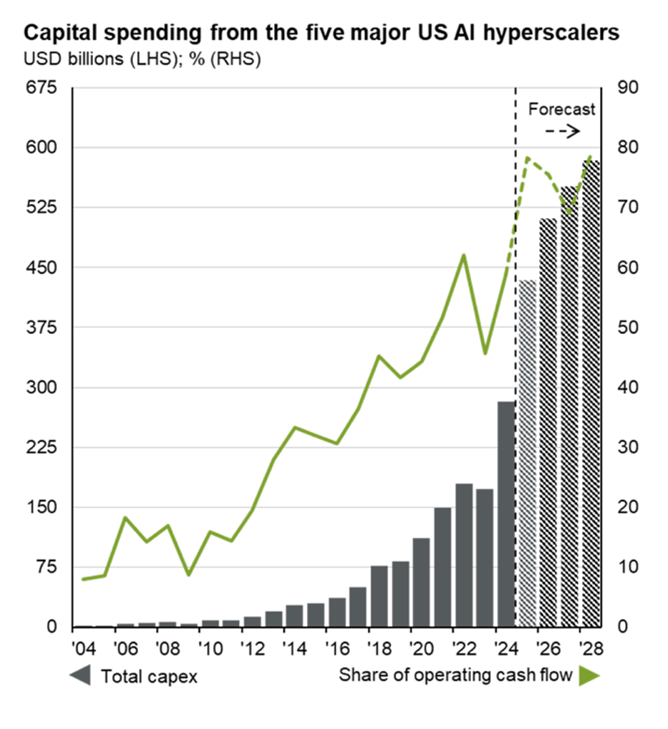
Bloomberg, J.P. Morgan Asset Management. The chart shows the total company capex for Alphabet, Meta, Microsoft and Oracle, as well as an estimate of Amazon’s AWS spend. For Amazon, 2004 to 2012 are J.P. Morgan Asset Management estimates, and 2013 to current are Bloomberg consensus estimates. Operating cash flow represents cash flow before capital expenditures.
4 J.P. Morgan Asset Management. Trust size as of 18 September 2025. Net asset value performance (NAV) data has been calculated on a NAV to NAV basis, including ongoing charges and any applicable fees, with any income reinvested, in GBP.
NAV is the cum income NAV with debt at fair value, diluted for treasury and/or subscription shares if applicable, with any income reinvested. Share price performance figures are calculated on a mid-market basis in GBP with income reinvested on the ex- dividend date. The performance of the company's portfolio, or NAV performance, is not the same as share price performance and shareholders may not realise returns which are the same as NAV performance.
JPMorgan American Investment Trust

The risk indicator assumes you keep the product for 5 year(s). The risk of the product may be significantly higher if held for less than the recommended holding period.
Investment objective
The Company aims to achieve capital growth from North American investments by outperformance of the Company's benchmark, the S&P500 Index, with net dividends reinvested, expressed in sterling terms. The Company emphasises capital growth rather than income and when appropriate may have exposure to smaller capitalisation companies. The Company's gearing policy is to operate within a range of 5% net cash to 20% geared in normal market conditions.
Risk profile
Exchange rate changes may cause the value of underlying overseas investments to go down as well as up. External factors may cause an entire asset class to decline in value. Prices and values of all shares or all bonds and income could decline at the same time, or fluctuate in response to the performance of individual companies and general market conditions. This Company may utilise gearing (borrowing) which will exaggerate market movements both up and down. This Company may also invest in smaller companies which may increase its risk profile. The share price may trade at a discount to the Net Asset Value of the Company. The single market in which the Company primarily invests, in this case the US, may be subject to particular political and economic risks and, as a result, the Company may be more volatile than more broadly diversified companies.
JPMorgan US Smaller Companies Investment Trust

The risk indicator assumes you keep the product for 5 year(s). The risk of the product may be significantly higher if held for less than the recommended holding period.
Investment objective
The Company aims to provide investors with capital growth by investing in US smaller companies that have a sustainable financial competitive advantage. As the emphasis is on capital growth rather than income, shareholders should expect the dividend to vary from year to year. The Company focuses on owning equity stakes in businesses that the manager believes trade at a discount to intrinsic value, with strong management teams. The Company has the ability to use borrowing to gear the portfolio within a range of 5% net cash to 15% of net assets.
Risk profile
Exchange rate changes may cause the value of underlying overseas investments to go down as well as up. External factors may cause an entire asset class to decline in value. Prices and values of all shares or all bonds and income could decline at the same time, or fluctuate in response to the performance of individual companies and general market conditions. This Company may utilise gearing (borrowing) which will exaggerate market movements both up and down. This Company invests in smaller companies which may increase its risk profile. The share price may trade at a discount to the Net Asset Value of the Company. The single market in which the Company primarily invests, in this case US, may be subject to particular political and economic risks and, as a result, the Company may be more volatile than more broadly diversified companies.