The disappearing small cap premium
Before the Covid pandemic, smaller company stocks often proved a good choice for investors able to take on more risk to potentially enhance their portfolio returns. Smaller companies had provided long-run returns in excess of those produced by larger companies for several decades, which left small cap stocks trading at higher valuations than corresponding large cap indices. A greater prospect for mergers and acquisitions, lower liquidity, and an inherently bigger growth potential were commonly cited reasons for this small cap valuation premium.
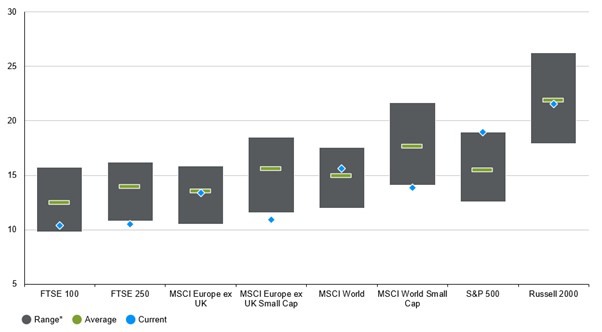
However, after an extended period of smaller company underperformance, the small cap premium has disappeared. Based on the forward price-to-earnings (P/E) ratio, a common valuation measure that compares forecasts for company profits over the next year to current share prices, the MSCI World Small Cap Index now trades well below the MSCI World Index.
FORWARD P/E RATIOS
x, multiple

Source: Factset, FTSE, IBES, LSEG Datastream, MSCI, Russell, S&P Global, J.P. Morgan Asset Management. Forward P/E ratio is price to 12-month forward earnings. MSCI small cap forward P/E ratio data is as published by Factset. Other P/E ratios are calculated using IBES earnings estimates. Range and average calculated over last 20 years of monthly data. *Range is 10th to 90th percentile. Data as of 24 November 2023.
Where has the small cap premium gone?
Part of the reason the small cap valuation premium has disappeared is that, on average, smaller companies are more sensitive to the economic cycle than larger firms. Small cap stocks therefore look less attractive later in the economic cycle, when recession risks are lingering and, in particular, when interest rate risks are elevated.
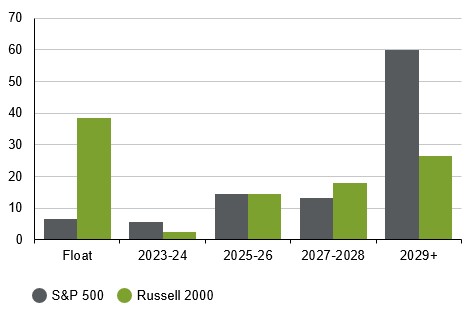
Smaller companies are more vulnerable to recent interest rate rises – the largest increases in several decades – because they are more likely to have variable rate debt than larger companies. For example, 38% of Russell 2000 debt (excluding financial firms) is floating rate, vs. an equivalent 7% for the S&P 500.
OUTSTANDING DEBT BY MATURITY YEAR
Ex. financials, % of total USD-denominated debt outstanding

Source: Bloomberg, Russell, S&P Global, J.P. Morgan Asset Management. Data as of 24 November 2023.
Structural challenges have also brought down the small cap premium. Today, large amounts of private equity and venture capital compete with public markets to provide equity financing for smaller companies. Increasing numbers of promising businesses are deciding to stay private or postpone public listings, deterred by increasing regulation in public markets. Smaller firms are also more frequently taken private today than in the past.
As a result, over the past decade small cap indices have measurably declined in quality. Before the financial crisis, unprofitable firms averaged a 27% share of the Russell 2000; today, that figure is 45%. Thus, investors are probably justified in demanding a higher risk premium for smaller cap stocks than in the past, which is reflected in their lower valuations.
As well as a decline in quality, the sector mix of small cap indices shows that many higher-growth industries are now underrepresented. In the MSCI World Small Cap Index, the technology and communications sectors are weighted 12 and four percentage points lower than in the MSCI World. By contrast, industrials (20%) and real estate (8%) feature heavily. As a result, revenue growth across large and small cap indices has converged. Average US small cap revenue growth has not exceeded large cap revenue growth from 2010 to date.1
A more positive outlook for smaller companies
Given these structural challenges, we would not expect the small cap valuation premium to return to the circa 50% seen on average over the last 20 years.2 Nonetheless, as cyclical headwinds fade small cap stocks could rerate from currently depressed valuations.
Buying smaller companies during recessions has historically been a winning strategy, as the likelihood of central bank interest rate cuts and prospects of an economic recovery boost smaller firms over their larger counterparts. Over the three years following the start of a recession, the Russell 2000 has outperformed the S&P 500 by an average of 22 percentage points.3 Past performance is not a reliable indicator of current and future results.
Thus, while it may be too early to take advantage of historically attractive small cap valuations, at some point we expect a modest small cap premium to return. Our base case for 2024 expects mild recessions across developed markets. This scenario could present an opportunity for longer-term investors in the smaller company segments of equity markets – although given the larger quality dispersion of small cap indices, an active approach is likely prudent.
J.P. Morgan Asset Management’s investment trust offering includes three Small Cap Investment Trusts:
More Insights
1 Both US large cap and US small cap annualised revenue growth from 2010 to date is 5.1% (Factset).
2 MSCI World Small Cap vs. MSCI World median forward P/E ratios.
3 Since 1979, when Russell 2000 price data begins.
This is a marketing communication and as such the views contained herein are not to be taken as advice or a recommendation to buy or sell any investment or interest thereto. Reliance upon information in this material is at the sole discretion of the reader. Any research in this document has been obtained and may have been acted upon by J.P. Morgan Asset Management for its own purpose. The results of such research are being made available as additional information and do not necessarily reflect the views of J.P. Morgan Asset Management. Any forecasts, figures, opinions, statements of financial market trends or investment techniques and strategies expressed are, unless otherwise stated, J.P. Morgan Asset Management’s own at the date of this document. They are considered to be reliable at the time of writing, may not necessarily be all inclusive and are not guaranteed as to accuracy. They may be subject to change without reference or notification to you. The value of investments and the income from them may fluctuate in accordance with market conditions and investors may not get back the full amount invested. Past performance and yield are not a reliable indicator of current and future results. There is no guarantee that any forecast made will come to pass. J.P. Morgan Asset Management is the brand name for the asset management business of JPMorgan Chase & Co. and its affiliates worldwide. To the extent permitted by applicable law, we may record telephone calls and monitor electronic communications to comply with our legal and regulatory obligations and internal policies. Personal data will be collected, stored and processed by J.P. Morgan Asset Management in accordance with our EMEA Privacy Policy www.jpmorgan.com/emea-privacy-policy.
09hl231512105907


