JPMorgan American Investment Trust plc (JAM) has delivered strong returns by investing in a disciplined mix of growth and value ideas.
How does a concentrated US large cap portfolio with less exposure to the technology sector and an equal mix of value and growth stocks manage to outperform an index powered by the Magnificent Seven technology stocks?
It starts with JAM’s focused and disciplined investment process to select 20 growth stocks and 20 value stocks. The growth and value portfolio managers source ideas from J.P. Morgan Asset Management’s 40 dedicated US equity research analysts and know exactly what they are looking for.
Both teams seek quality franchises, with strong management teams that can execute on business plans. The value team is not focused on deep value opportunities but rather durable businesses with strong cash flows and high returns on invested capital that are trading at attractive valuations. The growth team is looking for companies with large and/or growing addressable markets, sustainable competitive advantages and underappreciated growth. The team does not look for a specific level of growth but rather evidence of a positive inflection on financial results that may come from a new technology boosting sales or margin expansion.
Bottom up yet balanced
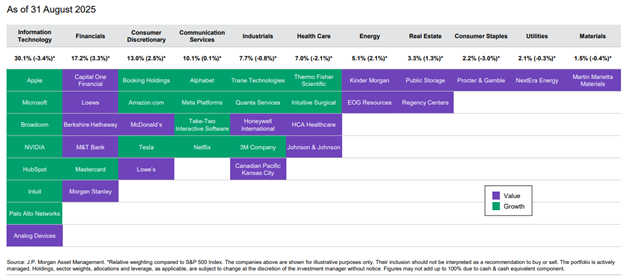
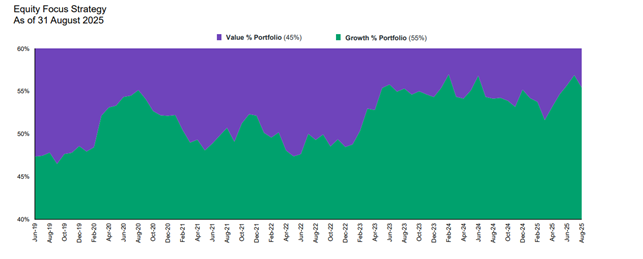
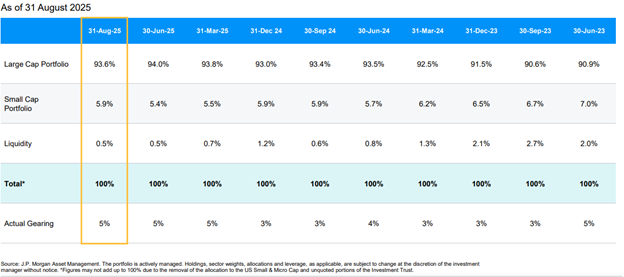
JAM’s portfolio is built stock by stock, as each name clears a high hurdle to be considered as one of the 40 best ideas across US large cap value and growth equities. While each style is limited to a maximum of 20 large cap names, the weighting can tilt to 60%/40%—it’s currently 55%1growth/45%1 value—and the portfolio also holds 6%2 in a small cap blend fund.
The resulting mix of holdings looks very different from the index. For example, while 30%3 of the portfolio (the largest sector weighting) is invested in technology stocks, including many of the big growth companies, it’s also the largest underweight vs. the benchmark. Similarly, while the top five holdings are currently all growth technology or communications stocks, the top five overweight positions are all value names and mostly in the financials sector.
Indeed, financials stocks currently account for 17%3 of the portfolio, which is also the largest sector overweight. However, the companies have unique attributes and drivers. For example, Mastercard *is the only growth financial company in JAM’s portfolio. This global credit card company provides access between merchants and banks that issue credit cards and collects a fee on every transaction processed, creating a recurring revenue stream.
JAM also owns Loews*, a conglomerate that owns 90% of a property and casualty insurance business in addition to a hotel chain and pipeline business. Insurance premiums collected by the company provide financing to build new hotel and pipeline assets that can create additional sources of growth.
Upside from underappreciated assets
Both the growth and value teams look for companies with businesses or assets that may be underappreciated by the market or that could be improved to create more value. The portfolio managers also consider a company’s potential to create value for shareholders by internally reallocating capital, engaging in mergers and acquisition activity, buying back shares or paying dividends.
Capital One Financial*, a top holding in the portfolio, demonstrates some of these possibilities. The company is the largest issuer of prime credit cards and has built a strong model based on careful attention to customer credit metrics and patterns. The portfolio managers believe that this unique and underappreciated customer data set can provide a path towards growth over the long term. In the near term, Capital One* has an opportunity to realise cost synergies from its merger with Discover Financial, a mass-market credit card provider, as Discover can process transactions on its own network. The potential for lower interest rates could also help reduce funding costs for Capital One*.
These types of underappreciated assets also exist in the healthcare sector. JAM has a position in HCA, a large hospital chain that has a massive data set containing detailed information on doctor and hospital performance. Although health care stocks have recently been volatile due to concerns over regulatory changes, the sector now trades at a discount to the broader market, whereas it usually trades at a similar multiple or premium. The JAM portfolio managers believe that HCA will be supported by inelastic hospital demand—people get sick and must get care—and an ageing population.
The investment team came to a different conclusion on UnitedHealth. This large health insurer also has a large data set that could be monetised and used in pricing decisions. However, the management team did not execute well and after several meetings, the portfolio team decided to exit the position.
Navigating volatile markets
While JAM has outperformed the S&P 500 in 2023 and 2024, as well as over three and five years to the end of August 2025, more recent performance is lagging the benchmark. The JAM portfolio managers are experienced in navigating changing and volatile markets, and remain focused on driving performance for the portfolio over the long term.
*The securities above are shown for illustrative purposes only. Their inclusion should not be interpreted as a recommendation to buy or sell.
Source:
1
Source: J.P. Morgan Asset Management. The portfolio is actively managed. Holdings, sector weights, allocations and leverage, as applicable, are subject to change at the discretion of the investment manager without notice.
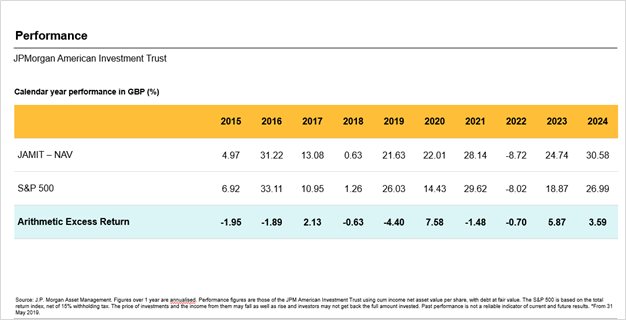
Source: J.P. Morgan Asset Management. Figures over 1 year are annualised. Performance figures are those of the JPM American Investment Trust using cum income net asset value per share, with debt at fair value. The S&P 500 is based on the total return index, net of 15% withholding tax. The price of investments and the income from them may fall as well as rise and investors may not get back the full amount invested. Past performance is not a reliable indicator of current and future results. *From 31 May 2019.
2
3