Factor Views Q4 2019
Jedes Quartal treffen sich unsere Beta-Spezialisten zu einem Research Summit und diskutieren die aktuellen Marktthemen und deren Implikationen. Erfahren Sie mehr in unseren englischsprachigen vierteljährlichen „Factor Views“.
In brief
- Factor performance was positive, on balance, recovering from a weak second quarter despite continued trade tensions and evolving monetary policy.
- Amid market volatility, equity factors rose, on average, with value and momentum experiencing a sharp reversal in the beginning of September.
- Event-driven factors were mixed, with merger arbitrage continuing to perform well while other factors generally underperformed.
- Macro factors were up across the board, faring well despite geopolitical uncertainty.
- We believe in diversifying across a broad range of compensated factors while minimizing exposure to uncompensated risks, and continue to find opportunities across markets.
Overview
Risk assets continued their climb in the third quarter, even as ongoing trade tensions and evolving monetary policy drove pockets of volatility both across and within markets. The VIX index more than doubled through August, and U.S. Treasury yields plunged by more than 60 basis points (bps) before partially rebounding in September. And after a long stretch in which equity momentum outperformed and value underperformed, the factors experienced one of their largest reversals in over 30 years. Despite these shifts, factors were broadly positive over the quarter—in fact, carry and momentum factors were positive across fixed income, currency and commodities markets.
While the moves in equity value and momentum were dramatic, we view them as a technical unwind that was more related to investor positioning than to a change in fundamentals, and continue to see equity value as attractive from a valuation perspective. Our base-case view is that major economies will remain in late-cycle territory; however, we acknowledge that the probabilities of recession and other tail risk events have likely risen. Given factors’ ability to provide uncorrelated, diversifying sources of returns, we think they are well positioned to navigate these potential scenarios.
Factors were broadly positive despite geopolitical uncertainty and pockets of volatility
Exhibit 1: Quantitative beta strategies long/short factor returns
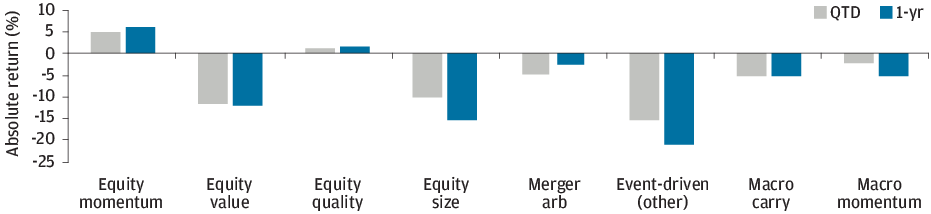
Source: J.P. Morgan Asset Management; data as of September 30, 2019. Note: Factors presented are long/short in nature. Equity factors represented as 100% long notional exposure, macro factors as aggregation of 5% vol sub-components. Valuation spread is a z-score between the median P/E ratio of top-quartile stocks and bottom-quartile stocks as ranked by the value factor.
Factors in focus
Equity factors: A mixed and tumultuous quarter
In early September, the equity value and momentum factors experienced one of their largest three-day reversals in over 30 years (Exhibit 2). While the timing and magnitude of these moves were surprising, context can provide a useful perspective on this event. First, after prolonged periods of underperformance by value and outperformance by momentum, both factors were becoming stretched from a valuation perspective and susceptible to reversals. [Note: We upgraded value to attractive in Q3 2018 and downgraded momentum to unattractive in Q4 2018]. Second, as we have highlighted throughout the year, there has been growing evidence of the linkage between value and interest rates, with a flatter yield curve statistically linked to weaker factor performance in the period following the global financial crisis (GFC).1 From mid-July to the beginning of September, interest rates fell over 60bps and the equity value factor plummeted—with both trends reversing course in early September on the back of U.S.-China trade hopes, healthy economic data and central bank optimism (Exhibit 3). Finally, as investors have increased their exposure to certain factors, so has the risk that volatility will move higher.2 Overall, we see the recent past as a period characterized by an increase in investor exposure to momentum/ growth stocks and away from value stocks, and view the September move as a technical (partial) unwind of these positions. Indeed, the negative correlation between value and momentum reached a cycle high over the quarter.
Value and momentum experienced sharp reversals
Exhibit 2: U.S. value vs. U.S. momentum

Source: FactSet, J.P. Morgan Asset Management; data as of September 30, 2019.
The value factor continued to track interest rates
Exhibit 3: U.S. value vs. 10-year yield

Source: FactSet, J.P. Morgan Asset Management; data as of September 30, 2019.
Longer term, we continue to see a strong tailwind to the value factor, which remains over 2 standard deviations cheap from a historical perspective (Exhibit 4). While an extension of the business cycle may present headwinds for the value factor, cheap valuations and an already visible downside in company fundamentals may serve as catalysts for the factor’s rebound.
Elsewhere, and despite another quarter of strong performance, we remain cautious about the prospects for minimum volatility, at least relative to recent performance. As we’ve noted in the past, minimum volatility has outperformed broad definitions of the quality factor in recent periods. However, on the back of a wave of investor flows and counter to their long-term history, minimum volatility stocks are now more expensive than their higher volatility peers. In fact, prior to the financial crisis, mini- mum volatility stocks were richer than their counterparts only once—in January 1990. In sum, we have reduced our return expectations for the minimum volatility factor.
On a historical basis, the value factor is more than 2 standard deviations cheap
Exhibit 4: Value factor valuation spread (global)

Source: J.P. Morgan Asset Management; data as of September 30, 2019. Note: Valuation spread is a z-score between the median P/E ratio of top-quartile stocks and bottom-quartile stocks as ranked by the value factor.
Event-driven factors led by merger arbitrage
The merger arbitrage factor was positive for a sixth consecutive quarter and continued to earn a healthy carry. The share buyback factor, on the other hand, was negative for a second consecutive quarter and has now fully reversed gains that occurred alongside a rise in activity levels following passage of the U.S. Tax Cuts and Jobs Act in December 2017. The majority of share buyback names underperformed over the quarter, and losses were broad across the energy, financials, information technology, health care and materials sectors. The spinoff factor was also negative for a second consecutive quarter, with losses similarly broad-based.
We maintain a positive outlook for event-driven factors, although this view is partially tempered by a fall in activity levels to neutral/below-average levels. That said, merger arbitrage spreads3 remain healthy, particularly in the context of a high proportion of deals characterized as friendly in nature, with such deals offering higher odds of completion than unfriendly deals and thus better prospects of earning investor returns.
Macro factors positive across asset classes
Carry and momentum factors delivered positive performance across the board in the third quarter as they navigated the September reversal in equity value–equity momentum. Fixed income factors benefited from a broad-based decrease and convergence in yields (with Australian bonds rallying in particular), currency factors found support in the continued underperformance of the euro and Swedish krona (both of which are low yielding), and commodity factors benefited from moves across grains, softs, livestock and industrial metals.
While carry has enjoyed a strong run over the past year (especially in 2019), spreads are now below long-term averages, particularly across G10 government bonds. This suggests a diminished potential to capture carry in those markets going forward. Among momentum factors, dispersion in price moves is average across currencies and below average across commodities. The number of significantly trending levels remains high, with fixed income and equity markets trending positively across the globe while commodity markets are trending in a negative direction.
Concluding remarks
Factors performed well, on average, in the third quarter, despite an environment marked by geopolitical uncertainty. Looking ahead, we anticipate above-average opportunity sets for a number of factors; as always, we believe in diversifying across a broad range of compensated factors while minimizing exposure to uncompensated risks.
Factor Opportunity Set
The table below summarizes our outlook for each of the factors accessed by the Quantitative Beta Strategies platform. It does not constitute a recommendation but rather indicates our estimate of the attractiveness of factors in the current market environment.

Source: J.P. Morgan Asset Management; for illustrative purposes only.
*Other: Conglomerate discount arbitrage, share repurchases, equity index arbitrage, post-reorganization equities and activism.
Our framework for evaluating factor outlooks is centered on the concepts of dispersion, valuation and the opportunity for diversification. For equity factors, we measure dispersion and valuation spreads between top-quartile and bottom-quartile stocks on a market, region and sector-neutral basis. For event-driven factors, we measure implied carry and the level of corporate activity as indicative of the ability to minimize idiosyncratic stock risk. For macro factors, we measure the dispersion or spread between top-ranked and bottom-ranked markets, as well as the number of significantly trending markets.
1 Romahi, Y. and Norman, G., Factor Views, Q1 2019 and Q2 2019.
2 Romahi, Y., Staines, J. and Norman, G., “Far from the madding crowd: Factor investing through the cycle,” March 2018.
3 The difference between the target company stock price and the announced acquisition price.
Glossary
- Equity momentum: long/short global developed stocks, based on price change and earnings revisions; sector and region neutral
- Equity quality: long/short global developed stocks based on financial risk, profitability and earnings quality; sector and region neutral
- Equity size: long/short global developed stocks based on market capitalization; sector and region neutral
- Equity value: long /short global developed stocks based on book-to-price, earnings yield, dividend yield, cash flow yield; sector and region neutral
- Merger arb: long target company and short acquirer (when offer involves stock component) in announced merger deals across global developed markets
- Event-driven (other): conglomerate discount arbitrage, share repurchases, equity index arbitrage, post-reorganization equities and shareholder activism
- Macro carry: FX G10 carry, FX emerging market carry, fixed income term premium, fixed income real yield, commodity carry
- Macro momentum: FX cross-sectional momentum, commodity cross-sectional momentum and time series momentum across equity, fixed income and commodity markets