

Q3 2026
The MSCI All Country (AC) World Index has produced a robust performance of 11% in the first six months of the year, well above its historical average return of 5% for all six-month periods since 1990. But the first-half rally has been choppy, as its drivers morphed from the macro to the micro environment. Before the start of the war in the Middle East at the end of February, benign macroeconomic expectations for 2026 supported equities, as well as a broadening of returns outside of US equities. Europe was outperforming, but sentiment reversed as surging energy prices raised recession risks.
Having endured a 9% correction following the start of the war, global equities resumed their rally one month later, bolstered by exceptional earnings growth and improving earnings expectations. One feature of this rally, however, has been its exceptionally narrow breadth. Technology has driven more than 70% of the year-to-date performance of the MSCI AC World and S&P 500 indices, and 110% of the performance of the MSCI Emerging Markets Index. All of the positive revisions to MSCI AC World earnings estimates for 2026 have been driven by only two sectors: technology and energy. While episodes of narrow market breadth can last, they tend to be associated with higher levels of volatility and greater correction risk. As the first half of the year drew to a close, market leadership was tested, with the momentum factor delivering its sharpest sell-off since the early 2000s.
From here, we believe the equity rally has further legs, as the world avoids an energy crisis, global growth slows gradually rather than falling into recession, earnings hold up, and the artificial intelligence (AI) investment cycle continues to support profits. However, until we get more clarity on the productivity gains that AI usage will bring to end users, investors will remain nervous. We therefore believe that it makes sense to focus on areas of the tech sector where uncertainty is the lowest, diversify portfolios, and favour active equity strategies.
-
Strong earnings growth continues to drive the equity rally
-
Fed rate decisions will likely have short-term equity market impact
-
Amid AI uncertainty, favour the ‘picks and shovels’ and go global
-
Use active strategies to navigate tech and leverage alpha opportunities
Since the beginning of the year, all of the rally in the MSCI AC World Index has been driven by rising earnings estimates, rather than by multiple extension. In fact, multiples have contracted for most equity indices. The 12-month forward price-to-earnings (P/E) ratio fell by more than 2 points in the US and emerging markets, and by as much as 3.5 points in South Korea. This fall places the current S&P 500 12-month forward P/E at 20x, which is one of its lowest levels since 2020 if we exclude the bear market of 2022.
It is not only earnings expectations that are flying high. In the first quarter, the S&P 500 registered its best earnings season since 2021, with earnings per share (EPS) growing by 17% year on year, excluding some one-offs. Semiconductors posted an impressive 100% profit growth, but the EPS of the median stock also grew by a strong 13%. While the pace of earnings upgrades may slow, and the bar for the second-quarter earnings season to surprise on the upside is higher given the recent positive revisions, the current earnings season has started well, with record earnings posted from large US banks and an overall earnings surprise above 20%. The consensus expects earnings growth above 20% in the US for the second quarter (year on year), and above 10% in Europe over the first half.
The conflict in the Middle East has dented expectations for a rebound in consumer spending and a broadening of economic growth in 2026. But AI capital expenditure (capex) and government spending look likely to continue to fuel global growth. Once the Strait of Hormuz reopens and energy prices fall back, all economic engines should be up and running again in 2027. Meanwhile, we will be watching capex estimates during the current earnings season.
2026 year-to-date equity return decomposition
%, price returns
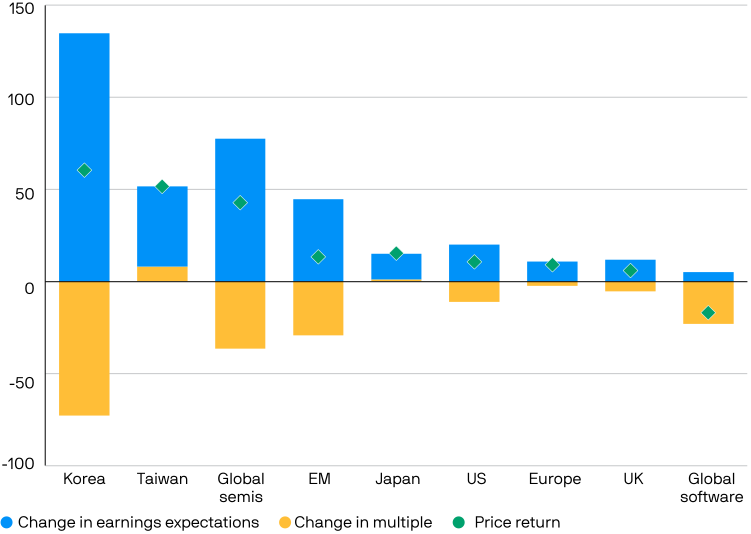
Source: FTSE, IBES, Korea Stock Exchange, LSEG Datastream, MSCI, S&P Global, Stoxx, Tokyo Stock Exchange, J.P. Morgan Asset Management. Global semis, global software, emerging markets (EM) and Taiwan are based on MSCI indices. Europe: Stoxx 600, Japan: TOPIX, Korea: KOSPI, UK: FTSE All-Share, US: S&P 500. Returns are shown in local currency (Europe in euros), with the exception of EM and the sector indices which are in US dollars. Earnings and multiples are based on 12-month forward earnings metrics. Past performance is not a reliable indicator of current and future results. Data as of 17 July 2026.
We expect the US Federal Reserve (the Fed) to keep interest rates on hold through 2027, as wage growth continues to decelerate, limiting persistent second-round inflation effects from higher energy prices. Although May and June inflation prints surprised to the downside, the re-escalation of the US-Iran war have sent energy prices higher and Fed Chairman Kevin Warsh recently said that the Federal Open Market Committee (FOMC) has “no tolerance for persistently elevated inflation”.
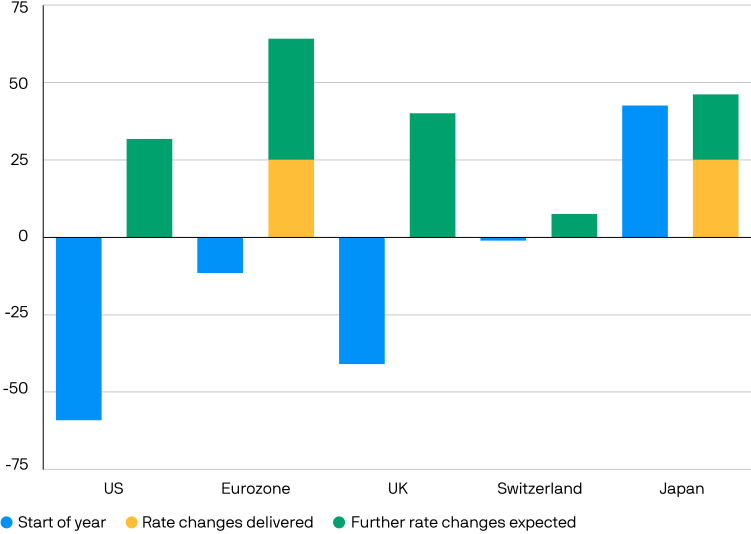
Market pricing currently implies one hike from the Fed by the end of the year, while more than two cuts were priced back in early January. If inflation data leads to a dovish shift in the Fed’s policy outlook, markets would likely reprice a Goldilocks backdrop (anchored interest rates and growth broadening), potentially offering another leg to the equity rally.
If the Fed instead raises rates, we believe that equities will initially struggle while the market assesses the length and magnitude of a potential hiking cycle. History shows that US equities typically fall in the three months following a first rate increase. However, what happens to growth tends to matter more than what happens to the discount rate. We therefore see two reasons for the correction to be relatively short-lived: first, valuations have recently contracted, limiting the magnitude of any potential derating; and second, we don’t think that a couple of rate hikes will materially derail the strength of the current corporate profit cycle.
Market expectations for interest rate changes in 2026
Basis points
Investors are likely to remain nervous until we get more clarity on the productivity gains that AI usage will provide for end-users. As a result, we believe it makes sense to favour the areas of technology where uncertainty is the lowest, the picks and shovels that are achieving strong pricing power and generating robust profits from bottlenecks in the AI supply chain. The earnings of US semiconductor manufacturers, for instance, grew 52% in 2025 and are expected to grow 106% in 2026, which is four times faster than the earnings of the S&P 500 and five times faster than those of the US hyperscalers.
For investors who can bear the volatility, the risk-reward profile of semiconductor stocks also appears attractive, with valuations having compressed following the recent correction. After soaring 116% between the beginning of the year and their June all-time highs, South Korean equities officially entered bear market territory in mid-July, down 20%. US semiconductors are down 10% from their peak, and now trade at 17.9x 12-month forward earnings, which is more than 2 points lower than the valuation of the S&P 500.
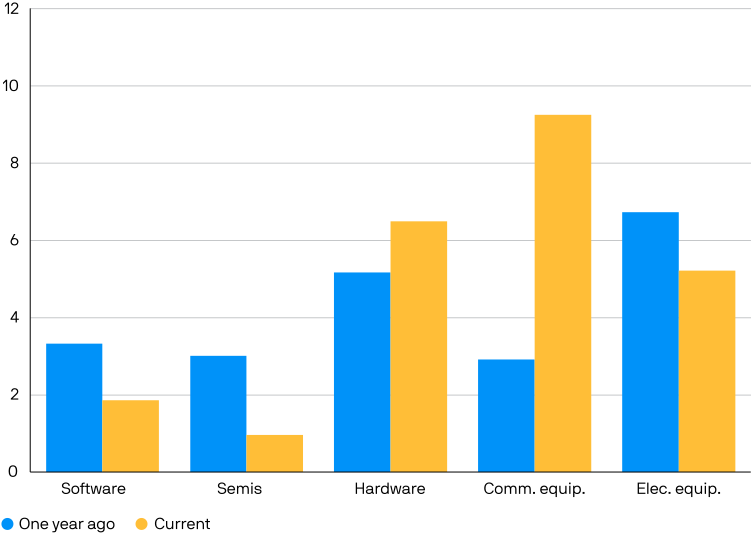
US equity trailing PEG ratios
x, multiple
While technology has been outperforming in the first half of the year, US equities have not, highlighting the fact that the tech investment cycle has broadened out well beyond North America. A large share of semiconductor manufacturers, electronic and electrical equipment companies, as well as industrials involved in the AI infrastructure build-out now sit in the emerging markets. While AI-related sectors make up around 50% of the S&P 500, we estimate they account for even more of the MSCI Emerging Markets Index. While investing in emerging markets does not therefore help to diversify away from the AI theme, the sector composition of the emerging markets index offers more exposure to the AI build-out compared to the US and China—which have a greater share of hyperscalers—and at lower valuations.
Equity index exposure to AI-related industries
%, index weight
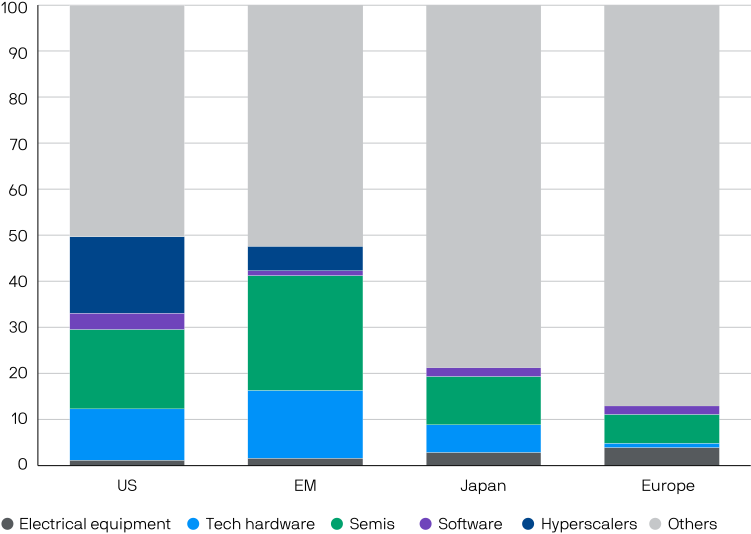
Source: LSEG Datastream, MSCI, S&P Global, J.P. Morgan Asset Management. MSCI indices are used for EM, Europe and Japan, US: S&P 500. US hyperscalers include Alphabet, Amazon, Meta, Microsoft and Oracle. Emerging market (EM) hyperscalers include Alibaba and Tencent. The US software weight is adjusted to exclude Microsoft and Oracle given they are counted as hyperscalers. Data as of 17 July 2026.
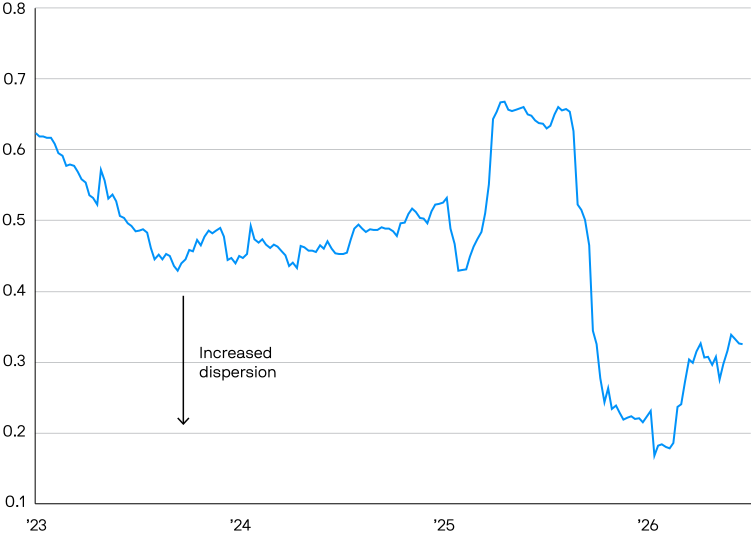
One reassuring development of the current equity rally triggered by the AI cycle is that investors have been rather discerning across stocks. The rising spread of returns between stocks means that alpha opportunities are higher, providing a positive backdrop for active stock pickers, as evidenced by increased dispersion among the US hyperscalers: while they used to move in unison, the spread of performance between the best (Alphabet) and worst (Oracle) performing stock among this group over the past year is a remarkable 148 percentage points.
A similar trend can be seen at the broad market level, where pairwise correlations (the extent to which stocks are moving together in the same direction) have fallen to a record low level in the US, and the dispersion of returns has reached its highest level since the Global Financial Crisis. Against this backdrop, it is becoming increasingly more important to pick the right stock than the right sector, particularly as we find that the dispersion of returns is rising faster within each sector than across sectors. Again, this dispersion in returns tends to favour stock pickers, rather than macro strategies.
Pairwise correlations of US hyperscalers
Average pairwise correlations based on rolling six-month daily returns
Source: LSEG Datastream, J.P. Morgan Asset Management. US hyperscalers include Alphabet, Amazon, Meta, Microsoft and Oracle. Data as of 17 July 2026.