The life insurance search for yield
Reaching for yield, which we define as buying bonds with wider spreads after controlling for sector and rating impacts, is a topic that frequently arises in the life insurance industry.
02-08-2019
In Brief
- The life insurance industry is skewed toward buying wider spread securities, which indicates a preference for capital efficiency and high book yields.
- Most insurers do not vary their behavior over time. Insurers that buy wider (or narrower) spread corporate bonds tend to do so year after year.
- The dispersion of excess yield across insurers may be larger than most realize. There is a 44bps difference in the 5-year average excess yield between insurers at the 10th and 90th percentiles. A 44bps difference can have a meaningful impact on earnings given the life insurance industry’s high leverage.
An Analysis of Recent Purchases
Reaching for yield, which we define as buying bonds with wider spreads after controlling for sector and rating impacts, is a topic that frequently arises in the life insurance industry. Due to the formulaic nature of regulatory and rating agency capital charges, the simple strategy of buying wider spread bonds generates the greatest yield for a given level of required capital. This strategy, however, is not without its drawbacks. Wider spread bonds tend to be of lower intrinsic quality and, thus, are more likely to experience downgrades and defaults. Even in the face of these increased risks, many insurers are drawn to these wider spreads, and thus higher yielding securities, for greater capital efficiency.
To better understand insurance company behavior, we analyzed the extent to which insurers reach for yield with their purchases. To do this, we studied investment-grade corporate bond purchases for the life insurance industry from 2014 to 20181. We quantified the degree to which insurers are reaching for yield by calculating a metric we refer to as “excess yield.” Excess yield is a bond-specific metric that we define as the difference between the insurer’s purchase yield and the yield on a custom index that matches the bond’s duration, quality and sector. Put another way, excess yield is a comparison between the insurer’s purchase yield and the equivalent point on a quality/sector curve (on the day of purchase). By aggregating excess yield across all purchases, we are able to identify the insurers that systematically buy with excess yield versus the overall market.2
The excess yield measure that we mentioned above is driven by a combination of two effects:
- Quality tilt – A bias toward lower or higher quality securities within our broad rating buckets (i.e., BBB- versus BBB+), and
- Spread tilt – A tilt toward wider or narrower spread securities within a given NRSRO rating notch.
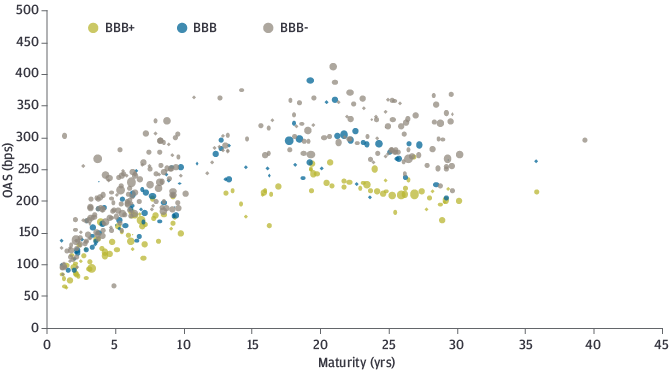
To illustrate the impact of these two effects, we show an OAS v. maturity scatter plot for BBB Energy in Exhibit 1 below. It’s clear from the chart that a low-quality tilt toward BBB- will result in greater excess yield. However, there is a large amount of dispersion among individual issuers, even such that some BBB+ issuers have higher OASs than BBB- issuers. In this analysis, we do not isolate the contributions from quality tilt and spread tilt. Instead, we show their combined effect since both items have the potential to contribute to high capital-adjusted yields.
Exhibit 1: OAS for BBB energy bonds (12/31/2018)
Source: Bloomberg, J.P. Morgan Asset Management; data as of December 31, 2018.
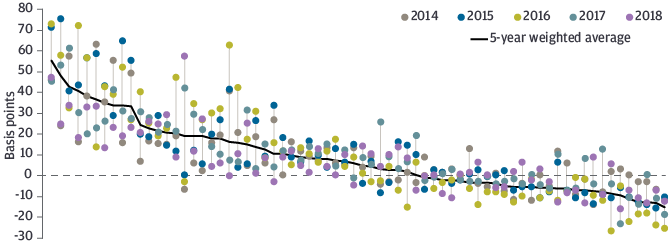
Exhibit 2 shows the results for 70 of the largest, most frequent corporate bond purchasers in the life insurance industry. The chart is sorted by average excess yield over the past five years. Insurers with the highest excess yields appear on the left, while those with the lowest appear on the right. We also plot excess yield on a year-by-year basis for each insurer, with the vertical lines indicating the 5-year range of excess yield. The industry is skewed toward buying wider spread securities (positive excess yield), which indicates a preference for capital efficiency. In addition, many insurers show consistency with respect to purchase behavior – they tend to buy the wider (or narrower) spread securities year after year.
Exhibit 2: Excess yield for each insurer (2014-18)
Source: Bloomberg, J.P. Morgan Asset Management; data as of December 31, 2018.
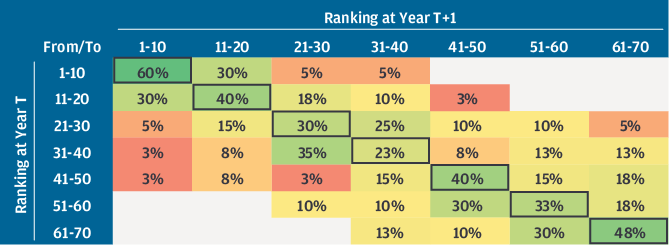
Exhibit 3 takes a more rigorous look at year-over-year consistency with respect to purchase behavior. In particular, we look at the year-over-year transition matrix of excess yield rankings. The table helps us visualize how likely a company is to move from a high ranking to low ranking over a one-year horizon. We show seven cohorts, which represent the rank orderings of excess yield for each year. Cohort 1-10 includes the life insurers with the 10 highest levels of excess yield in a given year. Similarly, cohort 61-70 contains those ranked 61-70 in terms of excess yield (i.e., the bottom 10). The meaning of the table is best illustrated with an example:
- The top row shows the historical transition frequencies from cohort 1-10 (the highest ranking cohort) to other cohorts.
- The number in the top left corner is 60%, indicating that the probability of staying in cohort 1-10 for another year was 60%.
- The second column in row one has a value of 30%, indicating that the frequency of moving from cohort 1-10 to 11-20 was 30%.
- Combining facts 2 and 3, we can deduce that if an insurer was in cohort 1-10 (i.e., top 10 companies in terms of excess yield), then 90% of the time it was in the top 20 the next year. It is also evident that no companies fell from the top 10 to the bottom 30 (i.e., cohorts 41-50, 51-60 or 61-70) over a one-year time frame.
A similar analysis can be performed for cohort 61-70 (i.e., the bottom 10 companies in terms of excess yield). If a company was in cohort 61-70, then there was a 78% chance that it would stay within the bottom 20 companies the next year (i.e., cohort 51-60 or cohort 61-70). The general trend is that companies tend to stay in or near their excess yield cohorts from one year to the next.
Exhibit 3: Probability of a YoY transition between ranked excess yield cohorts
Source: J.P. Morgan, Bloomberg and SNL Financial; data as of December 31, 2018.
The fact that we observe most life insurers generating positive excess yield was not surprising to us. What was surprising was the extent of the variation in excess yield and the consistency of behavior over time. Exhibit 3 above makes it clear that insurers exhibit very little tactical variation in corporate bond purchase strategies based on prevailing market conditions.
If you are an insurer and would like to see this data for specific insurers, groups of insurers or different time frames, please email the Insurance Strategy and Analytics team at Insurance_Strategy_and_Analytics@jpmorgan.com.
A note on total returns:
Due to the long-term, buy-and-hold nature of life insurance portfolios, it requires a downturn in the credit markets to assess performance from a total return perspective. Some insurers that have been reaching for yield may show solid earnings and capital efficiency at the moment, but may later experience higher downgrade frequencies and impairment losses. However, if the insurers that buy wider spread bonds ultimately realize impairment losses and migration performance comparable to their more conservative competitors, then they will have more attractive and capital efficient earnings over time.
1Our corporate bond universe consists of public corporates + 144As. It excludes Reg D private placements.
2The sub-indices were constructed by using Bloomberg Barclays Class 3 sectors and the following rating buckets: AA- or better, A- to A+, and BBB- to BBB+.
0903c02a8266b5a0


